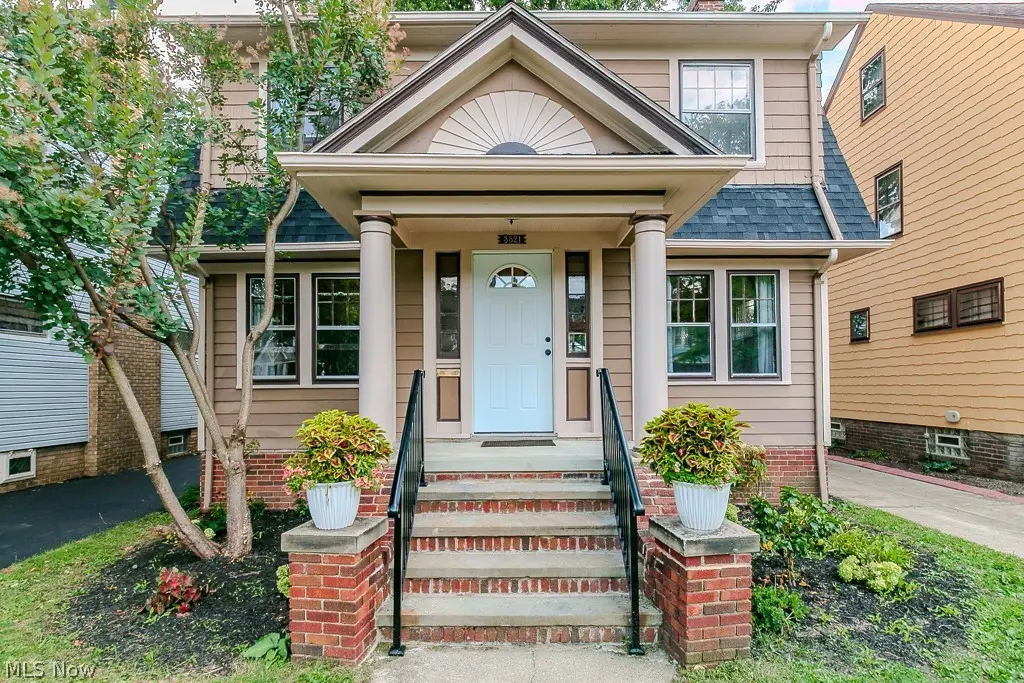
3821 Montevista Rd · Cleveland Heights, OH
Flood risk 1/10 · Minimal
- FEMA flood zone
- X (unshaded)
- Chance of flooding over 30 yrs
- 0.0%
- Est. flood insurance / yr
- $473 – $860
Fire risk 1/10 · Minimal
- Est. fire insurance / yr
- $713 – $1,323
Heat risk 2/10 · Minimal
- Hot days now (above 95°F)
- 7 days/yr
- Hot days in 30 yrs
- 16 days/yr
Wind risk 1/10 · Minimal
- Chance of severe wind over 30 yrs
- —
Air-quality risk 3/10 · Minor
- Unhealthy air days now
- 2 days/yr
- Unhealthy air days in 30 yrs
- 5 days/yr
Risk factors via First Street. Map © Google.
Why this score? — see what drove the D- grade
The composite is a weighted blend of 9 inputs, each scored 0–100. Each bar is that input's sub-score; the figure is the points it added to the 100-point composite (weight × sub-score).
- Cash flow +10.7/30.0
- Livability +4.5/5.0
- Rent growth +4.2/5.0
- ARV discount +4.0/15.0
- 1% rule +3.9/10.0
- DSCR +3.1/10.0
- Schools +2.8/10.0
- Condition / age +2.5/5.0
- Appreciation +0.0/10.0
$210,000
🖨 Deal sheet (PDF) 📄 Offer letter ✓ Due diligence
Listing remarks
Welcome home to this fully renovated colonial in the heart of Cleveland Heights!! This charming property has hardwood floors and fresh paint throughout and offers 3 bedrooms and 2 full baths, as well as a full walk-out basement with tons of storage. This property also features a huge bonus room on the third flood complete with sky lights and new carpet, allowing for endless possibilities. Some of the many updates include a brand new garage, brand new hot water tank, new roof shingles, all new kitchen appliances, new front porch, new vinyl floors in kitchen, new electrical panel and many more!! Fenced in yard allows options for a patio or a garden in the future. Located close to Cleveland Cl
Key facts
- Fully renovated
- New carpet
- Bonus room
Tags
Property features AI
Exterior
- Parking: Attached garage; Two garage spaces
- Utilities: Public water; Public sewer
- Home design: 2-story single-family home; Above-grade finished living area reported separately from below-grade finished area
- Construction: Frame construction; Asphalt/fiberglass roof
- Exterior features: Wood fencing; Lot dimensions approximately 40 x 165
Interior
- Kitchen: Eat-in kitchen; Dishwasher; Microwave; Range; Refrigerator
- Bedrooms: Two bedrooms on the second floor; Additional living suite on the third level
- Bathrooms: Two full bathrooms
- Heating & cooling: Gas heating; Hot water heating; Radiator or steam heating; Ceiling fans for cooling
- Interior features: Built-in features; Full basement with partial finish, storage space and walk-out access; One fireplace
- Laundry & utility: Laundry in basement
Neighborhood map
What this means for you Summary
Snapshot
- This is a 3-bed/1.0-bath single-family listed at $210k.
Deal economics
- At list price, monthly cash flow is $-99 ($-1k/yr) — negative.
- To cash-flow at today's rent, offer at most $192k (8.3% below list).
- To meet the 1% rule (rent ≥ 1% of price), the offer needs to be $187k (10.8% below list).
- Recommended offer: $187k (10.8% below list) — sets the bar for 1% rule.
- Cap rate 5.7% vs local median 4.3% in Cleveland Heights — top-decile yield for the area; either an underpriced asset or a hidden risk that comps aren't pricing in. Stress-test before assuming the spread holds.
Location & tenants
- Location reads 89/100 on livability (#12 in OH, #124 nationally) — a professional / high-income tenant draw. Strengths: amenities A+, commute A+, cost of living A+.
- Cleveland Heights-University Heights City (suburban): math 23% / reading 41% proficiency, ranked #568 of 656 in OH (top 87%) — families likely to look elsewhere, expect single-tenant / working-renter base with shorter leases; 64% free/reduced lunch — lower-income household profile, screen leases tightly.
- Market conditions: Rents rising fast (+6.8%/yr); 150 active listings in the ZIP; 40 comparable units currently listed for rent nearby; rentals at typical pace (median 18d on market — plan ~3-4 weeks tenant-placement turnaround); solid renter incomes; 1,441 units permitted in Cuyahoga County in 2024 (700 in 5+ unit buildings).
Forward outlook
- Local home prices are declining (-3.0%/yr); year-one equity from $1k of loan paydown is wiped out by about $6k of value loss. Plan a longer hold.
- Cuyahoga County population projected to shrink 8% by 2050 — rents likely to lag national; underwrite the cash flow, not the appreciation.
Negotiation context
- It's been on market 68 days — a 6% lower offer ($197k) is reasonable based on typical stale-listing flexibility.
- 8 sale attempts since 36y ago with the ask held roughly flat each time — persistent listings suggest the price (not the market) is what's stuck; bring a comps-based counter.
- Current owner paid $100k; list at $210k implies a 110% gain — meaningful room to come down on a strong offer.
Risks & watch-outs
- Watch-outs: built in 1927 — expect roof / HVAC / electrical / plumbing capex.
Questions for the listing agent
- What do current leases actually rent for vs. the listed asking? Can we see a recent rent roll and the last 12 months of T-12 income?
- It's been on market 68 days. Have you received any prior offers? Is the seller open to a 11% concession, seller financing, or rate buy-down credit?
- Built in 1927 — when were the roof, HVAC, electrical panel, plumbing, and water heater last replaced?
- Why hasn't it sold? Are there any deal-killer items the seller is aware of (foundation, flood, title, zoning, code violations)?
- Is there a deadline driving the sale (1031 exchange, divorce, estate, relocation)? That informs how much negotiation room exists.
- Schools are A-rated — typically a magnet for longer-tenancy family renters. What's the average tenant stay here, and is there a school-zone premium baked into asking?
- The area grade is low — what's the realistic commute time and amenity access for the typical tenant pool here? Any planned neighborhood developments (good or bad) we should know about?
- What's the average days-on-market for RENTAL listings here right now (not sales)? A rising rental-DOM trend means longer vacancies and softer asking-rent achievability than the comps imply.
- What's the recent tenant-quality profile in this submarket — average credit score on applications, eviction rate, late-payment / NSF rate, and stable-employment percentage? A property-management company in the area should have these aggregated.
- How much new for-sale + rental construction is in the pipeline within 1–3 miles? Heavy new supply typically softens prices + rents 12–24 months out; constrained supply supports both.
Investment metrics
- 1% rule
- 0.89% ✗
- Cap rate
- 5.73%
- Cash-on-cash
- -2.02%
- DSCR
- 0.91
- GRM
- 9.3
CMA / ARV
- ARV (on-the-fly)
- $194,709
- Comps found
- 12
Show comp detail 12 sales within ~0.75 mi
| Address | Dist | Beds/Ba | Sqft | Sold | Price | $/sf | Match |
|---|---|---|---|---|---|---|---|
| 4014 Rosemond Rd | 0.36mi | 4/1.5 (+1) | 1,609 (+2%) | 0mo | $131,500 | $82 | 73 |
| 3837 Woodridge Rd | 0.25mi | 3/1.5 | 1,440 (-9%) | 1mo | $166,470 | $116 | 71 |
| 3821 Montevista Rd | 0.00mi | 3/2.0 | 1,820 (+15%) | 1mo | $210,000 | $115 | 70 |
| 1168 Brentwood Rd | 0.38mi | 4/2.5 (+1) | 1,559 (-2%) | 1mo | $264,400 | $170 | 68 |
| 1143 Brentwood Rd | 0.38mi | 3/1.5 | 1,741 (+10%) | 0mo | $215,000 | $123 | 63 |
| 3454 Monticello Blvd | 0.69mi | 3/2.5 | 1,572 (-1%) | 1mo | $210,000 | $134 | 60 |
| 1521 Parkhill Rd | 0.48mi | 3/1.5 | 1,742 (+10%) | 0mo | $250,000 | $144 | 59 |
| 952 Oxford Rd | 0.62mi | 4/2.0 (+1) | 1,560 (-2%) | 2mo | $180,000 | $115 | 58 |
| 979 Oxford Rd | 0.56mi | 4/2.0 (+1) | 1,640 (+4%) | 1mo | $178,000 | $109 | 58 |
| 1031 Pennfield Rd | 0.52mi | 4/1.5 (+1) | 1,727 (+9%) | 1mo | $212,000 | $123 | 52 |
| 1166 Argonne Rd | 0.67mi | 4/1.5 (+1) | 1,700 (+7%) | 1mo | $265,000 | $156 | 49 |
| 1073 Woodview Rd | 0.72mi | 3/1.0 | 1,408 (-11%) | 1mo | $175,000 | $124 | 47 |
Match score weights: distance 35% · size 25% · config 20% · recency 20%. Top-matched comps best support the ARV.
Projected returns pro-forma
-3.0% appreciation · 6.85% rent growth · sell at horizon
- IRR
- -15.0%
- Equity multiple
- 0.44×
- Total profit
- $-32,705
- Equity at exit
- $31,312
- IRR
- -0.6%
- Equity multiple
- 0.95×
- Total profit
- $-2,709
- Equity at exit
- $18,157
Cash invested: $58,800 (down + closing). Projections, not guarantees.
Landlord ↔ Tenant lean methodology
- Overall (STATE)
- 73 Landlord-Friendly
- State Ohio
- 73 Landlord-Friendly · R+6
- County
- — inherits STATE
- City
- — inherits STATE
ZIP-level market 44121
- Rents YoY
- 6.8%
- Active inventory
- 150
- Price-to-rent
- 9.3×
Monthly cashflow live
- Estimated rent
- $1,873 high interval (Pro) →
- Mortgage (P&I)
- −$1,101
- Tax from tax record
- −$390 /mo · $4,678/yr
- Insurance
- −$88
- HOA
- −$0
- Vacancy / Maint / Mgmt
- −$393
- Net cashflow
- $-99
Break-even live
Sensitivity live
| Price | -10% $20 | -5% $-40 | +0% $-99 | +5% $-159 | +10% $-218 |
|---|---|---|---|---|---|
| Rent | -10% $-247 | -5% $-173 | +0% $-99 | +5% $-25 | +10% $49 |
| Rate | -1.0pp $7 | -0.5pp $-46 | base $-99 | +0.5pp $-154 | +1.0pp $-209 |
UW: 25.0% down · 7.5% · 30yr · 1.5% tax · 5.0% vac · 8.0% maint · 8.0% mgmt
Financing live
Cash to close
- Down payment
- $52,500
- Closing costs
- $6,300
- Reserves months
- —
- Total cash needed
- —
Loan-product check · same deal, 3 products live
Conventional
25% down · 7.5% · 30yr
- Down + closing
- —
- Monthly P&I
- —
- Monthly cashflow
- —
- DSCR
- —
- Eligible?
- —
Personal DTI + credit; lowest rate.
DSCR
20% down · 8.5% · 30yr
- Down + closing
- —
- Monthly P&I
- —
- Monthly cashflow
- —
- DSCR
- —
- Eligible?
- —
No personal income docs; deal must DSCR.
Hard money
10% down · 12.0% · 12mo
- Down + closing
- —
- Monthly P&I
- —
- Monthly cashflow
- —
- DSCR
- —
- Eligible?
- —
Short-term bridge; refi at stabilization.
Rent comps 40 comps
| Address | Beds | Baths | Sqft | Rent | $/sqft | DOM | Units | Dist |
|---|---|---|---|---|---|---|---|---|
| 3808 Kirkwood Rd Cleveland, OH | 4.0 | 1.5 | 1740 | $2,150 | $1.24 | 16d | 1 | 0.07mi |
| 3810 Parkdale Rd Cleveland, OH | 3.0 | 1.5 | 1281 | $2,067 | $1.61 | 3d | 1 | 0.07mi |
| 2868 Noble Rd Unit 16 Cleveland Heights, OH | 3.0 | 1.5 | 1200 | $1,750 | $1.46 | 3d | 1 | 0.20mi |
| 2868 Noble Rd Cleveland, OH | 3.0 | 1.5 | 1200 | $1,250 | $1.04 | 25d | 1 | 0.21mi |
| 3917 Bluestone Rd Cleveland, OH | 4.0 | 1.5 | 1700 | $1,650 | $0.97 | 22d | 1 | 0.31mi |
| 1462 Parkhill Rd Cleveland, OH | 4.0 | 1.0 | 1451 | $1,950 | $1.34 | 3d | 1 | 0.34mi |
| 1497 S Noble Rd Cleveland, OH | 4.0 | 1.0 | 1250 | $2,650 | $2.12 | 3d | 1 | 0.45mi |
| 1478 Sherbrook Rd Cleveland, OH | 3.0 | 1.0 | 1170 | $1,195 | $1.02 | 45d | 1 | 0.58mi |
| 1584 Maple Rd Cleveland, OH | 3.0 | 2.0 | 1359 | $1,700 | $1.25 | 25d | 1 | 0.58mi |
| 1462 Felton Rd Cleveland, OH | 3.0 | 1.0 | 1222 | $1,500 | $1.23 | 17d | 1 | 0.67mi |
| 994 Yellowstone Rd Cleveland, OH | 3.0 | 2.0 | 1475 | $1,395 | $0.95 | 3d | 1 | 0.69mi |
| 1099 Woodview Rd Cleveland, OH | 4.0 | 1.0 | 1500 | $2,500 | $1.67 | 3d | 1 | 0.70mi |
| 1420 Villa Dr Cleveland, OH | 3.0 | 2.0 | 1600 | $1,550 | $0.97 | 45d | 1 | 0.70mi |
| 1035 Elbon Rd Cleveland, OH | 4.0 | 1.5 | 1304 | $1,675 | $1.28 | 17d | 1 | 0.71mi |
| 1405 Villa Dr Cleveland, OH | 4.0 | 1.5 | 1480 | $1,790 | $1.21 | 17d | 1 | 0.72mi |
| 2401 N Taylor Rd Cleveland, OH | 3.0 | 1.0 | 1347 | $1,325 | $0.98 | 9d | 1 | 0.74mi |
| 1007 Elbon Rd Cleveland, OH | 3.0 | 1.0 | 1386 | $1,400 | $1.01 | 12d | 1 | 0.75mi |
| 35 Severance Cir Cleveland Heights, OH | 1.0–2.0 | 1.0–2.0 | 832 | $1,570 | $1.89 | 3d | 26 | 0.76mi |
| 3406 Henderson Rd Cleveland, OH | 4.0 | 1.5 | 1343 | $2,250 | $1.68 | 17d | 1 | 0.80mi |
| 1599 Felton Rd Cleveland, OH | 3.0 | 1.5 | 1248 | $1,650 | $1.32 | 45d | 1 | 0.86mi |
| 3430 Winsford Rd Cleveland, OH | 4.0 | 1.5 | 1800 | $1,590 | $0.88 | 17d | 1 | 0.90mi |
| 967 Selwyn Rd Cleveland, OH | 3.0 | 1.5 | 1214 | $1,595 | $1.31 | 17d | 1 | 0.91mi |
| 963 Selwyn Rd Cleveland, OH | 4.0 | 1.0 | 1300 | $2,650 | $2.04 | 3d | 1 | 0.91mi |
| 4093 Bexley Blvd Cleveland, OH | 3.0 | 1.5 | 1890 | $1,650 | $0.87 | 9d | 1 | 0.93mi |
| 3337 Sylvanhurst Rd Cleveland, OH | 3.0 | 1.0 | 1334 | $1,800 | $1.35 | 9d | 1 | 0.94mi |
| 953 Whitby Rd Cleveland, OH | 3.0 | 2.0 | 1188 | $1,575 | $1.33 | 25d | 1 | 0.96mi |
| 983 Greyton Rd Cleveland, OH | 3.0 | 2.0 | 1457 | $1,495 | $1.03 | 17d | 1 | 0.98mi |
| 3830 Berkeley Rd Cleveland, OH | 3.0 | 1.5 | 1318 | $1,800 | $1.37 | 25d | 1 | 1.05mi |
| 963 Chelston Rd Cleveland, OH | 4.0 | 2.0 | 1974 | $1,950 | $0.99 | 45d | 1 | 1.08mi |
| 915 Nela View Rd Cleveland, OH | 4.0 | 1.0 | 1300 | $2,600 | $2.00 | 17d | 1 | 1.09mi |
| 3699 Bainbridge Rd Cleveland, OH | 3.0 | 1.5 | 1866 | $1,900 | $1.02 | 17d | 1 | 1.10mi |
| 3722 Bainbridge Rd Cleveland, OH | 3.0 | 1.5 | 1326 | $4,500 | $3.39 | 25d | 1 | 1.12mi |
| 4166 Ellison Rd Cleveland, OH | 3.0 | 2.0 | 1131 | $1,695 | $1.50 | 4d | 1 | 1.12mi |
| 4165 Harwood Rd Cleveland, OH | 4.0 | 2.0 | 1608 | $1,950 | $1.21 | 45d | 1 | 1.14mi |
| 821 Nela View Rd Cleveland, OH | 4.0 | 2.5 | 2178 | $2,100 | $0.96 | 9d | 1 | 1.14mi |
| 3411 Beechwood Ave Unit 2nd floor Cleveland Heights, OH | 3.0 | 1.0 | 1452 | $1,687 | $1.16 | 5d | 1 | 1.14mi |
| 4409 Adrian Rd Cleveland, OH | 4.0 | 2.5 | 1542 | $1,855 | $1.20 | 3d | 1 | 1.19mi |
| 3407 Altamont Rd Unit 2nd Floor Cleveland, OH | 3.0 | 1.0 | 1212 | $1,095 | $0.90 | 25d | 1 | 1.20mi |
| 1344 S Green Rd Cleveland, OH | 3.0 | 1.0 | 1076 | $1,150 | $1.07 | 17d | 1 | 1.20mi |
| 876 Eloise Dr Unit Upper Cleveland Heights, OH | 2.0 | 1.0 | 1233 | $1,200 | $0.97 | 17d | 1 | 1.29mi |
Listing history 50 events
-
2026-04-20historical Contingent
-
2026-03-18$210,000 Active
-
2026-01-08historical
-
2025-12-01price $215,000
-
2025-09-26price $216,000
-
2025-09-03price $217,500
-
2025-08-12$219,500 Active
-
2025-07-22historical
-
2025-07-01price $219,500
-
2025-06-12$224,500 Active
-
2024-09-20soldstatus $100,000 Closed
-
2024-09-20soldstatus $100,000
-
2024-08-27status Pending
-
2024-07-23price $105,000
-
2024-07-09price $110,000
-
2024-06-18price $115,000
-
2024-05-16price $120,000
-
2024-04-19price $130,000
-
2024-03-13price $140,000
-
2024-02-23$150,000 Active
-
2020-11-04price $105,000
-
2020-08-25price $105,000
-
2020-05-02price $105,000
-
2015-05-15price $115,000
-
2014-04-28soldstatus $82,000
-
2014-04-18soldstatus $82,000
-
2014-04-17historical
-
2014-02-17$89,900
-
2014-02-12price $105,000
-
2014-02-12price $105,000
-
2013-12-31historical
-
2012-10-18$89,900
-
2001-05-14soldstatus $115,000 Sold
-
2001-05-14soldstatus $115,000 Closed
-
2001-05-14soldstatus $115,000 Closed
-
2001-05-14soldstatus $115,000 Sold
-
2001-05-14soldstatus $115,000 Closed
-
2001-05-14soldstatus $115,000 Closed
-
2001-05-14soldstatus $115,000
-
1998-10-13price $115,000
-
1998-10-13price $115,000
-
1998-10-13price $115,000
-
1998-10-13price $115,000
-
1998-10-13price $115,000
-
1998-10-13historical
-
1998-04-13$105,000
-
1991-04-19soldstatus $77,500
-
1991-04-19soldstatus $77,500
-
1991-02-10historical
-
1990-11-12$79,500
ⓘ Source: listings_history table (triggers on properties + properties_extension) + one-shot
backfill from property_details.listing_events for pre-trigger history.
Tax reassessment forecast OH · Partial reset (capped growth)
- Current annual tax
- $4,678 · $390/mo
- Projected year-2 tax
- $4,678 · $390/mo
- Expected delta
- $0/yr ($0/mo · 0.0%)
ⓘ Screening estimate from a state-policy table — verify with the county assessor before closing.
Climate risk First Street
- Flood 1/10 Low FEMA zone X (unshaded) · 0% chance over 30 yrs
- Wildfire 1/10 Low
- Heat 2/10 Low 7 d/yr ≥95°F today · 16 d/yr by 30 yrs out
- Wind 1/10 Low
- Air quality 3/10 Moderate 2 unhealthy d/yr today · 5 by 30 yrs out
Nearby sold comps map
Loading sold comps map…
Walkable amenities ~0.75 mi
Loading nearby amenities…
Taxation est. · year 1
- Rental income
- $22,472
- − Mortgage interest
- −$11,763
- − Property taxes
- −$4,678
- − Insurance
- −$1,050
- − Repairs & maintenance
- −$1,798
- − Management
- −$1,798
- − Depreciation
- −$6,109
- Taxable loss
- −$4,724
- Est. tax savings @ 24.0%
- +$1,134
- After-tax cash flow
- $-57/yr
For passive investors: Depreciation is non-cash, so a rental often shows a tax loss while cash-flowing — sheltering income. Rental losses are passive: they offset passive income freely, and up to $25,000/yr can offset ordinary (W-2) income if you actively participate and your MAGI is under $100k (phasing out to $0 by $150k); unused losses carry forward. On sale, claimed depreciation is recaptured at up to 25%, and gains may owe capital-gains tax (a 1031 exchange can defer both). Figures are a year-1 estimate at your 24.0% rate — not tax advice; consult a CPA.
Schools (NCES district)
- District
- Cleveland Heights-University Heights City
- NCES district ID
- 3904379
- Math proficiency
- 23% ▼ -22.00%
- Reading proficiency
- 41% ▼ -12.00%
- Median HH income
- $53,451
- Composite
- 28.12/100
- National rank
- #6822
- State rank
- #568 of 656 in OH
Livability — Cleveland Heights
- Score
- 89/100
- State rank
- #12
- US rank
- #124
Category grades
Schools grade is shown separately in the Schools card above.
Census & demographics
- Census place
- Cleveland Heights, OH
- County
- Cuyahoga County · 1,090,369 people
- City population
- 32,312
- Metro
- Cleveland-Elyria, OH
- Population (ZIP)
- 32,312
- Household income
- $76,767
- Rent vs Own
- Severe rent burden
- 672.0
Population outlook (Cuyahoga County) Hauer SSP2
- Today (2025)
- 1,244,621 people
- By 2030
- 1,230,093 · -1.2%
- By 2040
- 1,189,108 · -4.5%
- By 2050
- 1,145,706 · -7.9%
- By 2075
- 1,076,557 · -13.5%
- By 2100
- 978,987 · -21.3%
Race, ethnicity, and origin ACS 2023
- Neighborhood character
- Diverse neighborhood (Simpson 0.56)
- Race & ethnicity
- Black 55% White 36% Two or more races 4% Hispanic / Latino 3% Asian 2%
- Common ancestry
- Romanian 3% Italian 2% Scotch-Irish 2%
- Foreign-born
- 5% · Canada, China, India
- Languages at home
- 92% English-only · Spanish 2% Chinese 1% Other Indo-European 1%
Political lean MEDSL · Cuyahoga
- 2024 margin
- Solid D (+31.5) · D 65.4% · R 33.9%
- 2008→2024 swing
- -7.4pp toward R · 2008: 38.9pp · 2024: 31.5pp
- All cycles
- 2024: D+31.5 2020: D+34.1 2016: D+35.0 2012: D+38.7 2008: D+38.9
Not yet ingested
- Civics
- —
Market trends
- HPI YoY
- ▼ -180.15%
- Current HPI
- 173.7405
- Rent YoY
- ▲ 6.85%
- Metro
- Cleveland-Elyria, OH
- State GDP YoY
- ▲ 1.98%
- F500 in state
- 48
Industry mix (Fortune 500 HQ in OH)
| Industry | F500 HQs | Revenue |
|---|---|---|
| Insurance | 3 | $145B |
|
||
| Industrial Machinery | 3 | $49B |
|
||
| Financial Services | 3 | $24B |
|
||
| Consumer Goods | 2 | $93B |
|
||
| Aerospace / Defense | 2 | $47B |
|
||
| Utilities | 2 | $33B |
|
||
Price history
+351.6% since first listed51 events — show timeline
- 2026-04-20 Contingent — MLSNOW
- 2026-03-18 Listed $210,000 MLSNOW
- 2026-01-08 Listing Removed — MLSNOW
- 2025-12-01 Price Changed $215,000 MLSNOW
- 2025-09-26 Price Changed $216,000 MLSNOW
- 2025-09-03 Price Changed $217,500 MLSNOW
- 2025-08-12 Listed $219,500 MLSNOW
- 2025-07-22 Listing Removed — MLSNOW
- 2025-07-01 Price Changed $219,500 MLSNOW
- 2025-06-12 Listed $224,500 MLSNOW
- 2024-09-20 Sold (Public Records) $100,000 Public Records
- 2024-09-20 Sold (MLS) $100,000 MLSNOW
- 2024-08-27 Pending — MLSNOW
- 2024-07-23 Price Changed $105,000 MLSNOW
- 2024-07-09 Price Changed $110,000 MLSNOW
- 2024-06-18 Price Changed $115,000 MLSNOW
- 2024-05-16 Price Changed $120,000 MLSNOW
- 2024-04-19 Price Changed $130,000 MLSNOW
- 2024-03-13 Price Changed $140,000 MLSNOW
- 2024-02-23 Listed $150,000 MLSNOW
- 2020-11-04 Price Changed $105,000 MLSNOW
- 2020-08-25 Price Changed $105,000 MLSNOW
- 2020-05-02 Price Changed $105,000 MLSNOW
- 2015-05-15 Price Changed $115,000 MLSNOW
- 2014-04-28 Sold (Public Records) $82,000 Public Records
- 2014-04-18 Sold (MLS) $82,000 MLSNOW
- 2014-04-17 Listing Removed — MLSNOW
- 2014-02-17 Listed $89,900 MLSNOW
- 2014-02-12 Price Changed $105,000 MLSNOW
- 2014-02-12 Price Changed $105,000 MLSNOW
- 2013-12-31 Listing Removed — MLSNOW
- 2012-10-18 Listed $89,900 MLSNOW
- 2001-05-14 Sold (Public Records) $115,000 Public Records
- 2001-05-14 Sold (MLS) $115,000 MLSNOW
- 2001-05-14 Sold (MLS) $115,000 MLSNOW
- 2001-05-14 Sold (MLS) $115,000 MLSNOW
- 2001-05-14 Sold (MLS) $115,000 MLSNOW
- 2001-05-14 Sold (MLS) $115,000 MLSNOW
- 2001-05-14 Sold (MLS) $115,000 MLSNOW
- 1998-10-13 Listing Removed — MLSNOW
- 1998-10-13 Price Changed $115,000 MLSNOW
- 1998-10-13 Price Changed $115,000 MLSNOW
- 1998-10-13 Price Changed $115,000 MLSNOW
- 1998-10-13 Price Changed $115,000 MLSNOW
- 1998-10-13 Price Changed $115,000 MLSNOW
- 1998-04-13 Listed $105,000 MLSNOW
- 1991-04-19 Sold (Public Records) $77,500 Public Records
- 1991-04-19 Sold (MLS) $77,500 MLSNOW
- 1991-02-10 Listing Removed — MLSNOW
- 1990-11-12 Listed $79,500 MLSNOW
- 1989-04-17 Sold (Public Records) $46,500 Public Records
Property tax history
+1.3%/yrLatest (2025): $4,678 · -11.2% YoY. Source: county tax records.
Cash-flow waterfall
monthlySold comps — $/sqft
last 12 mo · ≤1 miLoading sold comps…