451 1/2 Ella St · Wilkinsburg, PA
Flood risk 1/10 · Minimal
- FEMA flood zone
- X (unshaded)
- Chance of flooding over 30 yrs
- 0.0%
- Est. flood insurance / yr
- $473 – $860
Fire risk 1/10 · Minimal
- Est. fire insurance / yr
- $511 – $949
Heat risk 3/10 · Minor
- Hot days now (above 98°F)
- 7 days/yr
- Hot days in 30 yrs
- 17 days/yr
Wind risk 2/10 · Minimal
- Chance of severe wind over 30 yrs
- —
Air-quality risk 4/10 · Minor
- Unhealthy air days now
- 4 days/yr
- Unhealthy air days in 30 yrs
- 5 days/yr
Risk factors via First Street. Map © Google.
Why this score? — see what drove the B- grade
The composite is a weighted blend of 9 inputs, each scored 0–100. Each bar is that input's sub-score; the figure is the points it added to the 100-point composite (weight × sub-score).
- Cash flow +30.0/30.0
- 1% rule +10.0/10.0
- DSCR +10.0/10.0
- ARV discount +7.5/15.0
- Livability +3.8/5.0
- Rent growth +3.5/5.0
- Condition / age +2.5/5.0
- Schools +1.5/10.0
- Appreciation +0.0/10.0
$99,000
🖨 Deal sheet 📄 Offer letter ✓ Due diligence
Listing remarks
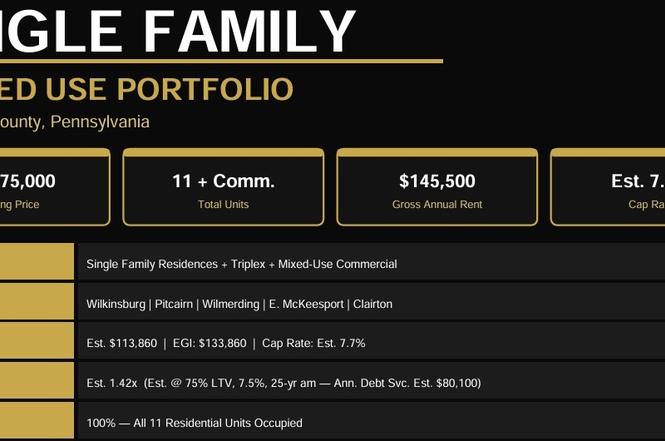
SFH for sale - This property is apart of a portfolio package sell. The portfolio presents the opportunity to acquire 11 residential income-producing units plus a vacant 4,900 SF mixed-use commercial building across five Allegheny County communities — Wilkinsburg, Pitcairn, Wilmerding, East McKeesport, and Clairton — in a single transaction. The portfolio generates $145,500 in gross annual rental income with 100% residential occupancy.
Key facts
- 1,873 sq ft lot
- Built 1900
- Listed 8 days
Property features AI
Exterior
- Parking: On-street parking
- Utilities: Sewer available; Water available
- Home design: Resale property; Brick construction
- Construction: Brick exterior
- Exterior features: Sewer available; Water available
Interior
- Bathrooms: 1 full bathroom
- Heating & cooling: Gas heating
- Interior features: Basement present
Neighborhood map
What this means for you Summary
Snapshot
- This is a 3-bed/1.0-bath single-family listed at $99k.
Deal economics
- At list price, monthly cash flow is $710 ($9k/yr) — positive.
- The deal already cash-flows at list — no discount required.
- Meets the 1% rule at list price ($2k rent vs $99k).
- Cap rate 14.9% vs local median 11.3% in Wilkinsburg — top-decile yield for the area; either an underpriced asset or a hidden risk that comps aren't pricing in. Stress-test before assuming the spread holds.
Location & tenants
- Location reads 76/100 on livability (#411 in PA, #3,754 nationally) — a middle-class / working-renter tenant base. Strengths: commute A+, cost of living A+, housing A+; Watch: schools D+, health & safety D+, crime F.
- Wilkinsburg Borough SD (suburban): math 14% / reading 23% proficiency, ranked #503 of 539 in PA (top 93%) — low school quality limits family demand, transient renter base, plan for 1-2y turnover; 96% free/reduced lunch — lower-income household profile, screen leases tightly.
- Market conditions: Rents rising (+3.9%/yr); 118 active listings in the ZIP; 26 comparable units currently listed for rent nearby; rentals at typical pace (median 24d on market — plan ~3-4 weeks tenant-placement turnaround); 2,996 units permitted in Allegheny County in 2024 (1,588 in 5+ unit buildings).
- This rent runs 36% of the median local income ($55k/yr) — at the standard rent-burdened threshold; future hikes will face affordability resistance.
Forward outlook
- Local home prices are declining (-3.0%/yr); year-one equity from $684 of loan paydown is wiped out by about $3k of value loss. Plan a longer hold.
- At projected returns (-3.0% appreciation + 3.9% rent growth), your $28k cash investment doubles in ~4 years — after that, you're playing with house money.
Negotiation context
- Only 8 days on market — expect competitive offers; lowballing is unlikely to land.
- 2 sale attempts since 12y ago; this cycle's ask has dropped $891k (90%) from the opening price — seller is motivated, your offer sets the floor, not the list.
- Current owner paid $26k; list at $99k implies a 274% gain — meaningful room to come down on a strong offer.
Risks & watch-outs
- Watch-outs: built in 1900 — expect roof / HVAC / electrical / plumbing capex.
Questions for the listing agent
- Built in 1900 — when were the roof, HVAC, electrical panel, plumbing, and water heater last replaced?
- Is there a deadline driving the sale (1031 exchange, divorce, estate, relocation)? That informs how much negotiation room exists.
- Schools are D-rated, which usually means shorter tenancies and higher turnover. Who's the typical renter profile here, and what's been the actual vacancy rate?
- Crime grade is F in this area — have there been break-ins, vandalism, or insurance claims at this property in the last 3 years? What carrier currently insures it and at what premium?
- What's the average days-on-market for RENTAL listings here right now (not sales)? A rising rental-DOM trend means longer vacancies and softer asking-rent achievability than the comps imply.
- What's the recent tenant-quality profile in this submarket — average credit score on applications, eviction rate, late-payment / NSF rate, and stable-employment percentage? A property-management company in the area should have these aggregated.
- How much new for-sale + rental construction is in the pipeline within 1–3 miles? Heavy new supply typically softens prices + rents 12–24 months out; constrained supply supports both.
Investment metrics
- 1% rule
- 1.66% ✓
- Cap rate
- 14.90%
- Cash-on-cash
- 30.75%
- DSCR
- 2.37
- GRM
- 5.0
CMA / ARV
- ARV (on-the-fly)
- $233,558
- Comps found
- 12
Show comp detail 12 sales within ~0.75 mi
| Address | Dist | Beds/Ba | Sqft | Sold | Price | $/sf | Match |
|---|---|---|---|---|---|---|---|
| 1133 Sperling Dr | 0.19mi | 4/1.5 (+1) | 1,350 (-2%) | 0mo | $151,000 | $112 | 80 |
| 449 Morris St | 0.12mi | 2/1.0 (-1) | 1,276 (-8%) | 8mo | $120,000 | $94 | 70 |
| 229 Dewey St | 0.35mi | 3/1.5 | 1,272 (-8%) | 1mo | $215,000 | $169 | 68 |
| 1216 Morrow St | 0.21mi | 3/1.0 | 1,176 (-15%) | 3mo | $45,000 | $38 | 63 |
| 425 Edgewood Rd | 0.71mi | 3/1.0 | 1,346 (-3%) | 0mo | $306,600 | $228 | 62 |
| 605 Whitney Ave | 0.47mi | 4/1.5 (+1) | 1,476 (+7%) | 3mo | $315,000 | $213 | 57 |
| 420 W Hutchinson Ave | 0.75mi | 3/1.0 | 1,322 (-4%) | 1mo | $320,000 | $242 | 57 |
| 520 Princeton Blvd | 0.57mi | 3/1.0 | 1,268 (-8%) | 6mo | $28,000 | $22 | 54 |
| 152 Oakview | 0.50mi | 3/2.5 | 1,280 (-7%) | 6mo | $275,000 | $215 | 53 |
| 1019 Maple St | 0.70mi | 3/1.5 | 1,268 (-8%) | 1mo | $23,000 | $18 | 51 |
| 111 Race St | 0.40mi | 4/2.0 (+1) | 1,566 (+13%) | 8mo | $335,000 | $214 | 43 |
| 8101 Saint Lawrence Ave | 0.66mi | 2/1.0 (-1) | 1,226 (-11%) | 4mo | $200,000 | $163 | 42 |
Match score weights: distance 35% · size 25% · config 20% · recency 20%. Top-matched comps best support the ARV.
Projected returns pro-forma
-3.0% appreciation · 3.86% rent growth · sell at horizon
- IRR
- 26.4%
- Equity multiple
- 2.10×
- Total profit
- $30,589
- Equity at exit
- $14,761
- IRR
- 34.5%
- Equity multiple
- 4.27×
- Total profit
- $90,722
- Equity at exit
- $8,560
Cash invested: $27,720 (down + closing). Projections, not guarantees.
Landlord ↔ Tenant lean methodology
- Overall (STATE)
- 62 Landlord-Friendly
- State Pennsylvania
- 62 Landlord-Friendly · EVEN
- County
- — inherits STATE
- City
- — inherits STATE
ZIP-level market 15221
- Home prices YoY
- -32.3%
- Rents YoY
- 3.9%
- Active inventory
- 118
- Price-to-rent
- 5.0×
Monthly cashflow live
- Estimated rent
- $1,641 high interval (Pro) →
- Mortgage (P&I)
- −$519
- Tax from tax record
- −$26 /mo · $312/yr
- Insurance
- −$41
- HOA
- −$0
- Vacancy / Maint / Mgmt
- −$345
- Net cashflow
- $710
Break-even live
UW: 25.0% down · 7.5% · 30yr · 1.5% tax · 5.0% vac · 8.0% maint · 8.0% mgmt
Financing live
Cash to close
- Down payment
- $24,750
- Closing costs
- $2,970
- Reserves months
- —
- Total cash needed
- —
Loan-product check · same deal, 3 products live
Conventional
25% down · 7.5% · 30yr
- Down + closing
- —
- Monthly P&I
- —
- Monthly cashflow
- —
- DSCR
- —
- Eligible?
- —
Personal DTI + credit; lowest rate.
DSCR
20% down · 8.5% · 30yr
- Down + closing
- —
- Monthly P&I
- —
- Monthly cashflow
- —
- DSCR
- —
- Eligible?
- —
No personal income docs; deal must DSCR.
Hard money
10% down · 12.0% · 12mo
- Down + closing
- —
- Monthly P&I
- —
- Monthly cashflow
- —
- DSCR
- —
- Eligible?
- —
Short-term bridge; refi at stabilization.
Rent comps 26 comps
| Address | Beds | Baths | Sqft | Rent | $/sqft | DOM | Units | Dist |
|---|---|---|---|---|---|---|---|---|
| 826 Walnut St Pittsburgh, PA | 2.0 | 1.0 | 1270 | $1,195 | $0.94 | 43d | 1 | 0.21mi |
| 565 Ardmore Blvd Pittsburgh, PA | 4.0 | 1.0 | 1368 | $1,450 | $1.06 | 10d | 1 | 0.31mi |
| 442 Locust St Pittsburgh, PA | 2.0 | 1.0 | 1600 | $2,600 | $1.62 | 2d | 1 | 0.35mi |
| 1148 East St Pittsburgh, PA | 3.0 | 3.0 | 1738 | $1,700 | $0.98 | 43d | 1 | 0.47mi |
| 600 Kelly Ave Pittsburgh, PA | 1.0–2.0 | 1.0 | 968 | $1,350 | $1.39 | 3d | 3 | 0.53mi |
| 407 Biddle Ave #3 Pittsburgh, PA | 3.0 | 1.0 | 1200 | $1,700 | $1.42 | 43d | 1 | 0.69mi |
| 1515 Penn Ave Wilkinsburg, PA | 2.0 | 2.0 | 1012 | $1,100 | $1.09 | 43d | 1 | 0.71mi |
| 100 Bryn Mawr Ct W Pittsburgh, PA | 1.0–2.0 | 1.0–2.0 | 975 | $1,904 | $1.95 | 2d | 15 | 0.72mi |
| 519-521 S Trenton Ave Pittsburgh, PA | 3.0 | 1.5 | 1360 | $2,600 | $1.91 | 16d | 1 | 0.76mi |
| 2210 Hampton St Pittsburgh, PA | 3.0 | 1.5 | 1512 | $1,650 | $1.09 | 23d | 1 | 0.79mi |
| 515 Hill Ave Pittsburgh, PA | 4.0 | 1.0 | 1628 | $1,300 | $0.80 | 43d | 1 | 0.81mi |
| 1003 Smokey Wood Dr Swissvale, PA | 1.0–2.0 | 1.0 | 874 | $1,475 | $1.69 | 4d | 4 | 0.81mi |
| 1713-1715 Clark St Unit 79-1804C Pittsburgh, PA | 2.0 | 1.0 | 972 | $1,200 | $1.23 | 4d | 1 | 0.90mi |
| 7215 Beacon Hill Dr Pittsburgh, PA | 2.0 | 2.0 | 1259 | $1,795 | $1.43 | 4d | 1 | 0.92mi |
| 2323 Patterson Ave Pittsburgh, PA | 3.0 | 1.0 | 1440 | $1,800 | $1.25 | 43d | 1 | 0.96mi |
| 2323 Patterson Ave Unit NA Pittsburgh, PA | 3.0 | 1.0 | 1440 | $1,500 | $1.04 | 23d | 1 | 0.96mi |
| 7534 Penn Bridge Ct Pittsburgh, PA | 2.0 | 2.0 | 1259 | $1,750 | $1.39 | 43d | 1 | 0.99mi |
| 2255 Hawthorne Ave Unit 2255 Swissvale, PA | 2.0 | 1.0 | 1020 | $1,000 | $0.98 | 12d | 1 | 1.02mi |
| 1027 Lancaster Ave Unit 2 Pittsburgh, PA | 2.0 | 2.0 | 1300 | $2,599 | $2.00 | 1d | 1 | 1.05mi |
| 2219 Manor Ave Pittsburgh, PA | 3.0 | 1.0 | 1638 | $1,600 | $0.98 | 23d | 1 | 1.05mi |
| 7645 Highland Ave Pittsburgh, PA | 3.0 | 1.0 | 1161 | $1,325 | $1.14 | 7d | 1 | 1.13mi |
| 1962 McNary Blvd Pittsburgh, PA | 3.0 | 1.0 | 1517 | $1,545 | $1.02 | 7d | 1 | 1.17mi |
| 7225 Whipple St Unit 72255 Pittsburgh, PA | 3.0 | 1.5 | 1440 | $1,695 | $1.18 | 2d | 1 | 1.19mi |
| 2031 Chalfant St Pittsburgh, PA | 3.0 | 1.5 | 1150 | $1,950 | $1.70 | 43d | 1 | 1.32mi |
| 7009 Church St Pittsburgh, PA | 3.0 | 2.0 | 1800 | $1,550 | $0.86 | 43d | 1 | 1.43mi |
| 2673 Woodstock Ave Pittsburgh, PA | 3.0 | 1.0 | 1000 | $1,190 | $1.19 | 23d | 1 | 1.48mi |
Listing history 6 events
-
2026-06-18days on market $99,000 Active 8 DOM
-
2026-06-17days on market $99,000 Active 7 DOM
-
2026-06-16days on market $99,000 Active 6 DOM
-
2026-06-15days on market $99,000 Active 5 DOM
-
2026-06-13remarks 438-char remark
-
2026-06-13$99,000 Active 3 DOM
ⓘ Source: listings_history table (triggers on properties + properties_extension) + one-shot
backfill from property_details.listing_events for pre-trigger history.
Tax reassessment forecast PA · Partial reset (capped growth)
- Current annual tax
- $312 · $26/mo
- Projected year-2 tax
- $938 · $78/mo
- Expected delta
- +$626/yr (+$52/mo · 200.4%)
ⓘ Screening estimate from a state-policy table — verify with the county assessor before closing.
Climate risk First Street
- Flood 1/10 Low FEMA zone X (unshaded) · 0% chance over 30 yrs
- Wildfire 1/10 Low
- Heat 3/10 Moderate 7 d/yr ≥98°F today · 17 d/yr by 30 yrs out
- Wind 2/10 Low
- Air quality 4/10 Moderate 4 unhealthy d/yr today · 5 by 30 yrs out
Nearby sold comps map
Loading sold comps map…
Walkable amenities ~0.75 mi
Loading nearby amenities…
Taxation est. · year 1
- Rental income
- $19,696
- − Mortgage interest
- −$5,546
- − Property taxes
- −$312
- − Insurance
- −$495
- − Repairs & maintenance
- −$1,576
- − Management
- −$1,576
- − Depreciation
- −$2,880
- Taxable income
- $7,312
- Est. tax owed @ 24.0%
- −$1,755
- After-tax cash flow
- $6,768/yr
For passive investors: Depreciation is non-cash, so a rental often shows a tax loss while cash-flowing — sheltering income. Rental losses are passive: they offset passive income freely, and up to $25,000/yr can offset ordinary (W-2) income if you actively participate and your MAGI is under $100k (phasing out to $0 by $150k); unused losses carry forward. On sale, claimed depreciation is recaptured at up to 25%, and gains may owe capital-gains tax (a 1031 exchange can defer both). Figures are a year-1 estimate at your 24.0% rate — not tax advice; consult a CPA.
Schools (NCES district)
- District
- Wilkinsburg Borough SD
- NCES district ID
- 4226370
- Math proficiency
- 14% ▼ -8.00%
- Reading proficiency
- 23% ▼ -9.00%
- Median HH income
- $32,204
- Composite
- 14.94/100
- National rank
- #9368
- State rank
- #503 of 539 in PA
Livability — Wilkinsburg
- Score
- 76/100
- State rank
- #411
- US rank
- #3754
Category grades
Schools grade is shown separately in the Schools card above.
Census & demographics
- Census place
- Wilkinsburg, PA
- County
- Allegheny County · 1,022,028 people
- City population
- 29,513
- Metro
- Pittsburgh, PA
- Population (ZIP)
- 29,374
- Household income
- $55,028
- Rent vs Own
- Severe rent burden
- 1933.0
Population outlook (Allegheny County) Hauer SSP2
- Today (2025)
- 1,250,282 people
- By 2030
- 1,256,482 · +0.5%
- By 2040
- 1,256,318 · +0.5%
- By 2050
- 1,244,169 · -0.5%
- By 2075
- 1,197,693 · -4.2%
- By 2100
- 1,093,187 · -12.6%
Race, ethnicity, and origin ACS 2023
- Neighborhood character
- Diverse neighborhood (Simpson 0.60)
- Race & ethnicity
- White 47% Black 43% Two or more races 7% Hispanic / Latino 4% Asian 1%
- Common ancestry
- Romanian 4% Lithuanian 2% Serbian 1%
- Foreign-born
- 4% · Canada, South Korea, China
- Languages at home
- 93% English-only · Spanish 2% French/Haitian/Cajun 1% Other Indo-European 1%
Political lean MEDSL · Allegheny
- 2024 margin
- Strong D (+20.3) · D 59.7% · R 39.4%
- 2008→2024 swing
- +4.8pp toward D · 2008: 15.5pp · 2024: 20.3pp
- All cycles
- 2024: D+20.3 2020: D+20.4 2016: D+16.4 2012: D+14.4 2008: D+15.5
Not yet ingested
- Civics
- —
Market trends
- HPI YoY
- ▼ -109.77%
- Current HPI
- 230.0486
- Rent YoY
- ▲ 3.86%
- Metro
- Pittsburgh, PA
- State GDP YoY
- ▲ 1.68%
- F500 in state
- 34
Industry mix (Fortune 500 HQ in PA)
| Industry | F500 HQs | Revenue |
|---|---|---|
| Healthcare | 2 | $309B |
|
||
| Insurance | 2 | $27B |
|
||
| Telecommunications / Media | 1 | $124B |
|
||
| Industrial Distribution | 1 | $22B |
|
||
| Financial Services | 1 | $20B |
|
||
| Chemicals / Materials | 1 | $18B |
|
||
Price history
+760.9% since first listed6 events — show timeline
- 2026-06-10 Price Changed $99,000 West Penn MLS
- 2026-06-10 Listed $990,000 West Penn MLS
- 2014-04-07 Listed $46,900 West Penn MLS
- 1994-07-18 Sold (Public Records) $26,500 Public Records
- 1994-07-18 Sold (Public Records) $26,500 Public Records
- 1978-01-01 Sold (Public Records) $11,500 Public Records
Property tax history
-11.9%/yrLatest (2026): $312 · +3.0% YoY. Source: county tax records.
Cash-flow waterfall
monthlySold comps — $/sqft
last 12 mo · ≤1 miLoading sold comps…