31543 Anchor Rd · Cienega Springs, AZ
Flood risk 1/10 · Minimal
- FEMA flood zone
- X (shaded)
- Chance of flooding over 30 yrs
- 0.0%
- Est. flood insurance / yr
- $507 – $1,088
Fire risk 3/10 · Minor
- Est. fire insurance / yr
- $610 – $1,132
Heat risk 9/10 · Severe
- Hot days now (above 115°F)
- 7 days/yr
- Hot days in 30 yrs
- 15 days/yr
Wind risk 1/10 · Minimal
- Chance of severe wind over 30 yrs
- —
Air-quality risk 1/10 · Minimal
- Unhealthy air days now
- 0 days/yr
- Unhealthy air days in 30 yrs
- 0 days/yr
Risk factors via First Street. Map © Google.
Why this score? — see what drove the D grade
The composite is a weighted blend of 9 inputs, each scored 0–100. Each bar is that input's sub-score; the figure is the points it added to the 100-point composite (weight × sub-score).
- Cash flow +16.6/30.0
- ARV discount +7.5/15.0
- DSCR +5.1/10.0
- 1% rule +3.3/10.0
- Livability +3.2/5.0
- Rent growth +2.5/5.0
- Condition / age +2.5/5.0
- Schools +1.5/10.0
- Appreciation +0.0/10.0
$189,000
🖨 Deal sheet (PDF) 📄 Offer letter ✓ Due diligence
Listing remarks
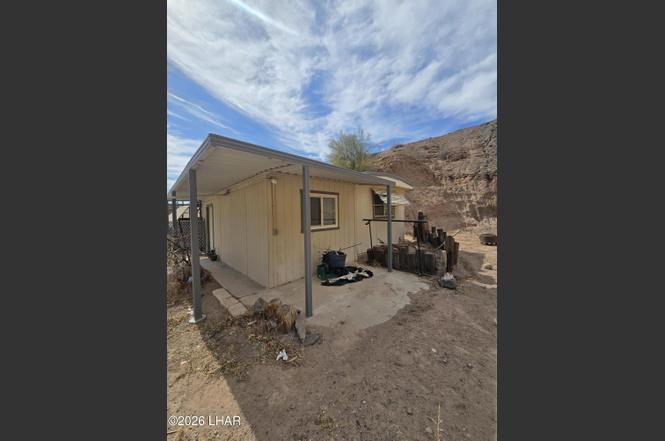
PARKER STRIP 2 bed 1 bath home -- and yes, you own the land! This well-maintained home features a desirable split floor plan, spacious living room plus a separate family room. The kitchen offers abundant cabinet storage and generous counter space, making it ideal for everyday living or entertaining. Outside, you'll find front parking with additional backyard access through the shared side easement, offering plenty of room for a future garage, toy barn, boat parking, or extra storage. Conveniently located near the boat launch, river access, and desert trails for year-round recreation. Whether you're looking for a full-time residence, vacation getaway, or investment property, this home offers
Key facts
- Backyard access
- Split floor plan
- Front parking
Tags
Property features AI
Finance
- Other: Zoning: P-TR Transitional Residential
Exterior
- Parking: No designated parking
- Utilities: Public water; Septic tank sewer; 200+ amp electrical service
- Home design: Manufactured home (residential); Irregular lot shape; Facing direction not specified
- Construction: Vertical siding; Rolled/hot mop roof; Mobile home dimensions approximately 12 ft wide by 47 ft long; Built year not specified
- Exterior features: Chain link and wood fencing; Located on a cul-de-sac
Interior
- Bathrooms: 1 full bathroom
- Heating & cooling: Central heating; Central air; Ceiling fans; Wall/window air conditioning units
- Interior features: Ceiling fans throughout
Neighborhood map
What this means for you Summary
Snapshot
- This is a 2-bed/1.0-bath manufactured listed at $189k.
Deal economics
- At list price, monthly cash flow is $114 ($1k/yr) — positive.
- The deal already cash-flows at list — no discount required.
- To meet the 1% rule (rent ≥ 1% of price), the offer needs to be $157k (16.9% below list).
- Recommended offer: $157k (16.9% below list) — sets the bar for 1% rule.
- Cap rate 7.0% vs local median 2.2% in Cienega Springs — top-decile yield for the area; either an underpriced asset or a hidden risk that comps aren't pricing in. Stress-test before assuming the spread holds.
Location & tenants
- Location reads 63/100 on livability (#107 in AZ) — a middle-class / working-renter tenant base. Strengths: crime A+, cost of living A+, housing A+; Watch: health & safety C-, schools F, amenities F.
- Parker Unified School District (4510) (town): math 18% / reading 18% proficiency, ranked #200 of 249 in AZ (top 80%) — low school quality limits family demand, transient renter base, plan for 1-2y turnover; 69% free/reduced lunch — lower-income household profile, screen leases tightly.
- Market conditions: 147 active listings in the ZIP; 92 units permitted in La Paz County in 2024 (0 in 5+ unit buildings).
Forward outlook
- Local home prices are declining (-3.0%/yr); year-one equity from $1k of loan paydown is wiped out by about $6k of value loss. Plan a longer hold.
- La Paz County population projected at -11% by 2050 — secular population decline; favor cash flow + early exit over multi-decade hold.
Negotiation context
- Only 2 days on market — expect competitive offers; lowballing is unlikely to land.
- 12 sale attempts since 6y ago with the ask held roughly flat each time — persistent listings suggest the price (not the market) is what's stuck; bring a comps-based counter.
- Current owner paid $59k; list at $189k implies a 220% gain — meaningful room to come down on a strong offer.
Risks & watch-outs
- Climate carrying-cost: extreme-heat days projected 7→15/yr by 2055 (HVAC capex compounding) — expect insurance premiums to compound above CPI over the hold.
Questions for the listing agent
- Is there a deadline driving the sale (1031 exchange, divorce, estate, relocation)? That informs how much negotiation room exists.
- Schools are F-rated, which usually means shorter tenancies and higher turnover. Who's the typical renter profile here, and what's been the actual vacancy rate?
- The area grade is low — what's the realistic commute time and amenity access for the typical tenant pool here? Any planned neighborhood developments (good or bad) we should know about?
- What's the average days-on-market for RENTAL listings here right now (not sales)? A rising rental-DOM trend means longer vacancies and softer asking-rent achievability than the comps imply.
- What's the recent tenant-quality profile in this submarket — average credit score on applications, eviction rate, late-payment / NSF rate, and stable-employment percentage? A property-management company in the area should have these aggregated.
- How much new for-sale + rental construction is in the pipeline within 1–3 miles? Heavy new supply typically softens prices + rents 12–24 months out; constrained supply supports both.
Investment metrics
- 1% rule
- 0.83% ✗
- Cap rate
- 7.02%
- Cash-on-cash
- 2.58%
- DSCR
- 1.11
- GRM
- 10.0
CMA / ARV
- ARV (on-the-fly)
- $65,100
- Comps found
- 1
Show comp detail 1 sale within ~0.75 mi
| Address | Dist | Beds/Ba | Sqft | Sold | Price | $/sf | Match |
|---|---|---|---|---|---|---|---|
| 31846 Carefree Dr | 0.35mi | 2/1.0 | 420 (0%) | 15mo | $65,000 | $155 | 72 |
Match score weights: distance 35% · size 25% · config 20% · recency 20%. Top-matched comps best support the ARV.
Projected returns pro-forma
-3.0% appreciation · 3.0% rent growth · sell at horizon
- IRR
- -12.3%
- Equity multiple
- 0.56×
- Total profit
- $-23,453
- Equity at exit
- $28,181
- IRR
- -3.2%
- Equity multiple
- 0.78×
- Total profit
- $-11,428
- Equity at exit
- $16,341
Cash invested: $52,920 (down + closing). Projections, not guarantees.
Landlord ↔ Tenant lean methodology
- Overall (STATE)
- 87 Strongly Landlord-Friendly
- State Arizona
- 87 Strongly Landlord-Friendly · R+3
- County
- — inherits STATE
- City
- — inherits STATE
ZIP-level market 85344
- Active inventory
- 147
- Price-to-rent
- 10.0×
Monthly cashflow live
- Estimated rent
- $1,570 medium interval (Pro) →
- Mortgage (P&I)
- −$991
- Tax from tax record
- −$57 /mo · $680/yr
- Insurance
- −$79
- HOA
- −$0
- Vacancy / Maint / Mgmt
- −$330
- Net cashflow
- $114
Break-even live
Sensitivity live
| Price | -10% $221 | -5% $167 | +0% $114 | +5% $60 | +10% $7 |
|---|---|---|---|---|---|
| Rent | -10% $-10 | -5% $52 | +0% $114 | +5% $176 | +10% $238 |
| Rate | -1.0pp $209 | -0.5pp $162 | base $114 | +0.5pp $65 | +1.0pp $15 |
UW: 25.0% down · 7.5% · 30yr · 1.5% tax · 5.0% vac · 8.0% maint · 8.0% mgmt
Financing live
Cash to close
- Down payment
- $47,250
- Closing costs
- $5,670
- Reserves months
- —
- Total cash needed
- —
Loan-product check · same deal, 3 products live
Conventional
25% down · 7.5% · 30yr
- Down + closing
- —
- Monthly P&I
- —
- Monthly cashflow
- —
- DSCR
- —
- Eligible?
- —
Personal DTI + credit; lowest rate.
DSCR
20% down · 8.5% · 30yr
- Down + closing
- —
- Monthly P&I
- —
- Monthly cashflow
- —
- DSCR
- —
- Eligible?
- —
No personal income docs; deal must DSCR.
Hard money
10% down · 12.0% · 12mo
- Down + closing
- —
- Monthly P&I
- —
- Monthly cashflow
- —
- DSCR
- —
- Eligible?
- —
Short-term bridge; refi at stabilization.
Listing history 3 events
-
2026-06-18days on market $189,000 Active 2 DOM
-
2026-06-16remarks 699-char remark
-
2026-06-16$189,000 Active 1 DOM
ⓘ Source: listings_history table (triggers on properties + properties_extension) + one-shot
backfill from property_details.listing_events for pre-trigger history.
Tax reassessment forecast AZ · Resets to sale price
- Current annual tax
- $680 · $57/mo
- Projected year-2 tax
- $1,247 · $104/mo
- Expected delta
- +$568/yr (+$47/mo · 83.6%)
ⓘ Screening estimate from a state-policy table — verify with the county assessor before closing.
Climate risk First Street
- Flood 1/10 Low FEMA zone X (shaded) · 0% chance over 30 yrs
- Wildfire 3/10 Moderate
- Heat 9/10 Extreme 7 d/yr ≥115°F today · 15 d/yr by 30 yrs out
- Wind 1/10 Low
- Air quality 1/10 Low 0 unhealthy d/yr today · 0 by 30 yrs out
Nearby sold comps map
Loading sold comps map…
Walkable amenities ~0.75 mi
Loading nearby amenities…
Taxation est. · year 1
- Rental income
- $18,843
- − Mortgage interest
- −$10,587
- − Property taxes
- −$680
- − Insurance
- −$945
- − Repairs & maintenance
- −$1,507
- − Management
- −$1,507
- − Depreciation
- −$5,498
- Taxable loss
- −$1,882
- Est. tax savings @ 24.0%
- +$452
- After-tax cash flow
- $1,819/yr
For passive investors: Depreciation is non-cash, so a rental often shows a tax loss while cash-flowing — sheltering income. Rental losses are passive: they offset passive income freely, and up to $25,000/yr can offset ordinary (W-2) income if you actively participate and your MAGI is under $100k (phasing out to $0 by $150k); unused losses carry forward. On sale, claimed depreciation is recaptured at up to 25%, and gains may owe capital-gains tax (a 1031 exchange can defer both). Figures are a year-1 estimate at your 24.0% rate — not tax advice; consult a CPA.
Schools (NCES district)
- District
- Parker Unified School District (4510)
- NCES district ID
- 0405980
- Math proficiency
- 18% ▼ -10.00%
- Reading proficiency
- 18% ▼ -7.00%
- Median HH income
- $34,354
- Composite
- 14.76/100
- National rank
- #9392
- State rank
- #200 of 249 in AZ
Livability — Cienega Springs
- Score
- 63/100
- State rank
- #107
- US rank
- #14934
Category grades
Schools grade is shown separately in the Schools card above.
Census & demographics
- Census place
- Cienega Springs, AZ
- Population (ZIP)
- 9,069
Population outlook (La Paz County) Hauer SSP2
- Today (2025)
- 18,409 people
- By 2030
- 17,592 · -4.4%
- By 2040
- 16,600 · -9.8%
- By 2050
- 16,328 · -11.3%
- By 2075
- 17,075 · -7.2%
- By 2100
- 17,042 · -7.4%
Race, ethnicity, and origin ACS 2023
- Neighborhood character
- Highly diverse neighborhood (Simpson 0.72)
- Race & ethnicity
- White 40% Hispanic / Latino 34% Native American 23% Two or more races 19% Asian 2%
- Hispanic origin (detail)
- Mexican 32%
- Common ancestry
- Slovak 1% Lithuanian 1% Portuguese 1%
- Foreign-born
- 10% · Canada
- Languages at home
- 74% English-only · Spanish 21% Other Indo-European 1% Tagalog/Filipino 1%
Political lean MEDSL · La Paz
- 2024 margin
- Solid R (+44.2) · D 27.6% · R 71.8%
- 2008→2024 swing
- -15.7pp toward R · 2008: -28.5pp · 2024: -44.2pp
- All cycles
- 2024: R+44.2 2020: R+38.8 2016: R+41.8 2012: R+32.2 2008: R+28.5
Not yet ingested
- Civics
- —
Market trends
- HPI YoY
- ▼ -155.38%
- Current HPI
- 198.2271
- Rent YoY
- —
- Metro
- —
- State GDP YoY
- ▲ 4.54%
- F500 in state
- 20
Industry mix (Fortune 500 HQ in AZ)
| Industry | F500 HQs | Revenue |
|---|---|---|
| Technology | 2 | $13B |
|
||
| Mining / Metals | 1 | $23B |
|
||
| Environmental Services | 1 | $16B |
|
||
| Metals / Steel | 1 | $14B |
|
||
| Technology Distribution | 1 | $9B |
|
||
| Homebuilding | 1 | $8B |
|
||
Price history
+173.9% since first listed16 events — show timeline
- 2026-06-16 Listed $189,000 LHAR
- 2025-11-29 Relisted — LHAR
- 2025-10-09 Relisted — LHAR
- 2025-09-24 Pending — LHAR
- 2025-05-02 Relisted — LHAR
- 2024-11-22 Listed $189,000 LHAR
- 2024-01-05 Relisted — LHAR
- 2023-08-07 Relisted — LHAR
- 2023-07-27 Relisted — LHAR
- 2023-07-27 Price Changed $189,000 LHAR
- 2022-10-02 Relisted — LHAR
- 2022-09-06 Relisted — LHAR
- 2022-01-14 Listed $159,000 LHAR
- 2022-01-03 Sold (Public Records) $59,000 Public Records
- 2022-01-03 Sold (MLS) $59,000 LHAR
- 2020-07-02 Listed $69,000 LHAR
Property tax history
+2.8%/yrLatest (2025): $680 · +3.4% YoY. Source: county tax records.
Cash-flow waterfall
monthlySold comps — $/sqft
last 12 mo · ≤1 miLoading sold comps…