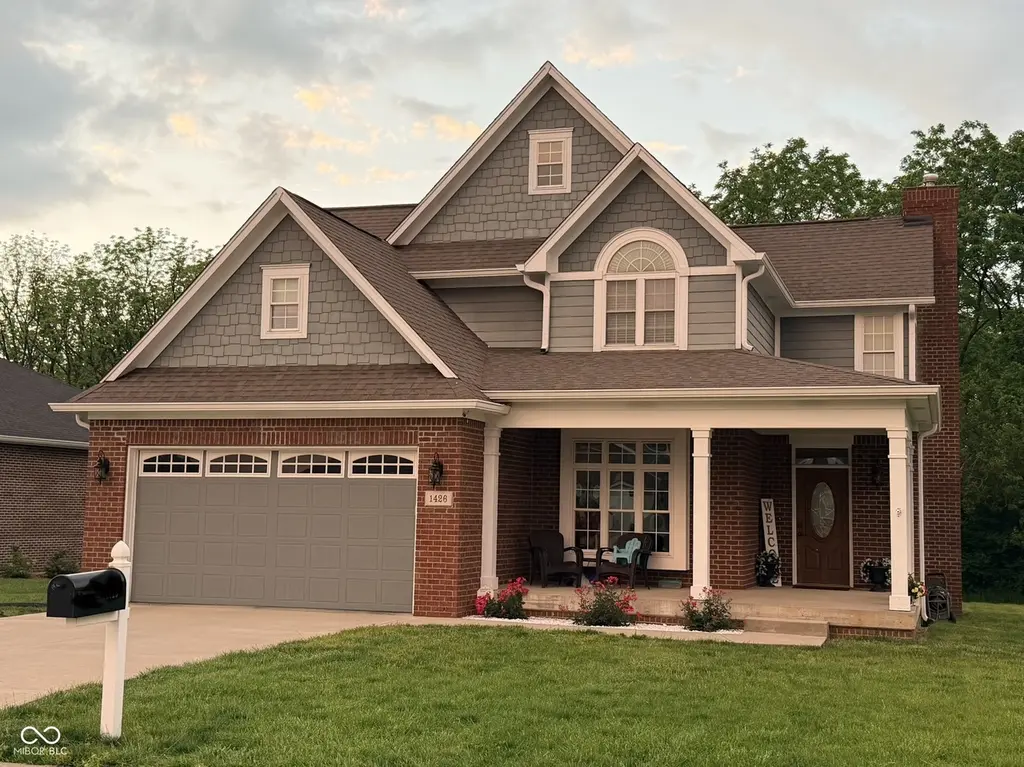
1426 W Weatherby Ct · Greensburg, IN
Flood risk 1/10 · Minimal
- FEMA flood zone
- X (unshaded)
- Chance of flooding over 30 yrs
- 0.0%
- Est. flood insurance / yr
- $507 – $1,088
Fire risk 1/10 · Minimal
- Est. fire insurance / yr
- $717 – $1,331
Heat risk 4/10 · Minor
- Hot days now (above 102°F)
- 7 days/yr
- Hot days in 30 yrs
- 19 days/yr
Wind risk 2/10 · Minimal
- Chance of severe wind over 30 yrs
- 1.0%
Air-quality risk 2/10 · Minimal
- Unhealthy air days now
- 1 days/yr
- Unhealthy air days in 30 yrs
- 2 days/yr
Risk factors via First Street. Map © Google.
Why this score? — see what drove the F grade
The composite is a weighted blend of 9 inputs, each scored 0–100. Each bar is that input's sub-score; the figure is the points it added to the 100-point composite (weight × sub-score).
- ARV discount +5.3/15.0
- Schools +3.8/10.0
- Livability +3.5/5.0
- Cash flow +3.2/30.0
- Rent growth +2.5/5.0
- Condition / age +2.5/5.0
- 1% rule +0.0/10.0
- DSCR +0.0/10.0
- Appreciation +0.0/10.0
$439,900
🖨 Deal sheet (PDF) 📄 Offer letter ✓ Due diligence
Listing remarks
4 Bedroom 2.5 Bath with an extra office space that could be converted into a 5th bedroom! Quiet neighborhood, spacious backyard with a storage shed. Large kitchen and living room inside. 2 car garage and ample street parking. Golf cart distance of Greensburg Golf Course. Beautiful home!
Key facts
- Extra office space
- Spacious backyard
- Living room
Tags
Property features AI
Exterior
- Parking: Attached 2-car garage (approximately 567 sq ft)
- Utilities: Public water; Municipal sewer connected
- Home design: Single family residence; Two-and-a-half levels
- Construction: Vinyl siding; Crawl space foundation
- Exterior features: Approximately 0.26 acre lot (about 1/4–1/2 acre)
Interior
- Kitchen: Dishwasher; Electric oven; Oven; Refrigerator; Water heater
- Bedrooms: Four bedrooms on the upper level
- Flooring: Hardwood floors
- Bathrooms: Two full bathrooms (upper level); One half bathroom (main level)
- Heating & cooling: Electric heating; Forced air; Natural gas heating; Heat pump; Central air conditioning
- Interior features: High ceilings; Hardwood floors; Walk-in closet(s); Painted woodwork
- Laundry & utility: Main level laundry room
Neighborhood map
What this means for you Summary
Snapshot
- This is a 3-bed/2.5-bath single-family listed at $440k.
Deal economics
- At list price, monthly cash flow is $-1k ($-17k/yr) — negative.
- To cash-flow at today's rent, offer at most $194k (56.0% below list).
- To meet the 1% rule (rent ≥ 1% of price), the offer needs to be $169k (61.7% below list).
- Recommended offer: $169k (61.7% below list) — sets the bar for 1% rule.
- Cap rate 2.5% vs local median 5.9% in Greensburg — below-typical yield; the buyer is paying a premium for something (appreciation thesis, condition, location) that the cap rate doesn't capture.
Location & tenants
- Location reads 69/100 on livability (#200 in IN) — a middle-class / working-renter tenant base. Strengths: cost of living A+, housing A+, crime B+; Watch: employment C-, amenities F, commute F.
- Greensburg Community Schools (town): math 38% / reading 51% proficiency, ranked #102 of 301 in IN (top 34%) — families likely to look elsewhere, expect single-tenant / working-renter base with shorter leases.
- Zoned schools: Greensburg Elementary (math 60% / reading 47%, grade C, #225 of 994 statewide, top 23%, 1,037 students, 55% FRL); Greensburg Community Jr High (math 24% / reading 49%, grade F, #156 of 330 statewide, top 48%, 441 students, 48% FRL); Greensburg Community High School (math 27% / reading 67%, grade D-, #143 of 369 statewide, top 44%, 671 students, 44% FRL).
- Market conditions: 157 active listings in the ZIP; 66 units permitted in Decatur County in 2024 (0 in 5+ unit buildings).
Forward outlook
- Local home prices are declining (-3.0%/yr); year-one equity from $3k of loan paydown is wiped out by about $13k of value loss. Plan a longer hold.
- Decatur County population projected at +6% by 2050 — modest demand growth; plan on rents tracking national, not racing it.
Negotiation context
- Only 1 days on market — expect competitive offers; lowballing is unlikely to land.
Questions for the listing agent
- What do current leases actually rent for vs. the listed asking? Can we see a recent rent roll and the last 12 months of T-12 income?
- Is there a deadline driving the sale (1031 exchange, divorce, estate, relocation)? That informs how much negotiation room exists.
- Schools are D-rated, which usually means shorter tenancies and higher turnover. Who's the typical renter profile here, and what's been the actual vacancy rate?
- The area grade is low — what's the realistic commute time and amenity access for the typical tenant pool here? Any planned neighborhood developments (good or bad) we should know about?
- What's the average days-on-market for RENTAL listings here right now (not sales)? A rising rental-DOM trend means longer vacancies and softer asking-rent achievability than the comps imply.
- What's the recent tenant-quality profile in this submarket — average credit score on applications, eviction rate, late-payment / NSF rate, and stable-employment percentage? A property-management company in the area should have these aggregated.
- How much new for-sale + rental construction is in the pipeline within 1–3 miles? Heavy new supply typically softens prices + rents 12–24 months out; constrained supply supports both.
Investment metrics
- 1% rule
- 0.38% ✗
- Cap rate
- 2.49%
- Cash-on-cash
- -13.58%
- DSCR
- 0.40
- GRM
- 21.8
CMA / ARV
- ARV (on-the-fly)
- $419,715
- Comps found
- 1
Show comp detail 1 sale within ~0.75 mi
| Address | Dist | Beds/Ba | Sqft | Sold | Price | $/sf | Match |
|---|---|---|---|---|---|---|---|
| 700 S Kieran Dr | 0.13mi | 4/2.5 (+1) | 3,120 (+0%) | 12mo | $420,000 | $135 | 78 |
Match score weights: distance 35% · size 25% · config 20% · recency 20%. Top-matched comps best support the ARV.
Projected returns pro-forma
-3.0% appreciation · 3.0% rent growth · sell at horizon
- IRR
- -42.0%
- Equity multiple
- -0.30×
- Total profit
- $-160,234
- Equity at exit
- $65,591
- IRR
- -71.5%
- Equity multiple
- -1.07×
- Total profit
- $-254,535
- Equity at exit
- $38,035
Cash invested: $123,172 (down + closing). Projections, not guarantees.
Landlord ↔ Tenant lean methodology
- Overall (STATE)
- 90 Strongly Landlord-Friendly
- State Indiana
- 90 Strongly Landlord-Friendly · R+11
- County
- — inherits STATE
- City
- — inherits STATE
ZIP-level market 47240
- Home prices YoY
- -25.0%
- Active inventory
- 157
- Price-to-rent
- 21.8×
Monthly cashflow live
- Estimated rent
- $1,685 medium interval (Pro) →
- Mortgage (P&I)
- −$2,307
- Tax from tax record
- −$235 /mo · $2,823/yr
- Insurance
- −$183
- HOA
- −$0
- Vacancy / Maint / Mgmt
- −$354
- Net cashflow
- $-1,394
Break-even live
Sensitivity live
| Price | -10% $-1,145 | -5% $-1,269 | +0% $-1,394 | +5% $-1,518 | +10% $-1,643 |
|---|---|---|---|---|---|
| Rent | -10% $-1,527 | -5% $-1,461 | +0% $-1,394 | +5% $-1,327 | +10% $-1,261 |
| Rate | -1.0pp $-1,172 | -0.5pp $-1,282 | base $-1,394 | +0.5pp $-1,508 | +1.0pp $-1,624 |
UW: 25.0% down · 7.5% · 30yr · 1.5% tax · 5.0% vac · 8.0% maint · 8.0% mgmt
Financing live
Cash to close
- Down payment
- $109,975
- Closing costs
- $13,197
- Reserves months
- —
- Total cash needed
- —
Loan-product check · same deal, 3 products live
Conventional
25% down · 7.5% · 30yr
- Down + closing
- —
- Monthly P&I
- —
- Monthly cashflow
- —
- DSCR
- —
- Eligible?
- —
Personal DTI + credit; lowest rate.
DSCR
20% down · 8.5% · 30yr
- Down + closing
- —
- Monthly P&I
- —
- Monthly cashflow
- —
- DSCR
- —
- Eligible?
- —
No personal income docs; deal must DSCR.
Hard money
10% down · 12.0% · 12mo
- Down + closing
- —
- Monthly P&I
- —
- Monthly cashflow
- —
- DSCR
- —
- Eligible?
- —
Short-term bridge; refi at stabilization.
Listing history 2 events
-
2026-05-27status Pending
-
2026-05-26$439,900 Active
ⓘ Source: listings_history table (triggers on properties + properties_extension) + one-shot
backfill from property_details.listing_events for pre-trigger history.
Tax reassessment forecast IN · Partial reset (capped growth)
- Current annual tax
- $2,823 · $235/mo
- Projected year-2 tax
- $3,281 · $273/mo
- Expected delta
- +$458/yr (+$38/mo · 16.2%)
ⓘ Screening estimate from a state-policy table — verify with the county assessor before closing.
Climate risk First Street
- Flood 1/10 Low FEMA zone X (unshaded) · 0% chance over 30 yrs
- Wildfire 1/10 Low
- Heat 4/10 Moderate 7 d/yr ≥102°F today · 19 d/yr by 30 yrs out
- Wind 2/10 Low 100% chance of damaging wind over 30 yrs
- Air quality 2/10 Low 1 unhealthy d/yr today · 2 by 30 yrs out
Nearby sold comps map
Loading sold comps map…
Walkable amenities ~0.75 mi
Loading nearby amenities…
Taxation est. · year 1
- Rental income
- $20,224
- − Mortgage interest
- −$24,641
- − Property taxes
- −$2,823
- − Insurance
- −$2,200
- − Repairs & maintenance
- −$1,618
- − Management
- −$1,618
- − Depreciation
- −$12,797
- Taxable loss
- −$25,472
- Est. tax savings @ 24.0%
- +$6,113
- After-tax cash flow
- $-10,614/yr
For passive investors: Depreciation is non-cash, so a rental often shows a tax loss while cash-flowing — sheltering income. Rental losses are passive: they offset passive income freely, and up to $25,000/yr can offset ordinary (W-2) income if you actively participate and your MAGI is under $100k (phasing out to $0 by $150k); unused losses carry forward. On sale, claimed depreciation is recaptured at up to 25%, and gains may owe capital-gains tax (a 1031 exchange can defer both). Figures are a year-1 estimate at your 24.0% rate — not tax advice; consult a CPA.
Schools (NCES district)
- District
- Greensburg Community Schools
- NCES district ID
- 1804080
- Math proficiency
- 38% ▼ -7.00%
- Reading proficiency
- 51% ▼ -2.00%
- Median HH income
- $47,723
- Composite
- 37.96/100
- National rank
- #4301
- State rank
- #102 of 301 in IN
Livability — Greensburg
- Score
- 69/100
- State rank
- #200
- US rank
- #8922
Category grades
Schools grade is shown separately in the Schools card above.
Census & demographics
- Census place
- Greensburg, IN
- Population (ZIP)
- 21,514
Population outlook (Decatur County) Hauer SSP2
- Today (2025)
- 27,709 people
- By 2030
- 28,278 · +2.1%
- By 2040
- 29,195 · +5.4%
- By 2050
- 29,512 · +6.5%
- By 2075
- 29,835 · +7.7%
- By 2100
- 27,192 · -1.9%
Race, ethnicity, and origin ACS 2023
- Neighborhood character
- Predominantly White (93%)
- Race & ethnicity
- White 93% Two or more races 5% Hispanic / Latino 3%
- Common ancestry
- Slovak 2% Serbian 1% Romanian 1%
- Foreign-born
- 1% · Canada
- Languages at home
- 98% English-only · Spanish 2%
Political lean MEDSL · Decatur
- 2024 margin
- Solid R (+58.5) · D 19.9% · R 78.4% · Other 1.8%
- 2008→2024 swing
- -34.1pp toward R · 2008: -24.4pp · 2024: -58.5pp
- All cycles
- 2024: R+58.5 2020: R+58.1 2016: R+57.4 2012: R+40.5 2008: R+24.4
Not yet ingested
- Civics
- —
Market trends
- HPI YoY
- ▼ -70.13%
- Current HPI
- 210.3591
- Rent YoY
- —
- Metro
- —
- State GDP YoY
- ▲ 2.90%
- F500 in state
- 18
Industry mix (Fortune 500 HQ in IN)
| Industry | F500 HQs | Revenue |
|---|---|---|
| Industrial Machinery | 2 | $37B |
|
||
| Healthcare | 1 | $177B |
|
||
| Pharmaceuticals | 1 | $45B |
|
||
| Metals / Steel | 1 | $18B |
|
||
| Agriculture | 1 | $17B |
|
||
| Packaging | 1 | $12B |
|
||
Price history
2 events — show timeline
- 2026-05-27 Pending — MIBOR as Distributed by MLS Grid
- 2026-05-26 Listed $439,900 MIBOR as Distributed by MLS Grid
Property tax history
+0.4%/yrLatest (2023): $2,823 · +4.5% YoY. Source: county tax records.
Cash-flow waterfall
monthlySold comps — $/sqft
last 12 mo · ≤1 miLoading sold comps…