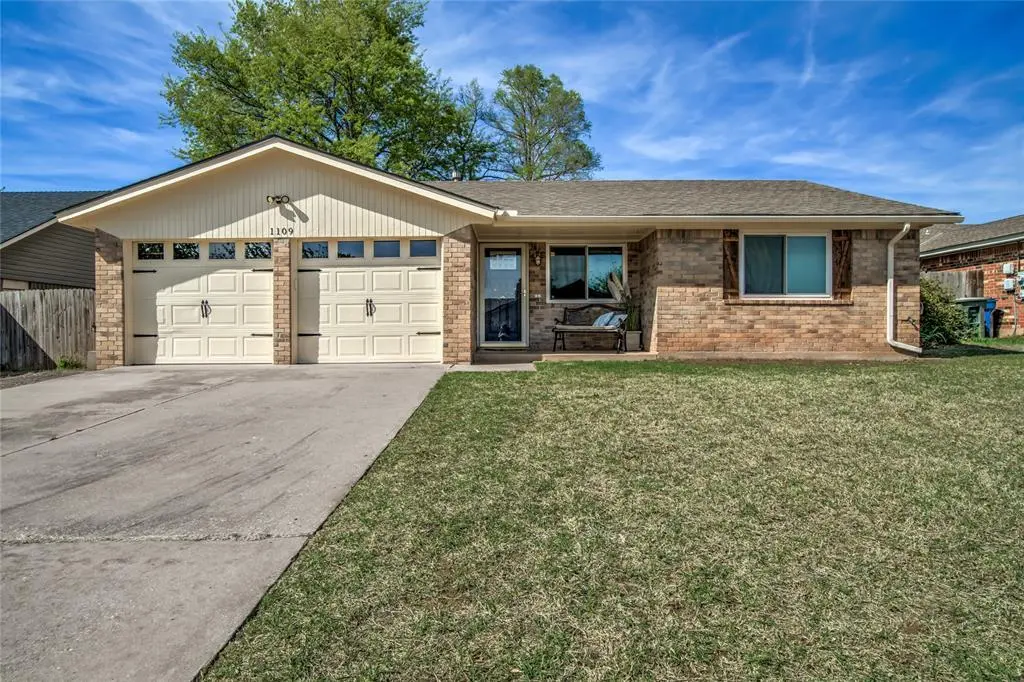
1109 Teal Pl · Edmond, OK
Flood risk 1/10 · Minimal
- FEMA flood zone
- X (unshaded)
- Chance of flooding over 30 yrs
- 0.0%
- Est. flood insurance / yr
- $507 – $1,088
Fire risk 4/10 · Minor
- Est. fire insurance / yr
- $2,463 – $4,575
Heat risk 6/10 · Moderate
- Hot days now (above 108°F)
- 7 days/yr
- Hot days in 30 yrs
- 19 days/yr
Wind risk 2/10 · Minimal
- Chance of severe wind over 30 yrs
- 4.0%
Air-quality risk 2/10 · Minimal
- Unhealthy air days now
- 2 days/yr
- Unhealthy air days in 30 yrs
- 2 days/yr
Risk factors via First Street. Map © Google.
Why this score? — see what drove the D- grade
The composite is a weighted blend of 9 inputs, each scored 0–100. Each bar is that input's sub-score; the figure is the points it added to the 100-point composite (weight × sub-score).
- Cash flow +12.5/30.0
- Livability +3.9/5.0
- DSCR +3.7/10.0
- Schools +3.6/10.0
- Rent growth +3.5/5.0
- ARV discount +2.9/15.0
- 1% rule +2.6/10.0
- Condition / age +2.5/5.0
- Appreciation +0.0/10.0
$211,000
🖨 Deal sheet 📄 Offer letter ✓ Due diligence
Listing remarks
Updated where it counts, this home offers a level of care and functionality you can feel the moment you walk in. Behind the scenes, major systems have already been addressed, including newer sewer lines, updated heating and air, a newer water heater, and a replaced roof with gutters and protective screens—giving you confidence in the home’s long-term performance. Inside, the space has been refreshed with new flooring, updated lighting, and fresh interior paint. The kitchen brings it all together with freshly painted cabinetry and Corian countertops—clean, durable, and designed for everyday living. Natural light flows through updated windows, while the enclosed patio with s
Key facts
- Newer sewer lines
- Updated windows
- Updated heating
Tags
Neighborhood map
What this means for you Summary
Snapshot
- This is a 3-bed/2.0-bath single-family listed at $211k.
Deal economics
- At list price, monthly cash flow is $-32 ($-384/yr) — negative.
- To cash-flow at today's rent, offer at most $205k (2.7% below list).
- To meet the 1% rule (rent ≥ 1% of price), the offer needs to be $160k (24.3% below list).
- Recommended offer: $160k (24.3% below list) — sets the bar for 1% rule.
- Cap rate 6.1% vs local median 3.4% in Edmond — top-decile yield for the area; either an underpriced asset or a hidden risk that comps aren't pricing in. Stress-test before assuming the spread holds.
Location & tenants
- Location reads 78/100 on livability (#6 in OK, #2,383 nationally) — a middle-class / working-renter tenant base. Strengths: employment A+, housing A+, crime A-; Watch: health & safety C-, commute F.
- Edmond (suburban): math 38% / reading 40% proficiency, ranked #11 of 270 in OK (top 4%) — families likely to look elsewhere, expect single-tenant / working-renter base with shorter leases.
- Zoned schools: Ida Freeman Es (math 17% / reading 17%, grade F, #540 of 845 statewide, top 68%, 464 students, 0% FRL); North Hs (math 47% / reading 57%, grade D+, #1 of 447 statewide, top 0%, 2,555 students, 0% FRL) — zoned schools average 0% FRL vs 22% district-wide (22 pts lower); this property's tenant base skews higher-income than the district average.
- Market conditions: Rents rising (+3.9%/yr); 215 active listings in the ZIP; 40 comparable units currently listed for rent nearby; rentals at typical pace (median 15d on market — plan ~3-4 weeks tenant-placement turnaround); solid renter incomes; 5,365 units permitted in Oklahoma County in 2024 (569 in 5+ unit buildings).
Forward outlook
- Local home prices are declining (-3.0%/yr); year-one equity from $1k of loan paydown is wiped out by about $6k of value loss. Plan a longer hold.
- Oklahoma County population projected at +41% by 2050 — long-run rental-demand tailwind backs the buy-and-hold thesis.
Negotiation context
- Only 2 days on market — expect competitive offers; lowballing is unlikely to land.
- Current owner paid $74k; list at $211k implies a 185% gain — meaningful room to come down on a strong offer.
Risks & watch-outs
- Climate carrying-cost: extreme-heat days projected 7→19/yr by 2055 (HVAC capex compounding) — expect insurance premiums to compound above CPI over the hold.
Questions for the listing agent
- What do current leases actually rent for vs. the listed asking? Can we see a recent rent roll and the last 12 months of T-12 income?
- Is there a deadline driving the sale (1031 exchange, divorce, estate, relocation)? That informs how much negotiation room exists.
- Schools are A-rated — typically a magnet for longer-tenancy family renters. What's the average tenant stay here, and is there a school-zone premium baked into asking?
- The area grade is low — what's the realistic commute time and amenity access for the typical tenant pool here? Any planned neighborhood developments (good or bad) we should know about?
- What's the average days-on-market for RENTAL listings here right now (not sales)? A rising rental-DOM trend means longer vacancies and softer asking-rent achievability than the comps imply.
- What's the recent tenant-quality profile in this submarket — average credit score on applications, eviction rate, late-payment / NSF rate, and stable-employment percentage? A property-management company in the area should have these aggregated.
- How much new for-sale + rental construction is in the pipeline within 1–3 miles? Heavy new supply typically softens prices + rents 12–24 months out; constrained supply supports both.
Investment metrics
- 1% rule
- 0.76% ✗
- Cap rate
- 6.11%
- Cash-on-cash
- -0.65%
- DSCR
- 0.97
- GRM
- 11.0
CMA / ARV
- ARV (on-the-fly)
- $191,520
- Comps found
- 12
Show comp detail 12 sales within ~0.75 mi
| Address | Dist | Beds/Ba | Sqft | Sold | Price | $/sf | Match |
|---|---|---|---|---|---|---|---|
| 724 Red Oak Ter | 0.33mi | 3/2.0 | 1,106 (-1%) | 8mo | $179,450 | $162 | 76 |
| 712 Willow Ridge Pl | 0.32mi | 3/1.5 | 1,080 (-4%) | 3mo | $199,500 | $185 | 74 |
| 705 Holly Hill Rd | 0.33mi | 3/2.0 | 1,153 (+3%) | 7mo | $185,000 | $160 | 74 |
| 713 Lapwing Rd | 0.20mi | 2/2.0 (-1) | 1,216 (+9%) | 2mo | $192,500 | $158 | 70 |
| 1617 Apian Way | 0.64mi | 3/2.0 | 1,102 (-2%) | 5mo | $188,750 | $171 | 63 |
| 501 Meadow Lake Dr | 0.47mi | 3/1.0 | 1,058 (-6%) | 4mo | $200,000 | $189 | 61 |
| 504 Gayclifee Ter | 0.58mi | 3/2.0 | 1,010 (-10%) | 1mo | $189,000 | $187 | 56 |
| 1609 Apian Way | 0.61mi | 3/2.0 | 1,215 (+8%) | 4mo | $205,000 | $169 | 54 |
| 824 Cedar Crest Dr | 0.69mi | 3/1.5 | 1,006 (-10%) | 2mo | $200,000 | $199 | 47 |
| 433 Larkspur Ct | 0.51mi | 3/2.0 | 1,288 (+15%) | 10mo | $215,000 | $167 | 42 |
| 432 Wisdom Way | 0.67mi | 3/2.0 | 1,266 (+13%) | 7mo | $229,000 | $181 | 41 |
| 424 N Cherryvale Rd | 0.67mi | 3/2.0 | 1,285 (+15%) | 5mo | $210,000 | $163 | 40 |
Match score weights: distance 35% · size 25% · config 20% · recency 20%. Top-matched comps best support the ARV.
Projected returns pro-forma
-3.0% appreciation · 3.86% rent growth · sell at horizon
- IRR
- -16.6%
- Equity multiple
- 0.41×
- Total profit
- $-34,911
- Equity at exit
- $31,461
- IRR
- -7.1%
- Equity multiple
- 0.53×
- Total profit
- $-27,515
- Equity at exit
- $18,243
Cash invested: $59,080 (down + closing). Projections, not guarantees.
Landlord ↔ Tenant lean methodology
- Overall (STATE)
- 83 Strongly Landlord-Friendly
- State Oklahoma
- 83 Strongly Landlord-Friendly · R+20
- County
- — inherits STATE
- City
- — inherits STATE
ZIP-level market 73003
- Home prices YoY
- -31.2%
- Rents YoY
- 3.9%
- Active inventory
- 215
- Price-to-rent
- 11.0×
Monthly cashflow live
- Estimated rent
- $1,597 high interval (Pro) →
- Mortgage (P&I)
- −$1,107
- Tax from tax record
- −$99 /mo · $1,188/yr
- Insurance
- −$88
- HOA
- −$0
- Vacancy / Maint / Mgmt
- −$335
- Net cashflow
- $-32
Break-even live
UW: 25.0% down · 7.5% · 30yr · 1.5% tax · 5.0% vac · 8.0% maint · 8.0% mgmt
Financing live
Cash to close
- Down payment
- $52,750
- Closing costs
- $6,330
- Reserves months
- —
- Total cash needed
- —
Loan-product check · same deal, 3 products live
Conventional
25% down · 7.5% · 30yr
- Down + closing
- —
- Monthly P&I
- —
- Monthly cashflow
- —
- DSCR
- —
- Eligible?
- —
Personal DTI + credit; lowest rate.
DSCR
20% down · 8.5% · 30yr
- Down + closing
- —
- Monthly P&I
- —
- Monthly cashflow
- —
- DSCR
- —
- Eligible?
- —
No personal income docs; deal must DSCR.
Hard money
10% down · 12.0% · 12mo
- Down + closing
- —
- Monthly P&I
- —
- Monthly cashflow
- —
- DSCR
- —
- Eligible?
- —
Short-term bridge; refi at stabilization.
Rent comps 40 comps
| Address | Beds | Baths | Sqft | Rent | $/sqft | DOM | Units | Dist |
|---|---|---|---|---|---|---|---|---|
| 1015 Swan Lake Ct Edmond, OK | 2.0 | 2.0 | 1200 | $1,295 | $1.08 | 4d | 1 | 0.11mi |
| 1015 Swan Lake Ct Edmond, OK | 2.0 | 2.0 | 1200 | $1,295 | $1.08 | 23d | 1 | 0.11mi |
| 733 Lapwing Rd Edmond, OK | 2.0 | 2.0 | 1216 | $1,450 | $1.19 | 23d | 1 | 0.16mi |
| 317 Dooley Creek Ln Edmond, OK | 3.0 | 2.0 | 1295 | $1,595 | $1.23 | 14d | 1 | 0.34mi |
| 313 Dooley Creek Ln Edmond, OK | 3.0 | 2.0 | 1295 | $1,595 | $1.23 | 23d | 1 | 0.35mi |
| 620 Winding Ln Edmond, OK | 3.0 | 2.0 | 1133 | $1,550 | $1.37 | 2d | 1 | 0.38mi |
| 1129 Carpe Diem Ct Edmond, OK | 3.0 | 2.0 | 1250 | $1,595 | $1.28 | 4d | 1 | 0.46mi |
| 25 Creek View Dr Edmond, OK | 1.0–2.0 | 1.0–2.0 | 872 | $1,336 | $1.53 | 4d | 1 | 0.52mi |
| 714 W Hurd St Edmond, OK | 2.0 | 1.0 | 1000 | $1,150 | $1.15 | 23d | 1 | 0.57mi |
| 513 Sunnyside Pl Edmond, OK | 3.0 | 1.5 | 1130 | $1,350 | $1.19 | 4d | 1 | 0.59mi |
| 413 Meadow Lake Dr Edmond, OK | 4.0 | 2.0 | 1369 | $1,500 | $1.10 | 2d | 1 | 0.59mi |
| 320 Cedar Crest Dr Edmond, OK | 3.0 | 1.5 | 1051 | $1,295 | $1.23 | 2d | 1 | 0.66mi |
| 242 Barrett Pl Edmond, OK | 2.0 | 1.0 | 1029 | $1,150 | $1.12 | 21d | 1 | 0.75mi |
| 1303 Fretz Ave Edmond, OK | 2.0 | 2.0 | 1007 | $1,295 | $1.29 | 4d | 1 | 0.78mi |
| 231 Barrett Pl Edmond, OK | 3.0 | 2.0 | 1175 | $1,295 | $1.10 | 23d | 1 | 0.79mi |
| 612 W 2nd St Unit 100 Edmond, OK | 3.0 | 2.5 | 1414 | $1,895 | $1.34 | 21d | 1 | 0.80mi |
| 15 S Walnut St Edmond, OK | 2.0 | 1.0 | 1162 | $1,400 | $1.20 | 23d | 1 | 0.83mi |
| 211 Ashley Dr Edmond, OK | 3.0 | 2.0 | 1250 | $1,440 | $1.15 | 23d | 1 | 0.85mi |
| 437 Chalk Hill Ct Edmond, OK | 3.0 | 2.0 | 1216 | $1,595 | $1.31 | 23d | 1 | 0.86mi |
| 425 Chalk Hill Ct Edmond, OK | 3.0 | 2.0 | 1243 | $1,550 | $1.25 | 14d | 1 | 0.86mi |
| 200 Ashley Dr Edmond, OK | 3.0 | 2.0 | 1225 | $1,375 | $1.12 | 23d | 1 | 0.87mi |
| 1225 Sequoyah Pl Edmond, OK | 2.0 | 1.5 | 1183 | $1,350 | $1.14 | 14d | 1 | 0.88mi |
| 128 Ashley Dr Edmond, OK | 3.0 | 2.0 | 1250 | $1,455 | $1.16 | 23d | 1 | 0.89mi |
| 159 Barrett Pl Edmond, OK | 2.0 | 1.5 | 1175 | $1,175 | $1.00 | 23d | 1 | 0.89mi |
| 436 Chalk Hill Ct Edmond, OK | 3.0 | 2.0 | 1274 | $2,850 | $2.24 | 23d | 1 | 0.89mi |
| 436 Chalk Hill Ct Edmond, OK | 3.0 | 2.0 | 1274 | $2,850 | $2.24 | 21d | 1 | 0.89mi |
| 412 Chalk Hill Ct Edmond, OK | 3.0 | 2.0 | 1216 | $1,565 | $1.29 | 14d | 1 | 0.89mi |
| 425 Sterling Pointe Way Unit 425 Edmond, OK | 2.0 | 2.0 | 1050 | $1,300 | $1.24 | 4d | 1 | 0.91mi |
| 1201 Covell Village Dr Edmond, OK | 3.0 | 2.0 | 1265 | $1,872 | $1.48 | 14d | 1 | 1.00mi |
| 1201 Covell Village Dr Edmond, OK | 2.0 | 2.0 | 1090 | $1,641 | $1.51 | 11d | 1 | 1.00mi |
| 105 W Hurd St Edmond, OK | 2.0 | 1.0 | 930 | $1,550 | $1.67 | 2d | 1 | 1.00mi |
| 101 W Main St Edmond, OK | 3.0 | 1.0–2.0 | 991 | $2,320 | $2.34 | 1d | 111 | 1.05mi |
| 5 E Thatcher St Edmond, OK | 3.0 | 1.0 | 1144 | $1,550 | $1.35 | 23d | 1 | 1.12mi |
| 600 N Broadway Edmond, OK | 2.0 | 1.0 | 1062 | $1,325 | $1.25 | 2d | 1 | 1.13mi |
| 808 Mars Cir Unit 1 Edmond, OK | 3.0 | 1.0 | 1401 | $1,375 | $0.98 | 20d | 1 | 1.25mi |
| 504 N Boulevard Edmond, OK | 3.0 | 2.0 | 1250 | $2,595 | $2.08 | 14d | 1 | 1.26mi |
| 1504 Apollo Rd Edmond, OK | 3.0 | 2.0 | 1435 | $1,475 | $1.03 | 11d | 1 | 1.26mi |
| 804 Stag Trl Edmond, OK | 3.0 | 2.0 | 1250 | $1,550 | $1.24 | 23d | 1 | 1.38mi |
| 804 Stag Trl Edmond, OK | 3.0 | 2.0 | 1250 | $1,550 | $1.24 | 4d | 1 | 1.38mi |
| 1013 Kelly Park Rd Edmond, OK | 4.0 | 2.0 | 1450 | $1,550 | $1.07 | 2d | 1 | 1.39mi |
Listing history 5 events
-
2026-04-13status Pending
-
2026-04-11$211,000 Active
-
2004-01-27soldstatus $74,000
-
1987-08-27soldstatus $52,000
-
1982-09-01soldstatus $51,000
ⓘ Source: listings_history table (triggers on properties + properties_extension) + one-shot
backfill from property_details.listing_events for pre-trigger history.
Tax reassessment forecast OK · Resets to sale price
- Current annual tax
- $1,188 · $99/mo
- Projected year-2 tax
- $1,899 · $158/mo
- Expected delta
- +$711/yr (+$59/mo · 59.9%)
ⓘ Screening estimate from a state-policy table — verify with the county assessor before closing.
Climate risk First Street
- Flood 1/10 Low FEMA zone X (unshaded) · 0% chance over 30 yrs
- Wildfire 4/10 Moderate
- Heat 6/10 Major 7 d/yr ≥108°F today · 19 d/yr by 30 yrs out
- Wind 2/10 Low 4% chance of damaging wind over 30 yrs
- Air quality 2/10 Low 2 unhealthy d/yr today · 2 by 30 yrs out
Nearby sold comps map
Loading sold comps map…
Walkable amenities ~0.75 mi
Loading nearby amenities…
Taxation est. · year 1
- Rental income
- $19,161
- − Mortgage interest
- −$11,819
- − Property taxes
- −$1,188
- − Insurance
- −$1,055
- − Repairs & maintenance
- −$1,533
- − Management
- −$1,533
- − Depreciation
- −$6,138
- Taxable loss
- −$4,105
- Est. tax savings @ 24.0%
- +$985
- After-tax cash flow
- $602/yr
For passive investors: Depreciation is non-cash, so a rental often shows a tax loss while cash-flowing — sheltering income. Rental losses are passive: they offset passive income freely, and up to $25,000/yr can offset ordinary (W-2) income if you actively participate and your MAGI is under $100k (phasing out to $0 by $150k); unused losses carry forward. On sale, claimed depreciation is recaptured at up to 25%, and gains may owe capital-gains tax (a 1031 exchange can defer both). Figures are a year-1 estimate at your 24.0% rate — not tax advice; consult a CPA.
Schools (NCES district)
- District
- Edmond
- NCES district ID
- 4010590
- Math proficiency
- 38% ▼ -12.00%
- Reading proficiency
- 40% ▼ -12.00%
- Median HH income
- $73,212
- Composite
- 35.88/100
- National rank
- #4814
- State rank
- #11 of 270 in OK
Livability — Edmond
- Score
- 78/100
- State rank
- #6
- US rank
- #2383
Category grades
Schools grade is shown separately in the Schools card above.
Census & demographics
- Census place
- Edmond, OK
- County
- Oklahoma County · 771,644 people
- City population
- 177,083
- Metro
- Oklahoma City, OK
- Population (ZIP)
- 23,236
- Household income
- $78,149
- Rent vs Own
- Severe rent burden
- 988.0
Population outlook (Oklahoma County) Hauer SSP2
- Today (2025)
- 911,875 people
- By 2030
- 982,413 · +7.7%
- By 2040
- 1,130,468 · +24.0%
- By 2050
- 1,288,422 · +41.3%
- By 2075
- 1,711,482 · +87.7%
- By 2100
- 2,088,448 · +129.0%
Race, ethnicity, and origin ACS 2023
- Neighborhood character
- Predominantly White (69%)
- Race & ethnicity
- White 69% Two or more races 13% Black 9% Hispanic / Latino 9% Asian 3%
- Hispanic origin (detail)
- Mexican 7%
- Common ancestry
- Italian 2% Slovak 2% Lithuanian 1%
- Foreign-born
- 8% · Canada, China
- Languages at home
- 90% English-only · Spanish 5% Other Indo-European 2% Chinese 1%
Political lean MEDSL · Oklahoma
- 2024 margin
- Toss-up / Even · D 48.0% · R 49.7% · Other 2.3%
- 2008→2024 swing
- +15.1pp toward D · 2008: -16.8pp · 2024: -1.7pp
- All cycles
- 2024: R+1.7 2020: R+1.1 2016: R+10.5 2012: R+16.7 2008: R+16.8
Not yet ingested
- Civics
- —
Market trends
- HPI YoY
- ▼ -104.15%
- Current HPI
- 229.3899
- Rent YoY
- ▲ 3.86%
- Metro
- Oklahoma City, OK
- State GDP YoY
- ▲ 1.55%
- F500 in state
- 6
Industry mix (Fortune 500 HQ in OK)
| Industry | F500 HQs | Revenue |
|---|---|---|
| Energy | 3 | $48B |
|
||
Price history
+313.7% since first listed5 events — show timeline
- 2026-04-13 Pending — MLSOK
- 2026-04-11 Listed $211,000 MLSOK
- 2004-01-27 Sold (Public Records) $74,000 Public Records
- 1987-08-27 Sold (Public Records) $52,000 Public Records
- 1982-09-01 Sold (Public Records) $51,000 Public Records
Property tax history
+0.8%/yrLatest (2025): $1,188 · +0.1% YoY. Source: county tax records.
Cash-flow waterfall
monthlySold comps — $/sqft
last 12 mo · ≤1 miLoading sold comps…