405 County Road 437 · Chelsea, AL
Flood risk 9/10 · Severe
- FEMA flood zone
- X (unshaded)
- Chance of flooding over 30 yrs
- 0.99%
- Est. flood insurance / yr
- $507 – $1,088
Fire risk 5/10 · Moderate
- Est. fire insurance / yr
- $916 – $1,700
Heat risk 6/10 · Moderate
- Hot days now (above 108°F)
- 7 days/yr
- Hot days in 30 yrs
- 19 days/yr
Wind risk 6/10 · Moderate
- Chance of severe wind over 30 yrs
- 27.0%
Air-quality risk 4/10 · Minor
- Unhealthy air days now
- 4 days/yr
- Unhealthy air days in 30 yrs
- 6 days/yr
Risk factors via First Street. Map © Google.
Why this score? — see what drove the C grade
The composite is a weighted blend of 9 inputs, each scored 0–100. Each bar is that input's sub-score; the figure is the points it added to the 100-point composite (weight × sub-score).
- Cash flow +16.0/30.0
- ARV discount +15.0/15.0
- Appreciation +5.3/10.0
- DSCR +4.9/10.0
- Schools +3.9/10.0
- Livability +3.5/5.0
- 1% rule +3.4/10.0
- Rent growth +2.5/5.0
- Condition / age +2.5/5.0
$249,000
🖨 Deal sheet (PDF) 📄 Offer letter ✓ Due diligence
Listing remarks MLS
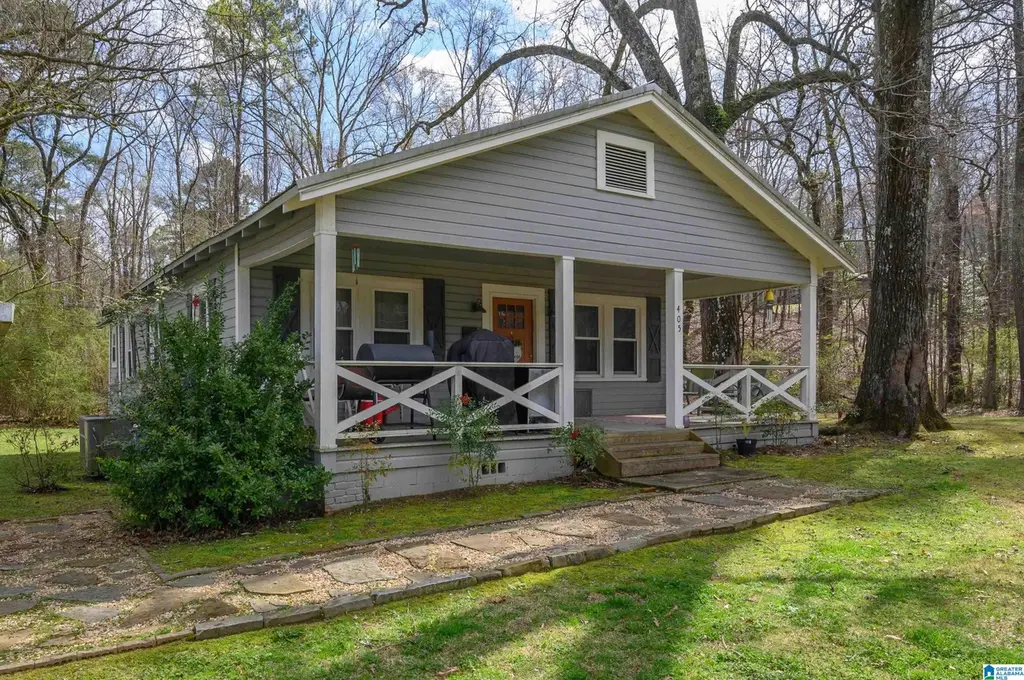
This 1940's bungalow is ready for her new owner! Nestled on a large, wooded lot. .. this home has a welcoming front porch, beautiful finishes, a cozy kitchen, and so much more!! Zoned for Chelsea schools and close to EVERYTHING! You will want to be sure that this home is on your list to see!!
Key facts
- 0.94 acre lot
- 2 parking spots
- Built 1940
Neighborhood map
What this means for you Summary
Snapshot
- This is a 3-bed/1.0-bath single-family listed at $249k.
Deal economics
- At list price, monthly cash flow is $56 ($676/yr) — positive.
- The deal already cash-flows at list — no discount required.
- To meet the 1% rule (rent ≥ 1% of price), the offer needs to be $210k (15.6% below list).
- Recommended offer: $210k (15.6% below list) — sets the bar for 1% rule.
- Cap rate 6.9% vs local median 4.1% in Chelsea — top-decile yield for the area; either an underpriced asset or a hidden risk that comps aren't pricing in. Stress-test before assuming the spread holds.
Location & tenants
- Location reads 69/100 on livability (#52 in AL) — a middle-class / working-renter tenant base. Strengths: crime A+, employment A+, housing A+; Watch: amenities F, commute F, health & safety F.
- Shelby County (suburban): math 30% / reading 58% proficiency, ranked #16 of 129 in AL (top 12%) — families likely to look elsewhere, expect single-tenant / working-renter base with shorter leases.
- Zoned schools: Chelsea Park Elementary School (math 46% / reading 68%, grade C+, #76 of 627 statewide, top 13%, 867 students, 31% FRL); Chelsea Middle School (math 26% / reading 63%, grade D, #39 of 257 statewide, top 16%, 951 students, 28% FRL); Chelsea High School (math 43% / reading 42%, grade F, #27 of 305 statewide, top 9%, 1,400 students, 23% FRL) — zoned schools at 27% FRL track the district average.
- Market conditions: 95 active listings in the ZIP; 4 comparable units currently listed for rent nearby; rentals leasing fast (median 14d on market — plan ~1-2 weeks tenant-placement turnaround); 987 units permitted in Shelby County in 2024 (0 in 5+ unit buildings).
Forward outlook
- In year one you build about $3k of equity ($2k loan paydown + $2k appreciation (0.7% local appreciation)).
- Shelby County population projected at +23% by 2050 — long-run rental-demand tailwind backs the buy-and-hold thesis.
- At projected returns (0.7% appreciation + 3.0% rent growth), your $70k cash investment doubles in ~10 years — after that, you're playing with house money.
- By year 9, paydown + projected appreciation supports a ~$33k cash-out refi (75% LTV) — recoverable capital for the next deal without selling this one.
Negotiation context
- It's been on market 97 days — a 9% lower offer ($227k) is reasonable based on typical stale-listing flexibility.
Risks & watch-outs
- Watch-outs: flood insurance adds $66/mo; built in 1940 — expect roof / HVAC / electrical / plumbing capex.
- Climate carrying-cost: severe flood risk; major wind risk, 27% chance of damaging wind over 30y; moderate wildfire risk; extreme-heat days projected 7→19/yr by 2055 (HVAC capex compounding) — expect insurance premiums to compound above CPI over the hold.
Questions for the listing agent
- It's been on market 97 days. Have you received any prior offers? Is the seller open to a 16% concession, seller financing, or rate buy-down credit?
- Built in 1940 — when were the roof, HVAC, electrical panel, plumbing, and water heater last replaced?
- What's the actual annual flood-insurance premium (NFIP or private), and is the property in a SFHA with mandatory coverage?
- Why hasn't it sold? Are there any deal-killer items the seller is aware of (foundation, flood, title, zoning, code violations)?
- Is there a deadline driving the sale (1031 exchange, divorce, estate, relocation)? That informs how much negotiation room exists.
- Schools are B-rated — typically a magnet for longer-tenancy family renters. What's the average tenant stay here, and is there a school-zone premium baked into asking?
- What's the average days-on-market for RENTAL listings here right now (not sales)? A rising rental-DOM trend means longer vacancies and softer asking-rent achievability than the comps imply.
- What's the recent tenant-quality profile in this submarket — average credit score on applications, eviction rate, late-payment / NSF rate, and stable-employment percentage? A property-management company in the area should have these aggregated.
- How much new for-sale + rental construction is in the pipeline within 1–3 miles? Heavy new supply typically softens prices + rents 12–24 months out; constrained supply supports both.
Investment metrics
- 1% rule
- 0.84% ✗
- Cap rate
- 6.88%
- Cash-on-cash
- 2.11%
- DSCR
- 1.09
- GRM
- 9.9
CMA / ARV
- ARV (median comp)
- $311,805
- List price
- $249,000
- Delta
- -20.14%
- Verdict
- UNDERPRICED
- Comps
- 20 within 1.0 mi
Show comp detail 4 sales within ~0.75 mi
| Address | Dist | Beds/Ba | Sqft | Sold | Price | $/sf | Match |
|---|---|---|---|---|---|---|---|
| 301 Willoughby Rd | 0.49mi | 3/2.0 | 1,376 (+8%) | 2mo | $287,900 | $209 | 59 |
| 297 Willoughby Rd | 0.49mi | 3/2.0 | 1,376 (+8%) | 3mo | $289,900 | $211 | 58 |
| 288 Willoughby Rd | 0.49mi | 3/2.0 | 1,376 (+8%) | 4mo | $287,400 | $209 | 57 |
| 281 Willoughby Rd | 0.47mi | 3/2.0 | 1,376 (+8%) | 7mo | $295,400 | $215 | 55 |
Match score weights: distance 35% · size 25% · config 20% · recency 20%. Top-matched comps best support the ARV.
Projected returns pro-forma
0.7% appreciation · 3.0% rent growth · sell at horizon
- IRR
- 1.3%
- Equity multiple
- 1.06×
- Total profit
- $4,527
- Equity at exit
- $81,094
- IRR
- 6.2%
- Equity multiple
- 1.73×
- Total profit
- $50,688
- Equity at exit
- $104,804
Cash invested: $69,720 (down + closing). Projections, not guarantees.
Landlord ↔ Tenant lean methodology
- Overall (STATE)
- 90 Strongly Landlord-Friendly
- State Alabama
- 90 Strongly Landlord-Friendly · R+15
- County
- — inherits STATE
- City
- — inherits STATE
ZIP-level market 35147
- Home prices YoY
- 0.3%
- Active inventory
- 95
- Price-to-rent
- 9.9×
Monthly cashflow live
- Estimated rent
- $2,102 medium interval (Pro) →
- Mortgage (P&I)
- −$1,306
- Tax from tax record
- −$129 /mo · $1,544/yr
- Insurance
- −$104
- Flood insurance flood zone
- −$66 /mo · $798/yr
- HOA
- −$0
- Vacancy / Maint / Mgmt
- −$442
- Net cashflow
- $56
Break-even live
Sensitivity live
| Price | -10% $197 | -5% $127 | +0% $56 | +5% $-14 | +10% $-85 |
|---|---|---|---|---|---|
| Rent | -10% $-110 | -5% $-27 | +0% $56 | +5% $139 | +10% $222 |
| Rate | -1.0pp $182 | -0.5pp $120 | base $56 | +0.5pp $-8 | +1.0pp $-74 |
UW: 25.0% down · 7.5% · 30yr · 1.5% tax · 5.0% vac · 8.0% maint · 8.0% mgmt
Financing live
Cash to close
- Down payment
- $62,250
- Closing costs
- $7,470
- Reserves months
- —
- Total cash needed
- —
Loan-product check · same deal, 3 products live
Conventional
25% down · 7.5% · 30yr
- Down + closing
- —
- Monthly P&I
- —
- Monthly cashflow
- —
- DSCR
- —
- Eligible?
- —
Personal DTI + credit; lowest rate.
DSCR
20% down · 8.5% · 30yr
- Down + closing
- —
- Monthly P&I
- —
- Monthly cashflow
- —
- DSCR
- —
- Eligible?
- —
No personal income docs; deal must DSCR.
Hard money
10% down · 12.0% · 12mo
- Down + closing
- —
- Monthly P&I
- —
- Monthly cashflow
- —
- DSCR
- —
- Eligible?
- —
Short-term bridge; refi at stabilization.
Rent comps 4 comps
| Address | Beds | Baths | Sqft | Rent | $/sqft | DOM | Units | Dist |
|---|---|---|---|---|---|---|---|---|
| 173 Chelsea Park Rd Chelsea, AL | 3.0 | 2.0 | 1694 | $2,070 | $1.22 | 5d | 1 | 0.69mi |
| 464 Crossbridge Rd Chelsea, AL | 4.0 | 2.5 | 1858 | $2,175 | $1.17 | 13d | 1 | 0.74mi |
| 224 Park Crest Run Chelsea, AL | 4.0 | 2.0 | 1774 | $2,195 | $1.24 | 5d | 1 | 0.92mi |
| 170 Sharpe St Sterrett, AL | 3.0 | 2.0 | 1408 | $1,935 | $1.37 | 45d | 1 | 1.46mi |
Listing history 20 events
-
2026-06-21days on market $249,000 Active 97 DOM
-
2026-06-18days on market $249,000 Active 94 DOM
-
2026-06-17days on market $249,000 Active 93 DOM
-
2026-06-16days on market $249,000 Active 92 DOM
-
2026-06-15days on market $249,000 Active 91 DOM
-
2026-06-13days on market $249,000 Active 89 DOM
-
2026-06-13days on market $249,000 Active 88 DOM
-
2026-06-10days on market $249,000 Active 86 DOM
-
2026-06-09days on market $249,000 Active 85 DOM
-
2026-06-08days on market $249,000 Active 84 DOM
-
2026-06-07days on market $249,000 Active 83 DOM
-
2026-06-05days on market $249,000 Active 80 DOM
-
2026-06-03days on market $249,000 Active 79 DOM
-
2026-06-02days on market $249,000 Active 78 DOM
-
2026-06-01days on market $249,000 Active 77 DOM
-
2026-05-31days on market $249,000 Active 76 DOM
-
2026-03-16$249,000 Active 296-char remark
Show marketing remark (296 chars)
This 1940's bungalow is ready for her new owner! Nestled on a large, wooded lot. .. this home has a welcoming front porch, beautiful finishes, a cozy kitchen, and so much more!! Zoned for Chelsea schools and close to EVERYTHING! You will want to be sure that this home is on your list to see!!
-
2026-03-04historical $249,000 296-char remark
Show marketing remark (296 chars)
This 1940's bungalow is ready for her new owner! Nestled on a large, wooded lot. .. this home has a welcoming front porch, beautiful finishes, a cozy kitchen, and so much more!! Zoned for Chelsea schools and close to EVERYTHING! You will want to be sure that this home is on your list to see!!
-
2021-09-02soldstatus $235,000
-
2008-06-04soldstatus $72,000
ⓘ Source: listings_history table (triggers on properties + properties_extension) + one-shot
backfill from property_details.listing_events for pre-trigger history.
Tax reassessment forecast AL · Resets to sale price
- Current annual tax
- $1,544 · $129/mo
- Projected year-2 tax
- $1,544 · $129/mo
- Expected delta
- $0/yr ($0/mo · 0.0%)
ⓘ Screening estimate from a state-policy table — verify with the county assessor before closing.
Climate risk First Street
- Flood 9/10 Extreme FEMA zone X (unshaded) · 99% chance over 30 yrs
- Wildfire 5/10 Major
- Heat 6/10 Major 7 d/yr ≥108°F today · 19 d/yr by 30 yrs out
- Wind 6/10 Major 27% chance of damaging wind over 30 yrs
- Air quality 4/10 Moderate 4 unhealthy d/yr today · 6 by 30 yrs out
Nearby sold comps map
Loading sold comps map…
Walkable amenities ~0.75 mi
Loading nearby amenities…
Taxation est. · year 1
- Rental income
- $25,229
- − Mortgage interest
- −$13,948
- − Property taxes
- −$1,544
- − Insurance
- −$2,042
- − Repairs & maintenance
- −$2,018
- − Management
- −$2,018
- − Depreciation
- −$7,244
- Taxable loss
- −$3,585
- Est. tax savings @ 24.0%
- +$860
- After-tax cash flow
- $1,536/yr
For passive investors: Depreciation is non-cash, so a rental often shows a tax loss while cash-flowing — sheltering income. Rental losses are passive: they offset passive income freely, and up to $25,000/yr can offset ordinary (W-2) income if you actively participate and your MAGI is under $100k (phasing out to $0 by $150k); unused losses carry forward. On sale, claimed depreciation is recaptured at up to 25%, and gains may owe capital-gains tax (a 1031 exchange can defer both). Figures are a year-1 estimate at your 24.0% rate — not tax advice; consult a CPA.
Schools (NCES district)
- District
- Shelby County
- NCES district ID
- 0103030
- Math proficiency
- 30% ▼ -28.00%
- Reading proficiency
- 58% ▲ 2.00%
- Median HH income
- $66,672
- Composite
- 39.29/100
- National rank
- #3995
- State rank
- #16 of 129 in AL
Livability — Chelsea
- Score
- 69/100
- State rank
- #52
- US rank
- #8363
Category grades
Schools grade is shown separately in the Schools card above.
Census & demographics
- Census place
- Chelsea, AL
- City population
- 15,068
- Population (ZIP)
- 6,971
Population outlook (Shelby County) Hauer SSP2
- Today (2025)
- 237,024 people
- By 2030
- 249,868 · +5.4%
- By 2040
- 272,778 · +15.1%
- By 2050
- 291,062 · +22.8%
- By 2075
- 326,049 · +37.6%
- By 2100
- 335,870 · +41.7%
Race, ethnicity, and origin ACS 2023
- Neighborhood character
- Predominantly White (76%)
- Race & ethnicity
- White 76% Hispanic / Latino 10% Black 10% Two or more races 10%
- Hispanic origin (detail)
- Mexican 6%
- Common ancestry
- Serbian 3% Slovak 1% Lithuanian 1%
- Foreign-born
- 4% · Canada
- Languages at home
- 90% English-only · Spanish 9%
Political lean MEDSL · Shelby
- 2024 margin
- Solid R (+40.9) · D 29.0% · R 69.9% · Other 1.1%
- 2008→2024 swing
- +12.6pp toward D · 2008: -53.4pp · 2024: -40.9pp
- All cycles
- 2024: R+40.9 2020: R+40.4 2016: R+50.3 2012: R+55.6 2008: R+53.4
Not yet ingested
- Civics
- —
Market trends
- HPI YoY
- ▲ 0.70%
- Current HPI
- 200.0103
- Rent YoY
- —
- Metro
- —
- State GDP YoY
- ▲ 2.94%
- F500 in state
- 4
Industry mix (Fortune 500 HQ in AL)
| Industry | F500 HQs | Revenue |
|---|---|---|
| Financial Services | 1 | $8B |
|
||
| Healthcare | 1 | $5B |
|
||
Price history
+245.8% since first listed4 events — show timeline
- 2026-03-16 Listed $249,000 Greater Alabama MLS
- 2026-03-04 Coming Soon $249,000 Greater Alabama MLS
- 2021-09-02 Sold (Public Records) $235,000 Public Records
- 2008-06-04 Sold (Public Records) $72,000 Public Records
Property tax history
+8.6%/yrLatest (2025): $1,544 · +1.3% YoY. Source: county tax records.
Cash-flow waterfall
monthlySold comps — $/sqft
last 12 mo · ≤1 miLoading sold comps…