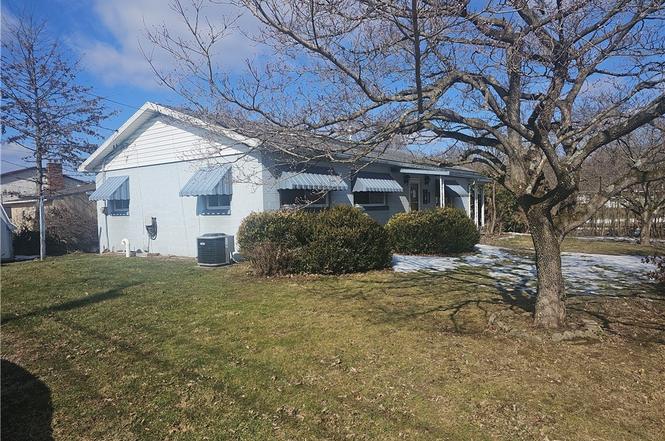
43 Third St · Waverly, WV
Flood risk 9/10 · Severe
- FEMA flood zone
- X (shaded)
- Chance of flooding over 30 yrs
- 0.99%
- Est. flood insurance / yr
- $473 – $860
Fire risk 4/10 · Minor
- Est. fire insurance / yr
- $787 – $1,461
Heat risk 5/10 · Moderate
- Hot days now (above 99°F)
- 7 days/yr
- Hot days in 30 yrs
- 19 days/yr
Wind risk 2/10 · Minimal
- Chance of severe wind over 30 yrs
- 1.0%
Air-quality risk 2/10 · Minimal
- Unhealthy air days now
- 1 days/yr
- Unhealthy air days in 30 yrs
- 2 days/yr
Risk factors via First Street. Map © Google.
Why this score? — see what drove the C grade
The composite is a weighted blend of 9 inputs, each scored 0–100. Each bar is that input's sub-score; the figure is the points it added to the 100-point composite (weight × sub-score).
- Cash flow +23.1/30.0
- DSCR +7.4/10.0
- Appreciation +6.4/10.0
- ARV discount +5.6/15.0
- 1% rule +4.9/10.0
- Schools +3.6/10.0
- Livability +3.0/5.0
- Rent growth +2.5/5.0
- Condition / age +2.5/5.0
$97,500
🖨 Deal sheet 📄 Offer letter ✓ Due diligence
Listing remarks
THREE BEDROOM, 2 BATH ONE STORY VINTAGE HOME WITH FULL BASEMENT. FLAT, CORNER LOT. CARPORT WITH STORAGE BUILDING AND SEPERATE SHED FOR STORAGE. All Pre-1978 properties must include LBP. Property is owned by the US Dept. of HUD. Case #571-143110. FHA Insured Escrow (IN) Subject to Appraisal. Seller may contribute up to 3% of buyer’s closing cost. Seller makes no representations or warranties as to property condition. HUD Homes are sold “AS-IS. " Equal Housing Opportunity. Seller may contribute up to 3% for buyer’s closing costs, upon bid submission. All Showing Agents must sign in at the property for EVERY showing.
Key facts
- Full basement
- Flat corner lot
- Carport with storage
Tags
Property features AI
Exterior
- Parking: Carport
- Utilities: Public water; Public sewer
- Home design: Single-family residence; Residential property; 1 story
- Construction: Block construction; Composition shingle roof
- Exterior features: Porch; Storage
Interior
- Kitchen: Electric range; Refrigerator
- Flooring: Carpet; Hardwood; Vinyl
- Bathrooms: 1 full bathroom
- Heating & cooling: Forced air heating; Central air conditioning
- Interior features: Insulated windows; Full basement with sump pump; 6 total rooms; Storage
Neighborhood map
What this means for you Summary
Snapshot
- This is a 3-bed/1.0-bath single-family listed at $98k.
Deal economics
- At list price, monthly cash flow is $119 ($1k/yr) — positive.
- The deal already cash-flows at list — no discount required.
- To meet the 1% rule (rent ≥ 1% of price), the offer needs to be $97k (0.9% below list).
- Recommended offer: $92k (6.0% below list) — sets the bar for market timing.
Location & tenants
- Location reads 59/100 on livability (#230 in WV) — a working-class tenant base; expect higher turnover. Strengths: cost of living A+, crime A, employment A; Watch: health & safety D, amenities F, commute F.
- Wood County Schools (urban): math 38% / reading 48% proficiency, ranked #3 of 55 in WV (top 6%) — families likely to look elsewhere, expect single-tenant / working-renter base with shorter leases.
- Zoned schools: Williamstown Elementary School (math 59% / reading 61%, grade B-, #14 of 377 statewide, top 3%, 553 students, 0% FRL); Williamstown High School (math 45% / reading 60%, grade C-, #5 of 110 statewide, top 4%, 671 students, 0% FRL) — zoned schools average 0% FRL vs 47% district-wide (47 pts lower); this property's tenant base skews higher-income than the district average.
- Zoned-school proficiency averages 56% at this address vs 43% district-wide (+13 pts) — the actual schools serving this property are materially stronger than the Wood County Schools average implies; a family-tenant draw the district grade alone would hide.
- Market conditions: 4 active listings in the ZIP; 124 units permitted in Wood County in 2024 (33 in 5+ unit buildings).
Forward outlook
- In year one you build about $3k of equity ($674 loan paydown + $3k appreciation (2.8% local appreciation)).
- Wood County population projected at -13% by 2050 — secular population decline; favor cash flow + early exit over multi-decade hold.
- At projected returns (2.8% appreciation + 3.0% rent growth), your $27k cash investment doubles in ~5 years — after that, you're playing with house money.
- By year 10, paydown + projected appreciation supports a ~$33k cash-out refi (75% LTV) — recoverable capital for the next deal without selling this one.
Negotiation context
- It's been on market 86 days — a 6% lower offer ($92k) is reasonable based on typical stale-listing flexibility.
- 2 sale attempts since 10y ago; this cycle's ask has dropped $10k (10%) from the opening price — seller is motivated, your offer sets the floor, not the list.
- Current owner paid $80k; 22% above their basis — modest negotiation headroom, anchor on the comps not their cost.
Risks & watch-outs
- Watch-outs: flood insurance adds $56/mo; built in 1959 — expect roof / HVAC / electrical / plumbing capex.
Questions for the listing agent
- It's been on market 86 days. Have you received any prior offers? Is the seller open to a 6% concession, seller financing, or rate buy-down credit?
- Built in 1959 — when were the roof, HVAC, electrical panel, plumbing, and water heater last replaced?
- What's the actual annual flood-insurance premium (NFIP or private), and is the property in a SFHA with mandatory coverage?
- Why hasn't it sold? Are there any deal-killer items the seller is aware of (foundation, flood, title, zoning, code violations)?
- Is there a deadline driving the sale (1031 exchange, divorce, estate, relocation)? That informs how much negotiation room exists.
- Schools are F-rated, which usually means shorter tenancies and higher turnover. Who's the typical renter profile here, and what's been the actual vacancy rate?
- What's the average days-on-market for RENTAL listings here right now (not sales)? A rising rental-DOM trend means longer vacancies and softer asking-rent achievability than the comps imply.
- What's the recent tenant-quality profile in this submarket — average credit score on applications, eviction rate, late-payment / NSF rate, and stable-employment percentage? A property-management company in the area should have these aggregated.
- How much new for-sale + rental construction is in the pipeline within 1–3 miles? Heavy new supply typically softens prices + rents 12–24 months out; constrained supply supports both.
Investment metrics
- 1% rule
- 0.99% ✗
- Cap rate
- 8.44%
- Cash-on-cash
- 7.69%
- DSCR
- 1.34
- GRM
- 8.4
CMA / ARV
- ARV (on-the-fly)
- $93,600
- Comps found
- 1
Show comp detail 1 sale within ~0.75 mi
| Address | Dist | Beds/Ba | Sqft | Sold | Price | $/sf | Match |
|---|---|---|---|---|---|---|---|
| 43 Third St | 0.00mi | 3/1.0 | 1,040 (0%) | 0mo | $93,500 | $90 | 100 |
Match score weights: distance 35% · size 25% · config 20% · recency 20%. Top-matched comps best support the ARV.
Projected returns pro-forma
2.82% appreciation · 3.0% rent growth · sell at horizon
- IRR
- 11.9%
- Equity multiple
- 1.68×
- Total profit
- $18,428
- Equity at exit
- $42,869
- IRR
- 14.1%
- Equity multiple
- 3.06×
- Total profit
- $56,104
- Equity at exit
- $65,321
Cash invested: $27,300 (down + closing). Projections, not guarantees.
Landlord ↔ Tenant lean methodology
- Overall (STATE)
- 83 Strongly Landlord-Friendly
- State West Virginia
- 83 Strongly Landlord-Friendly · R+22
- County
- — inherits STATE
- City
- — inherits STATE
ZIP-level market 26184
- Home prices YoY
- 1.9%
- Active inventory
- 4
- Price-to-rent
- 8.4×
Monthly cashflow live
- Estimated rent
- $967 medium interval (Pro) →
- Mortgage (P&I)
- −$511
- Tax from tax record
- −$37 /mo · $443/yr
- Insurance
- −$41
- Flood insurance flood zone
- −$56 /mo · $666/yr
- HOA
- −$0
- Vacancy / Maint / Mgmt
- −$203
- Net cashflow
- $119
Break-even live
UW: 25.0% down · 7.5% · 30yr · 1.5% tax · 5.0% vac · 8.0% maint · 8.0% mgmt
Financing live
Cash to close
- Down payment
- $24,375
- Closing costs
- $2,925
- Reserves months
- —
- Total cash needed
- —
Loan-product check · same deal, 3 products live
Conventional
25% down · 7.5% · 30yr
- Down + closing
- —
- Monthly P&I
- —
- Monthly cashflow
- —
- DSCR
- —
- Eligible?
- —
Personal DTI + credit; lowest rate.
DSCR
20% down · 8.5% · 30yr
- Down + closing
- —
- Monthly P&I
- —
- Monthly cashflow
- —
- DSCR
- —
- Eligible?
- —
No personal income docs; deal must DSCR.
Hard money
10% down · 12.0% · 12mo
- Down + closing
- —
- Monthly P&I
- —
- Monthly cashflow
- —
- DSCR
- —
- Eligible?
- —
Short-term bridge; refi at stabilization.
Listing history 6 events
-
2026-05-11status Pending
-
2026-04-06price $97,500
-
2026-02-15$108,000 Active
-
2017-08-08soldstatus $80,000
-
2016-06-01historical
-
2016-01-12$95,000
ⓘ Source: listings_history table (triggers on properties + properties_extension) + one-shot
backfill from property_details.listing_events for pre-trigger history.
Tax reassessment forecast WV · Resets to sale price
- Current annual tax
- $443 · $37/mo
- Projected year-2 tax
- $575 · $48/mo
- Expected delta
- +$132/yr (+$11/mo · 29.9%)
ⓘ Screening estimate from a state-policy table — verify with the county assessor before closing.
Climate risk First Street
- Flood 9/10 Extreme FEMA zone X (shaded) · 99% chance over 30 yrs
- Wildfire 4/10 Moderate
- Heat 5/10 Major 7 d/yr ≥99°F today · 19 d/yr by 30 yrs out
- Wind 2/10 Low 100% chance of damaging wind over 30 yrs
- Air quality 2/10 Low 1 unhealthy d/yr today · 2 by 30 yrs out
Nearby sold comps map
Loading sold comps map…
Walkable amenities ~0.75 mi
Loading nearby amenities…
Taxation est. · year 1
- Rental income
- $11,600
- − Mortgage interest
- −$5,462
- − Property taxes
- −$443
- − Insurance
- −$1,154
- − Repairs & maintenance
- −$928
- − Management
- −$928
- − Depreciation
- −$2,836
- Taxable loss
- −$151
- Est. tax savings @ 24.0%
- +$36
- After-tax cash flow
- $1,468/yr
For passive investors: Depreciation is non-cash, so a rental often shows a tax loss while cash-flowing — sheltering income. Rental losses are passive: they offset passive income freely, and up to $25,000/yr can offset ordinary (W-2) income if you actively participate and your MAGI is under $100k (phasing out to $0 by $150k); unused losses carry forward. On sale, claimed depreciation is recaptured at up to 25%, and gains may owe capital-gains tax (a 1031 exchange can defer both). Figures are a year-1 estimate at your 24.0% rate — not tax advice; consult a CPA.
Schools (NCES district)
- District
- Wood County Schools
- NCES district ID
- 5401620
- Math proficiency
- 38% ▼ -10.00%
- Reading proficiency
- 48% ▼ -4.00%
- Median HH income
- $42,363
- Composite
- 36.22/100
- National rank
- #4728
- State rank
- #3 of 55 in WV
Livability — Waverly
- Score
- 59/100
- State rank
- #230
- US rank
- #20220
Category grades
Schools grade is shown separately in the Schools card above.
Census & demographics
- Census place
- Waverly, WV
- Population (ZIP)
- 2,328
Population outlook (Wood County) Hauer SSP2
- Today (2025)
- 84,304 people
- By 2030
- 82,420 · -2.2%
- By 2040
- 78,133 · -7.3%
- By 2050
- 73,639 · -12.7%
- By 2075
- 63,093 · -25.2%
- By 2100
- 50,461 · -40.1%
Race, ethnicity, and origin ACS 2023
- Neighborhood character
- Predominantly White (97%)
- Race & ethnicity
- White 97% Two or more races 2% Black 1%
- Common ancestry
- Serbian 2% Slovak 1% Lithuanian 1%
- Foreign-born
- 1% · Canada
- Languages at home
- 99% English-only · French/Haitian/Cajun 1%
Political lean MEDSL · Wood
- 2024 margin
- Solid R (+43.0) · D 27.6% · R 70.7% · Other 1.6%
- 2008→2024 swing
- -14.4pp toward R · 2008: -28.7pp · 2024: -43.0pp
- All cycles
- 2024: R+43.0 2020: R+42.0 2016: R+47.8 2012: R+32.5 2008: R+28.7
Not yet ingested
- Civics
- —
Market trends
- HPI YoY
- ▲ 2.82%
- Current HPI
- 148.7087
- Rent YoY
- —
- Metro
- —
- State GDP YoY
- —
- F500 in state
- 0
Price history
+2.6% since first listed6 events — show timeline
- 2026-05-11 Pending — KVBOR
- 2026-04-06 Price Changed $97,500 KVBOR
- 2026-02-15 Listed $108,000 KVBOR
- 2017-08-08 Sold (Public Records) $80,000 Public Records
- 2016-06-01 Listing Removed — MLSNOW
- 2016-01-12 Listed $95,000 MLSNOW
Property tax history
+23.1%/yrLatest (2025): $443 · +150.5% YoY. Source: county tax records.
Cash-flow waterfall
monthlySold comps — $/sqft
last 12 mo · ≤1 miLoading sold comps…