211 Jordan St · Claremore, OK
Flood risk No data
- FEMA flood zone
- —
- Chance of flooding over 30 yrs
- —
- Est. flood insurance / yr
- —
Fire risk No data
- Est. fire insurance / yr
- —
Heat risk No data
- Hot days now (above threshold)
- —
- Hot days in 30 yrs
- —
Wind risk No data
- Chance of severe wind over 30 yrs
- —
Air-quality risk No data
- Unhealthy air days now
- —
- Unhealthy air days in 30 yrs
- —
Risk factors via First Street. Map © Google.
Why this score? — see what drove the C- grade
The composite is a weighted blend of 9 inputs, each scored 0–100. Each bar is that input's sub-score; the figure is the points it added to the 100-point composite (weight × sub-score).
- Cash flow +22.9/30.0
- ARV discount +7.5/15.0
- DSCR +7.4/10.0
- 1% rule +5.0/10.0
- Livability +3.7/5.0
- Rent growth +3.2/5.0
- Condition / age +2.5/5.0
- Schools +2.1/10.0
- Appreciation +0.0/10.0
$100,000
🖨 Deal sheet 📄 Offer letter ✓ Due diligence
Listing remarks
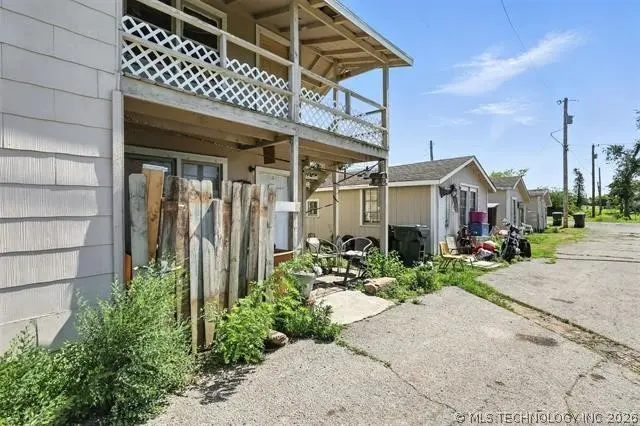
Two lots and Two buildings, one duplex and one cottage, investment opportunity just moments from the vibrant heart of downtown Claremore! This unique offering includes two lots in an approved pattern zone RS-3, providing endless potential for development or expansion. Currently, the property generates reliable rental income, come house hack and have other's pay for overhead. This listing is being sold with 507 S Maryland (two more cottages and adjacent lot 1, MLS: 2618919) as a package deal. All offers should be for both parcels. Appraisal is done and shows package aprox $75k below valuation, giving you peace of mind.
Key facts
- Two lots
- Cottage
- Two buildings
Tags
Property features AI
Exterior
- Security: No safety shelter
- Utilities: Electricity available; Fiber optic available; Natural gas available; Phone available; Public water; Public sewer
- Home design: Single-story; Faces south; Crawlspace and slab foundation
- Construction: Wood siding; Wood frame construction
- Exterior features: Covered porch; Porch; No other exterior features listed; Additional land available
Interior
- Kitchen: Oven; Range; Refrigerator
- Flooring: Carpet; Vinyl
- Bathrooms: 3 full bathrooms
- Heating & cooling: Gas heating; Space heater; Window unit cooling
- Interior features: Aluminum window frames; Laminate counters; Gas range connection; Gas oven connection; No additional interior features listed
Neighborhood map
What this means for you Summary
Snapshot
- This is a 1-bed/1.0-bath townhouse listed at $100k.
Deal economics
- At list price, monthly cash flow is $176 ($2k/yr) — positive.
- The deal already cash-flows at list — no discount required.
- Meets the 1% rule at list price ($1k rent vs $100k).
- Cap rate 8.4% vs local median 4.1% in Claremore — top-decile yield for the area; either an underpriced asset or a hidden risk that comps aren't pricing in. Stress-test before assuming the spread holds.
Location & tenants
- Location reads 73/100 on livability (#20 in OK) — a middle-class / working-renter tenant base. Strengths: cost of living A+, housing A+, health & safety A; Watch: schools D, amenities F, commute F.
- Claremore (town): math 24% / reading 25% proficiency, ranked #111 of 270 in OK (top 41%) — low school quality limits family demand, transient renter base, plan for 1-2y turnover.
- Market conditions: Rents rising (+2.6%/yr); 181 active listings in the ZIP; 13 comparable units currently listed for rent nearby; rentals leasing fast (median 10d on market — plan ~1-2 weeks tenant-placement turnaround); 608 units permitted in Rogers County in 2024 (7 in 5+ unit buildings).
Forward outlook
- Local home prices are declining (-3.0%/yr); year-one equity from $691 of loan paydown is wiped out by about $3k of value loss. Plan a longer hold.
- Rogers County population projected at +16% by 2050 — long-run rental-demand tailwind backs the buy-and-hold thesis.
Negotiation context
- Only 12 days on market — expect competitive offers; lowballing is unlikely to land.
- 4 sale attempts since 21y ago with the ask held roughly flat each time — persistent listings suggest the price (not the market) is what's stuck; bring a comps-based counter.
- Current owner paid $50k; list at $100k implies a 100% gain — meaningful room to come down on a strong offer.
Risks & watch-outs
- Watch-outs: built in 1928 — expect roof / HVAC / electrical / plumbing capex.
Questions for the listing agent
- Built in 1928 — when were the roof, HVAC, electrical panel, plumbing, and water heater last replaced?
- Is there a deadline driving the sale (1031 exchange, divorce, estate, relocation)? That informs how much negotiation room exists.
- Schools are D-rated, which usually means shorter tenancies and higher turnover. Who's the typical renter profile here, and what's been the actual vacancy rate?
- What's the average days-on-market for RENTAL listings here right now (not sales)? A rising rental-DOM trend means longer vacancies and softer asking-rent achievability than the comps imply.
- What's the recent tenant-quality profile in this submarket — average credit score on applications, eviction rate, late-payment / NSF rate, and stable-employment percentage? A property-management company in the area should have these aggregated.
- How much new for-sale + rental construction is in the pipeline within 1–3 miles? Heavy new supply typically softens prices + rents 12–24 months out; constrained supply supports both.
Investment metrics
- 1% rule
- 1.00% ✓
- Cap rate
- 8.40%
- Cash-on-cash
- 7.54%
- DSCR
- 1.34
- GRM
- 8.3
CMA / ARV
No comps found within radius.
Projected returns pro-forma
-3.0% appreciation · 2.62% rent growth · sell at horizon
- IRR
- -5.2%
- Equity multiple
- 0.81×
- Total profit
- $-5,416
- Equity at exit
- $14,910
- IRR
- 4.0%
- Equity multiple
- 1.29×
- Total profit
- $8,028
- Equity at exit
- $8,646
Cash invested: $28,000 (down + closing). Projections, not guarantees.
Landlord ↔ Tenant lean methodology
- Overall (STATE)
- 83 Strongly Landlord-Friendly
- State Oklahoma
- 83 Strongly Landlord-Friendly · R+20
- County
- — inherits STATE
- City
- — inherits STATE
ZIP-level market 74017
- Home prices YoY
- -20.1%
- Rents YoY
- 2.6%
- Active inventory
- 181
- Price-to-rent
- 8.3×
Monthly cashflow live
- Estimated rent
- $1,004 high interval (Pro) →
- Mortgage (P&I)
- −$524
- Tax from tax record
- −$51 /mo · $615/yr
- Insurance
- −$42
- HOA
- −$0
- Vacancy / Maint / Mgmt
- −$211
- Net cashflow
- $176
Break-even live
UW: 25.0% down · 7.5% · 30yr · 1.5% tax · 5.0% vac · 8.0% maint · 8.0% mgmt
Financing live
Cash to close
- Down payment
- $25,000
- Closing costs
- $3,000
- Reserves months
- —
- Total cash needed
- —
Loan-product check · same deal, 3 products live
Conventional
25% down · 7.5% · 30yr
- Down + closing
- —
- Monthly P&I
- —
- Monthly cashflow
- —
- DSCR
- —
- Eligible?
- —
Personal DTI + credit; lowest rate.
DSCR
20% down · 8.5% · 30yr
- Down + closing
- —
- Monthly P&I
- —
- Monthly cashflow
- —
- DSCR
- —
- Eligible?
- —
No personal income docs; deal must DSCR.
Hard money
10% down · 12.0% · 12mo
- Down + closing
- —
- Monthly P&I
- —
- Monthly cashflow
- —
- DSCR
- —
- Eligible?
- —
Short-term bridge; refi at stabilization.
Rent comps 13 comps
| Address | Beds | Baths | Sqft | Rent | $/sqft | DOM | Units | Dist |
|---|---|---|---|---|---|---|---|---|
| 317 E Will Rogers Blvd Claremore, OK | 2.0 | 2.0 | 996 | $1,475 | $1.48 | 10d | 1 | 0.39mi |
| 318 E Will Rogers Blvd Claremore, OK | 2.0 | 1.0 | 1028 | $1,300 | $1.26 | 10d | 1 | 0.42mi |
| 1222 W Brooks St Unit A Claremore, OK | 2.0 | 1.0 | 850 | $1,275 | $1.50 | 1d | 1 | 0.70mi |
| 1208 W Haskell St Unit F Claremore, OK | 1.0 | 1.0 | 500 | $700 | $1.40 | 1d | 1 | 0.73mi |
| 401 S Davis Ave Unit 403 Claremore, OK | 1.0 | 1.0 | — | $850 | — | 1d | 1 | 0.86mi |
| 2000 Hilltop Ln Claremore, OK | 2.0 | 1.5 | 972 | $1,000 | $1.03 | 1d | 1 | 1.20mi |
| 644 Earthside Dr Apt B Claremore, OK | 2.0 | 1.5 | 950 | $900 | $0.95 | 10d | 1 | 1.21mi |
| 1390 W Blue Starr Dr Unit B102 Claremore, OK | — | 1.0 | 512 | $849 | $1.66 | 10d | 1 | 1.22mi |
| 1390 W Blue Starr Dr Unit B115 Claremore, OK | 1.0 | 1.0 | 670 | $949 | $1.42 | 10d | 1 | 1.22mi |
| 1390 W Blue Starr Dr Unit A208 Claremore, OK | — | 1.0 | 474 | $769 | $1.62 | 14d | 1 | 1.22mi |
| 22350 S 4150 Rd Unit L 103 Claremore, OK | 2.0 | 1.0 | 821 | $875 | $1.07 | 10d | 1 | 1.28mi |
| 22350 S 4150 Rd Apt G101 Claremore, OK | 1.0 | 1.0 | 640 | $900 | $1.41 | 1d | 1 | 1.28mi |
| 22350 S 4150 Rd Apt H104 Claremore, OK | 2.0 | 1.0 | 821 | $1,025 | $1.25 | 1d | 1 | 1.28mi |
Listing history 24 events
-
2026-06-03days on market $100,000 Active 12 DOM
-
2026-06-02days on market $100,000 Active 11 DOM
-
2026-06-01days on market $100,000 Active 10 DOM
-
2026-05-31days on market $100,000 Active 9 DOM
-
2026-05-22$100,000 Active
-
2025-11-06historical
-
2025-10-23price $249,997
-
2025-10-16price $249,998
-
2025-08-31price $249,999
-
2025-07-17price $250,000
-
2025-06-12price $290,000
-
2025-06-08$1,000 Active
-
2021-07-27historical
-
2021-07-20price $195,000
-
2021-07-12price $235,000
-
2021-07-07$250,000 Active
-
2018-04-05soldstatus $50,000
-
2015-02-25soldstatus $70,000
-
2006-07-27soldstatus $76,500
-
2005-05-06historical
-
2005-04-21$42,000
-
2004-12-01soldstatus $55,500
-
2002-12-01soldstatus $33,500
-
1991-11-14soldstatus $60,000
ⓘ Source: listings_history table (triggers on properties + properties_extension) + one-shot
backfill from property_details.listing_events for pre-trigger history.
Tax reassessment forecast OK · Resets to sale price
- Current annual tax
- $615 · $51/mo
- Projected year-2 tax
- $900 · $75/mo
- Expected delta
- +$285/yr (+$24/mo · 46.3%)
ⓘ Screening estimate from a state-policy table — verify with the county assessor before closing.
Nearby sold comps map
Loading sold comps map…
Walkable amenities ~0.75 mi
Loading nearby amenities…
Taxation est. · year 1
- Rental income
- $12,049
- − Mortgage interest
- −$5,602
- − Property taxes
- −$615
- − Insurance
- −$500
- − Repairs & maintenance
- −$964
- − Management
- −$964
- − Depreciation
- −$2,909
- Taxable income
- $495
- Est. tax owed @ 24.0%
- −$119
- After-tax cash flow
- $1,992/yr
For passive investors: Depreciation is non-cash, so a rental often shows a tax loss while cash-flowing — sheltering income. Rental losses are passive: they offset passive income freely, and up to $25,000/yr can offset ordinary (W-2) income if you actively participate and your MAGI is under $100k (phasing out to $0 by $150k); unused losses carry forward. On sale, claimed depreciation is recaptured at up to 25%, and gains may owe capital-gains tax (a 1031 exchange can defer both). Figures are a year-1 estimate at your 24.0% rate — not tax advice; consult a CPA.
Schools (NCES district)
- District
- Claremore
- NCES district ID
- 4007740
- Math proficiency
- 24% ▼ -12.00%
- Reading proficiency
- 25% ▼ -11.00%
- Median HH income
- $44,946
- Composite
- 21.16/100
- National rank
- #8426
- State rank
- #111 of 270 in OK
Livability — Claremore
- Score
- 73/100
- State rank
- #20
- US rank
- #5616
Category grades
Schools grade is shown separately in the Schools card above.
Census & demographics
- Census place
- Claremore, OK
- County
- Rogers County · 50,229 people
- City population
- 50,229
- Metro
- Tulsa, OK
- Population (ZIP)
- 29,206
- Household income
- $65,368
- Rent vs Own
- Severe rent burden
- 603.0
Population outlook (Rogers County) Hauer SSP2
- Today (2025)
- 100,211 people
- By 2030
- 104,381 · +4.2%
- By 2040
- 111,567 · +11.3%
- By 2050
- 116,791 · +16.5%
- By 2075
- 129,134 · +28.9%
- By 2100
- 132,326 · +32.0%
Race, ethnicity, and origin ACS 2023
- Neighborhood character
- Diverse neighborhood (Simpson 0.55)
- Race & ethnicity
- White 67% Native American 15% Two or more races 12% Hispanic / Latino 7% Black 1%
- Hispanic origin (detail)
- Mexican 5%
- Common ancestry
- Slovak 2% Lithuanian 1% Portuguese 1%
- Foreign-born
- 3% · Canada
- Languages at home
- 94% English-only · Spanish 4%
Political lean MEDSL · Rogers
- 2024 margin
- Solid R (+55.0) · D 21.6% · R 76.6% · Other 1.7%
- 2008→2024 swing
- -10.9pp toward R · 2008: -44.1pp · 2024: -55.0pp
- All cycles
- 2024: R+55.0 2020: R+54.9 2016: R+56.3 2012: R+50.1 2008: R+44.1
Not yet ingested
- Civics
- —
Market trends
- HPI YoY
- ▼ -57.22%
- Current HPI
- 227.0657
- Rent YoY
- ▲ 2.62%
- Metro
- Tulsa, OK
- State GDP YoY
- ▲ 1.55%
- F500 in state
- 6
Industry mix (Fortune 500 HQ in OK)
| Industry | F500 HQs | Revenue |
|---|---|---|
| Energy | 3 | $48B |
|
||
Price history
+66.7% since first listed20 events — show timeline
- 2026-05-22 Listed $100,000 MLS Technology, Inc.
- 2025-11-06 Listing Removed — MLS Technology, Inc.
- 2025-10-23 Price Changed $249,997 MLS Technology, Inc.
- 2025-10-16 Price Changed $249,998 MLS Technology, Inc.
- 2025-08-31 Price Changed $249,999 MLS Technology, Inc.
- 2025-07-17 Price Changed $250,000 MLS Technology, Inc.
- 2025-06-12 Price Changed $290,000 MLS Technology, Inc.
- 2025-06-08 Listed $1,000 MLS Technology, Inc.
- 2021-07-27 Listing Removed — MLS Technology, Inc.
- 2021-07-20 Price Changed $195,000 MLS Technology, Inc.
- 2021-07-12 Price Changed $235,000 MLS Technology, Inc.
- 2021-07-07 Listed $250,000 MLS Technology, Inc.
- 2018-04-05 Sold (Public Records) $50,000 Public Records
- 2015-02-25 Sold (Public Records) $70,000 Public Records
- 2006-07-27 Sold (Public Records) $76,500 Public Records
- 2005-05-06 Listing Removed — MLS Technology, Inc.
- 2005-04-21 Listed $42,000 MLS Technology, Inc.
- 2004-12-01 Sold (Public Records) $55,500 Public Records
- 2002-12-01 Sold (Public Records) $33,500 Public Records
- 1991-11-14 Sold (Public Records) $60,000 Public Records
Property tax history
+0.9%/yrLatest (2025): $615 · +4.9% YoY. Source: county tax records.
Cash-flow waterfall
monthlySold comps — $/sqft
last 12 mo · ≤1 miLoading sold comps…