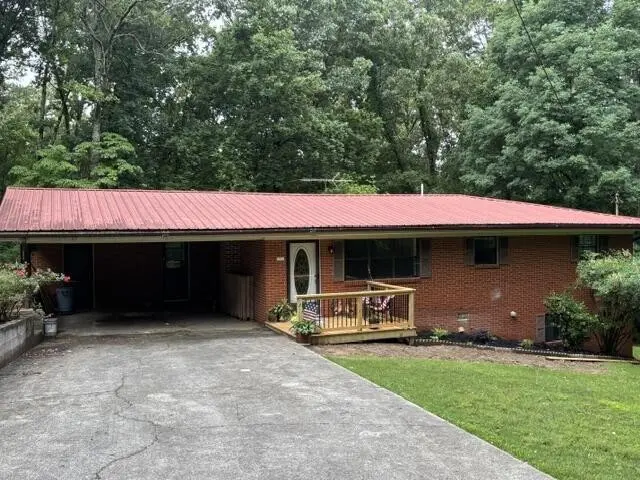
1960 Peach Orchard Hill Rd NE · Cleveland, TN
Flood risk 1/10 · Minimal
- FEMA flood zone
- X (unshaded)
- Chance of flooding over 30 yrs
- 0.0%
- Est. flood insurance / yr
- $473 – $860
Fire risk 4/10 · Minor
- Est. fire insurance / yr
- $949 – $1,763
Heat risk 5/10 · Moderate
- Hot days now (above 104°F)
- 6 days/yr
- Hot days in 30 yrs
- 16 days/yr
Wind risk 3/10 · Minor
- Chance of severe wind over 30 yrs
- 4.0%
Air-quality risk 3/10 · Minor
- Unhealthy air days now
- 2 days/yr
- Unhealthy air days in 30 yrs
- 3 days/yr
Risk factors via First Street. Map © Google.
Why this score? — see what drove the C grade
The composite is a weighted blend of 9 inputs, each scored 0–100. Each bar is that input's sub-score; the figure is the points it added to the 100-point composite (weight × sub-score).
- Cash flow +21.8/30.0
- ARV discount +15.0/15.0
- DSCR +7.0/10.0
- 1% rule +4.5/10.0
- Livability +3.5/5.0
- Schools +3.0/10.0
- Rent growth +2.5/5.0
- Condition / age +2.5/5.0
- Appreciation +0.0/10.0
$234,900
🖨 Deal sheet (PDF) 📄 Offer letter ✓ Due diligence
Listing remarks MLS
Refreshed and relisted. Kitchen has been refreshed by painting cabinets, opening up a space and new dishwasher. The owner has added bead board in several rooms with fresh paint. New flooring in both upstairs bedrooms. Come view this full brick ranch with partially finished basement. Sitting on just over 2 acres in a close in location. The new front porch leads into the living room and open dining room space. The gas log fireplace remains. A set of French doors leads out to the back covered porch which also has additional open decking. Enjoy sitting on the porch looking at all the woods that gives privacy to the back and side yards. Back inside you will find 2 bedrooms on the main level (of which one that was previously two but has been converted to one large bedroom/walk-in closet and laundry room). The basement has the 3rd bedroom, closet, bath and an additional laundry hook up. There is also a door leading out to the back yard for convenience. The 2.2 acres could have potential for future development (buyer to do their own due diligence). Home sold AS IS. Sellers are motivated and ready to close the estate.
Key facts
- 2.2 acre lot
- 2 parking spots
- Built 1962
Property features AI
Exterior
- Parking: Covered parking for 2; 2 total parking spaces; 2-car carport; Asphalt driveway
- Utilities: Private well water; Septic tank; Electricity available
- Home design: Single family residence; Residential property; Three or more levels; Existing structure
- Construction: Brick construction; Metal roof
- Exterior features: Covered porch; Sloped, wooded lot; Lot dimensions approximately 213 x 387 x 401 x 354
Interior
- Kitchen: Cooktop; Dishwasher; Refrigerator
- Bedrooms: 3 bedrooms
- Flooring: Wood flooring; Tile flooring
- Bathrooms: 2 full bathrooms
- Heating & cooling: Central heating (electric); Central air conditioning
- Interior features: Ceiling fans; Walk-in closets; Partially finished basement; One fireplace
Neighborhood map
What this means for you Summary
Snapshot
- This is a 3-bed/2.0-bath single-family listed at $235k.
Deal economics
- At list price, monthly cash flow is $367 ($4k/yr) — positive.
- The deal already cash-flows at list — no discount required.
- To meet the 1% rule (rent ≥ 1% of price), the offer needs to be $223k (5.1% below list).
- Recommended offer: $223k (5.1% below list) — sets the bar for 1% rule.
- Cap rate 8.2% vs local median 3.5% in Cleveland — top-decile yield for the area; either an underpriced asset or a hidden risk that comps aren't pricing in. Stress-test before assuming the spread holds.
Location & tenants
- Location reads 70/100 on livability (#55 in TN) — a middle-class / working-renter tenant base. Strengths: cost of living A+, health & safety A+, housing A; Watch: employment D, crime F, amenities F.
- Bradley County (other): math 35% / reading 34% proficiency, ranked #33 of 139 in TN (top 24%) — families likely to look elsewhere, expect single-tenant / working-renter base with shorter leases.
- Zoned schools: Park View Elementary School (math 42% / reading 37%, grade F, #231 of 952 statewide, top 26%, 463 students, 0% FRL); Ocoee Middle School (math 32% / reading 33%, grade F, #81 of 333 statewide, top 26%, 997 students, 0% FRL); Walker Valley High School (math 32% / reading 47%, grade F, #28 of 332 statewide, top 9%, 1,498 students, 0% FRL) — zoned schools average 0% FRL vs 46% district-wide (46 pts lower); this property's tenant base skews higher-income than the district average.
- Market conditions: 374 active listings in the ZIP; 3 comparable units currently listed for rent nearby; rentals lingering (median 46d on market — plan ~5-8 weeks vacancy on turnover, expect pricing pressure); 100% of comp listings sitting > 30 days — soft ceiling on asking rent; 768 units permitted in Bradley County in 2024 (0 in 5+ unit buildings).
- This rent runs 39% of the median local income ($69k/yr) — at the standard rent-burdened threshold; future hikes will face affordability resistance.
Forward outlook
- Local home prices are declining (-3.0%/yr); year-one equity from $2k of loan paydown is wiped out by about $7k of value loss. Plan a longer hold.
- Bradley County population projected at +21% by 2050 — long-run rental-demand tailwind backs the buy-and-hold thesis.
Negotiation context
- It's been on market 16 days — a 2% lower offer ($231k) is reasonable based on typical stale-listing flexibility.
- 15 sale attempts with the ask held roughly flat each time — persistent listings suggest the price (not the market) is what's stuck; bring a comps-based counter.
Risks & watch-outs
- Climate carrying-cost: extreme-heat days projected 6→16/yr by 2055 (HVAC capex compounding) — expect insurance premiums to compound above CPI over the hold.
Questions for the listing agent
- Built in 1962 — when were the roof, HVAC, electrical panel, plumbing, and water heater last replaced?
- Is there a deadline driving the sale (1031 exchange, divorce, estate, relocation)? That informs how much negotiation room exists.
- Schools are D-rated, which usually means shorter tenancies and higher turnover. Who's the typical renter profile here, and what's been the actual vacancy rate?
- Crime grade is F in this area — have there been break-ins, vandalism, or insurance claims at this property in the last 3 years? What carrier currently insures it and at what premium?
- What's the average days-on-market for RENTAL listings here right now (not sales)? A rising rental-DOM trend means longer vacancies and softer asking-rent achievability than the comps imply.
- What's the recent tenant-quality profile in this submarket — average credit score on applications, eviction rate, late-payment / NSF rate, and stable-employment percentage? A property-management company in the area should have these aggregated.
- How much new for-sale + rental construction is in the pipeline within 1–3 miles? Heavy new supply typically softens prices + rents 12–24 months out; constrained supply supports both.
Investment metrics
- 1% rule
- 0.95% ✗
- Cap rate
- 8.17%
- Cash-on-cash
- 6.70%
- DSCR
- 1.30
- GRM
- 8.8
CMA / ARV
- ARV (median comp)
- $373,094
- List price
- $234,900
- Delta
- -39.69%
- Verdict
- UNDERPRICED
- Comps
- 20 within 1.0 mi
Show comp detail 12 sales within ~0.75 mi
| Address | Dist | Beds/Ba | Sqft | Sold | Price | $/sf | Match |
|---|---|---|---|---|---|---|---|
| 121 Mill Run Pl NE | 0.19mi | 3/2.5 | 1,785 (+4%) | 4mo | $350,000 | $196 | 79 |
| 3618 Steeple Chase Ln NE | 0.40mi | 3/2.0 | 1,726 (+0%) | 6mo | $318,000 | $184 | 76 |
| 3557 Brandon Ln | 0.35mi | 3/2.5 | 1,776 (+3%) | 7mo | $385,000 | $217 | 70 |
| 1730 Greendale Dr NE | 0.48mi | 3/2.0 | 1,536 (-11%) | 1mo | $295,000 | $192 | 59 |
| 3882 Michelle Pl NE | 0.46mi | 3/2.0 | 1,575 (-8%) | 9mo | $255,000 | $162 | 57 |
| 3882 Michelle Pl NE | 0.46mi | 3/2.0 | 1,575 (-8%) | 9mo | $255,000 | $162 | 57 |
| 1788 Timber Creek Rd NE | 0.29mi | 3/2.0 | 1,951 (+14%) | 9mo | $390,000 | $200 | 56 |
| 1842 Rolling Brook Dr NE | 0.39mi | 3/1.0 | 1,548 (-10%) | 8mo | $230,000 | $149 | 55 |
| 1605 Orchard Pl NE | 0.48mi | 3/2.0 | 1,932 (+12%) | 10mo | $359,500 | $186 | 49 |
| 1717 Chelsa Dr NE | 0.46mi | 2/2.0 (-1) | 1,475 (-14%) | 2mo | $320,000 | $217 | 48 |
| 1717 Chelsa Dr NE | 0.46mi | 2/2.0 (-1) | 1,475 (-14%) | 2mo | $320,000 | $217 | 48 |
| 3435 Fleeman Place Dr NE | 0.56mi | 3/2.5 | 1,480 (-14%) | 8mo | $251,000 | $170 | 43 |
Match score weights: distance 35% · size 25% · config 20% · recency 20%. Top-matched comps best support the ARV.
Projected returns pro-forma
-3.0% appreciation · 3.0% rent growth · sell at horizon
- IRR
- -6.1%
- Equity multiple
- 0.78×
- Total profit
- $-14,790
- Equity at exit
- $35,024
- IRR
- 3.5%
- Equity multiple
- 1.26×
- Total profit
- $16,792
- Equity at exit
- $20,310
Cash invested: $65,772 (down + closing). Projections, not guarantees.
Landlord ↔ Tenant lean methodology
- Overall (STATE)
- 87 Strongly Landlord-Friendly
- State Tennessee
- 87 Strongly Landlord-Friendly · R+13
- County
- — inherits STATE
- City
- — inherits STATE
ZIP-level market 37323
- Home prices YoY
- -23.5%
- Active inventory
- 374
- Price-to-rent
- 8.8×
Monthly cashflow live
- Estimated rent
- $2,229 medium interval (Pro) →
- Mortgage (P&I)
- −$1,232
- Tax from tax record
- −$64 /mo · $769/yr
- Insurance
- −$98
- HOA
- −$0
- Vacancy / Maint / Mgmt
- −$468
- Net cashflow
- $367
Break-even live
Sensitivity live
| Price | -10% $500 | -5% $434 | +0% $367 | +5% $301 | +10% $234 |
|---|---|---|---|---|---|
| Rent | -10% $191 | -5% $279 | +0% $367 | +5% $455 | +10% $543 |
| Rate | -1.0pp $485 | -0.5pp $427 | base $367 | +0.5pp $306 | +1.0pp $244 |
UW: 25.0% down · 7.5% · 30yr · 1.5% tax · 5.0% vac · 8.0% maint · 8.0% mgmt
Financing live
Cash to close
- Down payment
- $58,725
- Closing costs
- $7,047
- Reserves months
- —
- Total cash needed
- —
Loan-product check · same deal, 3 products live
Conventional
25% down · 7.5% · 30yr
- Down + closing
- —
- Monthly P&I
- —
- Monthly cashflow
- —
- DSCR
- —
- Eligible?
- —
Personal DTI + credit; lowest rate.
DSCR
20% down · 8.5% · 30yr
- Down + closing
- —
- Monthly P&I
- —
- Monthly cashflow
- —
- DSCR
- —
- Eligible?
- —
No personal income docs; deal must DSCR.
Hard money
10% down · 12.0% · 12mo
- Down + closing
- —
- Monthly P&I
- —
- Monthly cashflow
- —
- DSCR
- —
- Eligible?
- —
Short-term bridge; refi at stabilization.
Rent comps 3 comps
| Address | Beds | Baths | Sqft | Rent | $/sqft | DOM | Units | Dist |
|---|---|---|---|---|---|---|---|---|
| 3221 Rolling Meadow Way Cleveland, TN | 4.0 | 2.0 | 1768 | $2,525 | $1.43 | 45d | 1 | 0.86mi |
| 4206 Belcourt Ln Cleveland, TN | 4.0 | 2.5 | 1554 | $2,150 | $1.38 | 45d | 1 | 1.34mi |
| 4204 Belcourt Ln Cleveland, TN | 3.0 | 2.5 | 1381 | $1,895 | $1.37 | 45d | 1 | 1.35mi |
Listing history 29 events
-
2026-06-21days on market $234,900 Active 16 DOM
-
2026-06-19days on market $234,900 Active 14 DOM
-
2026-06-18days on market $234,900 Active 13 DOM
-
2026-06-17days on market $234,900 Active 12 DOM
-
2026-06-16days on market $234,900 Active 11 DOM
-
2026-06-15days on market $234,900 Active 10 DOM
-
2026-06-14days on market $234,900 Active 8 DOM
-
2026-06-13statusdays on market $234,900 Active 7 DOM
-
2026-06-10days on market $234,900 Active Under Contract 5 DOM
-
2026-06-09days on market $234,900 Active Under Contract 4 DOM
-
2026-06-09status $234,900 Active Under Contract 3 DOM
-
2026-06-08days on market $234,900 Active 3 DOM
Show marketing remark (1126 chars)
Refreshed and relisted. Kitchen has been refreshed by painting cabinets, opening up a space and new dishwasher. The owner has added bead board in several rooms with fresh paint. New flooring in both upstairs bedrooms. Come view this full brick ranch with partially finished basement. Sitting on just over 2 acres in a close in location. The new front porch leads into the living room and open dining room space. The gas log fireplace remains. A set of French doors leads out to the back covered porch which also has additional open decking. Enjoy sitting on the porch looking at all the woods that gives privacy to the back and side yards. Back inside you will find 2 bedrooms on the main level (of which one that was previously two but has been converted to one large bedroom/walk-in closet and laundry room). The basement has the 3rd bedroom, closet, bath and an additional laundry hook up. There is also a door leading out to the back yard for convenience. The 2.2 acres could have potential for future development (buyer to do their own due diligence). Home sold AS IS. Sellers are motivated and ready to close the estate.
-
2026-06-07pricestatusdays on market $234,900 Active 2 DOM
-
2026-05-09historical
-
2026-05-04status Active
-
2026-05-04$225,000 Active
-
2026-04-24status Active
-
2026-04-24status Active
-
2026-04-22status Pending
-
2026-04-22historical Pending - Continue to Show - Inspection
-
2026-04-22historical
-
2026-04-22historical Active Under Contract
-
2026-04-16price $225,000
-
2026-04-16price $225,000
-
2026-04-16price $225,000
-
2026-04-13price $255,000
-
2026-04-02$265,000 Active
-
2026-04-02$265,000 Active
-
2026-04-01$265,000 Active
ⓘ Source: listings_history table (triggers on properties + properties_extension) + one-shot
backfill from property_details.listing_events for pre-trigger history.
Tax reassessment forecast TN · Resets to sale price
- Current annual tax
- $769 · $64/mo
- Projected year-2 tax
- $1,668 · $139/mo
- Expected delta
- +$899/yr (+$75/mo · 116.9%)
ⓘ Screening estimate from a state-policy table — verify with the county assessor before closing.
Climate risk First Street
- Flood 1/10 Low FEMA zone X (unshaded) · 0% chance over 30 yrs
- Wildfire 4/10 Moderate
- Heat 5/10 Major 6 d/yr ≥104°F today · 16 d/yr by 30 yrs out
- Wind 3/10 Moderate 4% chance of damaging wind over 30 yrs
- Air quality 3/10 Moderate 2 unhealthy d/yr today · 3 by 30 yrs out
Nearby sold comps map
Loading sold comps map…
Walkable amenities ~0.75 mi
Loading nearby amenities…
Taxation est. · year 1
- Rental income
- $26,748
- − Mortgage interest
- −$13,158
- − Property taxes
- −$769
- − Insurance
- −$1,174
- − Repairs & maintenance
- −$2,140
- − Management
- −$2,140
- − Depreciation
- −$6,833
- Taxable income
- $533
- Est. tax owed @ 24.0%
- −$128
- After-tax cash flow
- $4,277/yr
For passive investors: Depreciation is non-cash, so a rental often shows a tax loss while cash-flowing — sheltering income. Rental losses are passive: they offset passive income freely, and up to $25,000/yr can offset ordinary (W-2) income if you actively participate and your MAGI is under $100k (phasing out to $0 by $150k); unused losses carry forward. On sale, claimed depreciation is recaptured at up to 25%, and gains may owe capital-gains tax (a 1031 exchange can defer both). Figures are a year-1 estimate at your 24.0% rate — not tax advice; consult a CPA.
Schools (NCES district)
- District
- Bradley County
- NCES district ID
- 4700330
- Math proficiency
- 35% ▼ -5.00%
- Reading proficiency
- 34% ▼ -2.00%
- Median HH income
- $45,807
- Composite
- 29.54/100
- National rank
- #6494
- State rank
- #33 of 139 in TN
Livability — Cleveland
- Score
- 70/100
- State rank
- #55
- US rank
- #7689
Category grades
Schools grade is shown separately in the Schools card above.
Census & demographics
- County
- Bradley County · 99,337 people
- Metro
- Cleveland, TN
- Population (ZIP)
- 31,948
- Household income
- $68,768
- Rent vs Own
- Severe rent burden
- 371.0
Population outlook (Bradley County) Hauer SSP2
- Today (2025)
- 114,901 people
- By 2030
- 120,137 · +4.6%
- By 2040
- 130,125 · +13.2%
- By 2050
- 139,257 · +21.2%
- By 2075
- 161,664 · +40.7%
- By 2100
- 179,767 · +56.5%
Race, ethnicity, and origin ACS 2023
- Neighborhood character
- Predominantly White (88%)
- Race & ethnicity
- White 88% Hispanic / Latino 7% Two or more races 6% Black 1%
- Hispanic origin (detail)
- Mexican 4% Puerto Rican 1%
- Common ancestry
- Lithuanian 2% Subsaharan African 2% Italian 1%
- Foreign-born
- 4% · Canada
- Languages at home
- 93% English-only · Spanish 5% Russian/Polish/Slavic 2%
Political lean MEDSL · Bradley
- 2024 margin
- Solid R (+58.9) · D 20.0% · R 78.9% · Other 1.1%
- 2008→2024 swing
- -9.2pp toward R · 2008: -49.7pp · 2024: -58.9pp
- All cycles
- 2024: R+58.9 2020: R+55.3 2016: R+59.1 2012: R+53.9 2008: R+49.7
Not yet ingested
- Civics
- —
Market trends
- HPI YoY
- ▼ -88.38%
- Current HPI
- 287.3643
- Rent YoY
- —
- Metro
- Cleveland, TN
- State GDP YoY
- ▲ 2.78%
- F500 in state
- 22
Industry mix (Fortune 500 HQ in TN)
| Industry | F500 HQs | Revenue |
|---|---|---|
| Healthcare | 3 | $91B |
|
||
| Retail | 3 | $72B |
|
||
| Transportation / Logistics | 1 | $88B |
|
||
| Paper / Packaging | 1 | $19B |
|
||
| Insurance | 1 | $13B |
|
||
| Energy | 1 | $12B |
|
||
Price history
-11.4% since first listed28 events — show timeline
- 2026-06-12 Relisted — GCAR
- 2026-06-12 Relisted — RCAOR
- 2026-06-12 Relisted — REALTRACS as Distributed by MLS Grid
- 2026-06-12 Relisted — Knoxville MLS
- 2026-06-08 Contingent — REALTRACS as Distributed by MLS Grid
- 2026-06-08 Pending — GCAR
- 2026-06-08 Contingent — RCAOR
- 2026-06-08 Pending — Knoxville MLS
- 2026-06-05 Listed $234,900 REALTRACS as Distributed by MLS Grid
- 2026-06-05 Listed $234,900 Knoxville MLS
- 2026-06-05 Listed $234,900 RCAOR
- 2026-06-05 Listed $234,900 GCAR
- 2026-05-09 Listing Removed — REALTRACS as Distributed by MLS Grid
- 2026-05-04 Relisted — Knoxville MLS
- 2026-05-04 Listed $225,000 REALTRACS as Distributed by MLS Grid
- 2026-04-24 Relisted — RCAOR
- 2026-04-24 Relisted — GCAR
- 2026-04-22 Pending — GCAR
- 2026-04-22 Contingent — Knoxville MLS
- 2026-04-22 Listing Removed — Knoxville MLS
- 2026-04-22 Contingent — RCAOR
- 2026-04-16 Price Changed $225,000 Knoxville MLS
- 2026-04-16 Price Changed $225,000 RCAOR
- 2026-04-16 Price Changed $225,000 GCAR
- 2026-04-13 Price Changed $255,000 RCAOR
- 2026-04-02 Listed $265,000 GCAR
- 2026-04-02 Listed $265,000 Knoxville MLS
- 2026-04-01 Listed $265,000 RCAOR
Property tax history
+0.8%/yrLatest (2025): $769 · +8.5% YoY. Source: county tax records.
Cash-flow waterfall
monthlySold comps — $/sqft
last 12 mo · ≤1 miLoading sold comps…