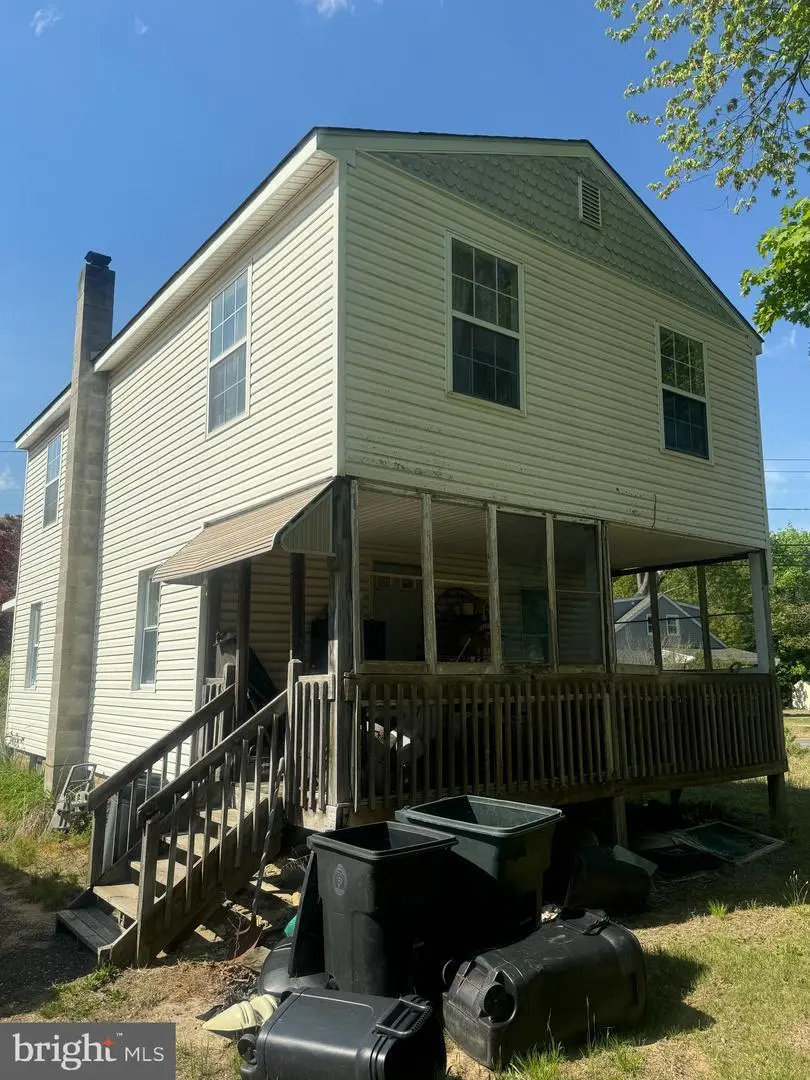
1054 Mail Ave · Woodbury Heights, NJ
Flood risk 1/10 · Minimal
- FEMA flood zone
- X (unshaded)
- Chance of flooding over 30 yrs
- 0.0%
- Est. flood insurance / yr
- $507 – $1,088
Fire risk 3/10 · Minor
- Est. fire insurance / yr
- $526 – $976
Heat risk 6/10 · Moderate
- Hot days now (above 104°F)
- 7 days/yr
- Hot days in 30 yrs
- 14 days/yr
Wind risk 6/10 · Moderate
- Chance of severe wind over 30 yrs
- 52.0%
Air-quality risk 4/10 · Minor
- Unhealthy air days now
- 4 days/yr
- Unhealthy air days in 30 yrs
- 6 days/yr
Risk factors via First Street. Map © Google.
Why this score? — see what drove the B grade
The composite is a weighted blend of 9 inputs, each scored 0–100. Each bar is that input's sub-score; the figure is the points it added to the 100-point composite (weight × sub-score).
- Cash flow +28.4/30.0
- ARV discount +15.0/15.0
- DSCR +10.0/10.0
- 1% rule +8.4/10.0
- Livability +3.7/5.0
- Schools +2.8/10.0
- Rent growth +2.5/5.0
- Condition / age +2.5/5.0
- Appreciation +0.0/10.0
$190,000
🖨 Deal sheet 📄 Offer letter ✓ Due diligence
Listing remarks
INVESTOR ALERT / HANDYMAN SPECIAL! This 3 bedroom, 1/1 bath Colonial is perfect for investors or buyers looking to renovate and build equity. The property offers tons of potential. Being sold strictly as-is, where-is. Buyer is responsible for all inspections, certifications, and the Certificate of Occupancy (CO).
Key facts
- Built 1930
- Listed 37 days
Property features AI
Finance
- Other: Ownership: Fee simple
Exterior
- Parking: Driveway; On-street parking
- Utilities: Public water; Public sewer
- Home design: Detached single-family home; Above-grade finished area approximately 1,200 (assessor)
- Construction: Frame construction; Block foundation; Above grade and below grade structures
- Exterior features: Lot dimensions approximately 49 x 0
Interior
- Bedrooms: Three bedrooms on the upper level
- Bathrooms: One full bathroom (upper level); One half bathroom (main level)
- Heating & cooling: Heating system: Other (oil-fired fuel); Hot water provided by natural gas
- Interior features: Unfinished basement
Neighborhood map
What this means for you Summary
Snapshot
- This is a 3-bed/1.5-bath single-family listed at $190k.
Deal economics
- At list price, monthly cash flow is $612 ($7k/yr) — positive.
- The deal already cash-flows at list — no discount required.
- Meets the 1% rule at list price ($3k rent vs $190k).
- Recommended offer: $184k (3.0% below list) — sets the bar for market timing.
Location & tenants
- Location reads 74/100 on livability (#183 in NJ, #4,954 nationally) — a middle-class / working-renter tenant base. Strengths: crime A+, employment A+, housing A+; Watch: cost of living D+, amenities F, commute F.
- Deptford Township Public School District (suburban): math 17% / reading 45% proficiency, ranked #326 of 472 in NJ (top 69%) — families likely to look elsewhere, expect single-tenant / working-renter base with shorter leases.
- Market conditions: 176 active listings in the ZIP; 3 comparable units currently listed for rent nearby; rentals leasing fast (median 1d on market — plan ~1-2 weeks tenant-placement turnaround); solid renter incomes; 1,047 units permitted in Gloucester County in 2024 (183 in 5+ unit buildings).
- This rent runs 34% of the median local income ($89k/yr) — at the standard rent-burdened threshold; future hikes will face affordability resistance.
Forward outlook
- Local home prices are declining (-3.0%/yr); year-one equity from $1k of loan paydown is wiped out by about $6k of value loss. Plan a longer hold.
- Gloucester County population projected to shrink 5% by 2050 — rents likely to lag national; underwrite the cash flow, not the appreciation.
- At projected returns (-3.0% appreciation + 3.0% rent growth), your $53k cash investment doubles in ~9 years — after that, you're playing with house money.
Negotiation context
- It's been on market 37 days — a 3% lower offer ($184k) is reasonable based on typical stale-listing flexibility.
Risks & watch-outs
- Watch-outs: built in 1930 — expect roof / HVAC / electrical / plumbing capex.
- Climate carrying-cost: major wind risk, 52% chance of damaging wind over 30y; extreme-heat days projected 7→14/yr by 2055 (HVAC capex compounding) — expect insurance premiums to compound above CPI over the hold.
Questions for the listing agent
- It's been on market 37 days. Have you received any prior offers? Is the seller open to a 3% concession, seller financing, or rate buy-down credit?
- Built in 1930 — when were the roof, HVAC, electrical panel, plumbing, and water heater last replaced?
- Is there a deadline driving the sale (1031 exchange, divorce, estate, relocation)? That informs how much negotiation room exists.
- Schools are B-rated — typically a magnet for longer-tenancy family renters. What's the average tenant stay here, and is there a school-zone premium baked into asking?
- What's the average days-on-market for RENTAL listings here right now (not sales)? A rising rental-DOM trend means longer vacancies and softer asking-rent achievability than the comps imply.
- What's the recent tenant-quality profile in this submarket — average credit score on applications, eviction rate, late-payment / NSF rate, and stable-employment percentage? A property-management company in the area should have these aggregated.
- How much new for-sale + rental construction is in the pipeline within 1–3 miles? Heavy new supply typically softens prices + rents 12–24 months out; constrained supply supports both.
Investment metrics
- 1% rule
- 1.34% ✓
- Cap rate
- 10.16%
- Cash-on-cash
- 13.81%
- DSCR
- 1.61
- GRM
- 6.2
CMA / ARV
- ARV (median comp)
- $308,237
- List price
- $190,000
- Delta
- -38.36%
- Verdict
- UNDERPRICED
- Comps
- 20 within 1.0 mi
Show comp detail 12 sales within ~0.75 mi
| Address | Dist | Beds/Ba | Sqft | Sold | Price | $/sf | Match |
|---|---|---|---|---|---|---|---|
| 1054 Mail Ave | 0.00mi | 3/1.5 | 1,200 (0%) | 0mo | $190,000 | $158 | 100 |
| 148 Lincoln Rd | 0.29mi | 4/1.0 (+1) | 1,267 (+6%) | 2mo | $350,000 | $276 | 68 |
| 1412 Glassboro Rd | 0.29mi | 4/1.0 (+1) | 1,267 (+6%) | 11mo | $310,000 | $245 | 62 |
| 853 Mail Avenue Ave | 0.53mi | 3/1.0 | 1,276 (+6%) | 2mo | $160,000 | $125 | 61 |
| 1190 Cattell Rd | 0.69mi | 3/1.0 | 1,216 (+1%) | 5mo | $352,000 | $289 | 60 |
| 158 Carver Dr | 0.22mi | 4/1.0 (+1) | 1,267 (+6%) | 18mo | $320,000 | $253 | 58 |
| 114 Brookfield Ave | 0.28mi | 3/2.0 | 1,309 (+9%) | 15mo | $335,900 | $257 | 58 |
| 884 Boundary Rd | 0.62mi | 3/1.0 | 1,276 (+6%) | 4mo | $353,000 | $277 | 56 |
| 1114 Glassboro Rd | 0.36mi | 3/1.0 | 1,069 (-11%) | 11mo | $310,000 | $290 | 54 |
| 724 Park | 0.54mi | 3/1.0 | 1,280 (+7%) | 11mo | $320,000 | $250 | 53 |
| 525 Westminster Rd | 0.72mi | 3/2.0 | 1,334 (+11%) | 4mo | $365,000 | $274 | 42 |
| 205 E Buttonwood St | 0.71mi | 2/1.5 (-1) | 1,288 (+7%) | 13mo | $304,000 | $236 | 38 |
Match score weights: distance 35% · size 25% · config 20% · recency 20%. Top-matched comps best support the ARV.
Projected returns pro-forma
-3.0% appreciation · 3.0% rent growth · sell at horizon
- IRR
- 4.0%
- Equity multiple
- 1.16×
- Total profit
- $8,309
- Equity at exit
- $28,330
- IRR
- 13.6%
- Equity multiple
- 2.09×
- Total profit
- $57,831
- Equity at exit
- $16,428
Cash invested: $53,200 (down + closing). Projections, not guarantees.
Landlord ↔ Tenant lean methodology
- Overall (STATE)
- 21 Tenant-Leaning
- State New Jersey
- 21 Tenant-Leaning · D+6
- County
- — inherits STATE
- City
- — inherits STATE
ZIP-level market 08096
- Active inventory
- 176
- Price-to-rent
- 6.2×
Monthly cashflow live
- Estimated rent
- $2,545 medium interval (Pro) →
- Mortgage (P&I)
- −$996
- Tax from tax record
- −$323 /mo · $3,871/yr
- Insurance
- −$79
- HOA
- −$0
- Vacancy / Maint / Mgmt
- −$534
- Net cashflow
- $612
Break-even live
UW: 25.0% down · 7.5% · 30yr · 1.5% tax · 5.0% vac · 8.0% maint · 8.0% mgmt
Financing live
Cash to close
- Down payment
- $47,500
- Closing costs
- $5,700
- Reserves months
- —
- Total cash needed
- —
Loan-product check · same deal, 3 products live
Conventional
25% down · 7.5% · 30yr
- Down + closing
- —
- Monthly P&I
- —
- Monthly cashflow
- —
- DSCR
- —
- Eligible?
- —
Personal DTI + credit; lowest rate.
DSCR
20% down · 8.5% · 30yr
- Down + closing
- —
- Monthly P&I
- —
- Monthly cashflow
- —
- DSCR
- —
- Eligible?
- —
No personal income docs; deal must DSCR.
Hard money
10% down · 12.0% · 12mo
- Down + closing
- —
- Monthly P&I
- —
- Monthly cashflow
- —
- DSCR
- —
- Eligible?
- —
Short-term bridge; refi at stabilization.
Rent comps 3 comps
| Address | Beds | Baths | Sqft | Rent | $/sqft | DOM | Units | Dist |
|---|---|---|---|---|---|---|---|---|
| 523 Chestnut Ave Woodbury Heights, NJ | 1.0–2.0 | 1.0–2.0 | 929 | $3,007 | $3.24 | 1d | 138 | 0.48mi |
| 1482 Glassboro Rd Unit A Wenonah, NJ | 2.0 | 1.0 | 1100 | $2,200 | $2.00 | 1d | 1 | 0.66mi |
| 752 Howard Ave Unit 1 Wenonah, NJ | 3.0 | 1.0 | 1150 | $2,525 | $2.20 | 2d | 1 | 1.13mi |
Listing history 8 events
-
2026-06-07statusdays on market $190,000 Pending 37 DOM
-
2026-06-04days on market $190,000 Active 36 DOM
-
2026-06-03days on market $190,000 Active 35 DOM
-
2026-06-02days on market $190,000 Active 34 DOM
-
2026-06-01days on market $190,000 Active 33 DOM
-
2026-05-31days on market $190,000 Active 32 DOM
-
2026-04-30$190,000 Active 314-char remark
-
1978-05-01soldstatus $18,500
ⓘ Source: listings_history table (triggers on properties + properties_extension) + one-shot
backfill from property_details.listing_events for pre-trigger history.
Tax reassessment forecast NJ · Partial reset (capped growth)
- Current annual tax
- $3,871 · $323/mo
- Projected year-2 tax
- $4,301 · $358/mo
- Expected delta
- +$430/yr (+$36/mo · 11.1%)
ⓘ Screening estimate from a state-policy table — verify with the county assessor before closing.
Climate risk First Street
- Flood 1/10 Low FEMA zone X (unshaded) · 0% chance over 30 yrs
- Wildfire 3/10 Moderate
- Heat 6/10 Major 7 d/yr ≥104°F today · 14 d/yr by 30 yrs out
- Wind 6/10 Major 52% chance of damaging wind over 30 yrs
- Air quality 4/10 Moderate 4 unhealthy d/yr today · 6 by 30 yrs out
Nearby sold comps map
Loading sold comps map…
Walkable amenities ~0.75 mi
Loading nearby amenities…
Taxation est. · year 1
- Rental income
- $30,540
- − Mortgage interest
- −$10,643
- − Property taxes
- −$3,871
- − Insurance
- −$950
- − Repairs & maintenance
- −$2,443
- − Management
- −$2,443
- − Depreciation
- −$5,527
- Taxable income
- $4,663
- Est. tax owed @ 24.0%
- −$1,119
- After-tax cash flow
- $6,230/yr
For passive investors: Depreciation is non-cash, so a rental often shows a tax loss while cash-flowing — sheltering income. Rental losses are passive: they offset passive income freely, and up to $25,000/yr can offset ordinary (W-2) income if you actively participate and your MAGI is under $100k (phasing out to $0 by $150k); unused losses carry forward. On sale, claimed depreciation is recaptured at up to 25%, and gains may owe capital-gains tax (a 1031 exchange can defer both). Figures are a year-1 estimate at your 24.0% rate — not tax advice; consult a CPA.
Schools (NCES district)
- District
- Deptford Township Public School District
- NCES district ID
- 3403900
- Math proficiency
- 17% ▼ -24.00%
- Reading proficiency
- 45% ▼ -5.00%
- Median HH income
- $66,302
- Composite
- 28.48/100
- National rank
- #6741
- State rank
- #326 of 472 in NJ
Livability — Woodbury Heights
- Score
- 74/100
- State rank
- #183
- US rank
- #4954
Category grades
Schools grade is shown separately in the Schools card above.
Census & demographics
- County
- Gloucester County · 160,422 people
- City population
- 3,207
- Metro
- Philadelphia-Camden-Wilmington, PA-NJ-DE-MD
- Population (ZIP)
- 35,336
- Household income
- $89,013
- Rent vs Own
- Severe rent burden
- 1044.0
Population outlook (Gloucester County) Hauer SSP2
- Today (2025)
- 298,895 people
- By 2030
- 299,031 · +0.0%
- By 2040
- 294,020 · -1.6%
- By 2050
- 284,188 · -4.9%
- By 2075
- 260,720 · -12.8%
- By 2100
- 229,565 · -23.2%
Race, ethnicity, and origin ACS 2023
- Neighborhood character
- Predominantly White (66%)
- Race & ethnicity
- White 66% Hispanic / Latino 13% Black 12% Two or more races 10% Asian 3%
- Hispanic origin (detail)
- Mexican 3% Puerto Rican 5% Dominican 1%
- Common ancestry
- Romanian 4% Lithuanian 1% Iranian 1%
- Foreign-born
- 8% · Canada, China, South Korea
- Languages at home
- 86% English-only · Spanish 9% Other Indo-European 2% Other Asian/Pacific 1%
Political lean MEDSL · Gloucester
- 2024 margin
- Toss-up / Even · D 47.8% · R 50.6% · Other 1.6%
- 2008→2024 swing
- -15.0pp toward R · 2008: 12.2pp · 2024: -2.8pp
- All cycles
- 2024: R+2.8 2020: D+1.9 2016: R+0.4 2012: D+10.5 2008: D+12.2
Not yet ingested
- Civics
- —
Market trends
- HPI YoY
- ▼ -239.24%
- Current HPI
- 269.1606
- Rent YoY
- —
- Metro
- Philadelphia-Camden-Wilmington, PA-NJ-DE-MD
- State GDP YoY
- ▲ 2.05%
- F500 in state
- 34
Industry mix (Fortune 500 HQ in NJ)
| Industry | F500 HQs | Revenue |
|---|---|---|
| Consumer Goods | 3 | $31B |
|
||
| Pharmaceuticals | 2 | $153B |
|
||
| Technology | 2 | $21B |
|
||
| Insurance | 2 | $20B |
|
||
| Healthcare | 2 | $19B |
|
||
| Financial Services | 1 | $70B |
|
||
Price history
+927.0% since first listed4 events — show timeline
- 2026-06-16 Sold (MLS) $190,000 BRIGHT MLS
- 2026-06-05 Pending — BRIGHT MLS
- 2026-04-30 Listed $190,000 BRIGHT MLS
- 1978-05-01 Sold (Public Records) $18,500 Public Records
Property tax history
+2.3%/yrLatest (2025): $3,871 · +2.1% YoY. Source: county tax records.
Cash-flow waterfall
monthlySold comps — $/sqft
last 12 mo · ≤1 miLoading sold comps…