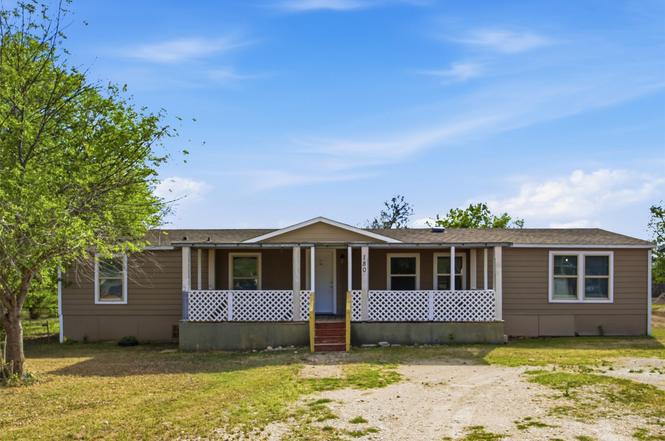
180 Quail Ridge Dr · Kyle, TX
Flood risk 1/10 · Minimal
- FEMA flood zone
- X (unshaded)
- Chance of flooding over 30 yrs
- 0.0%
- Est. flood insurance / yr
- $507 – $1,088
Fire risk 4/10 · Minor
- Est. fire insurance / yr
- $1,222 – $2,270
Heat risk 8/10 · Major
- Hot days now (above 108°F)
- 7 days/yr
- Hot days in 30 yrs
- 21 days/yr
Wind risk 8/10 · Major
- Chance of severe wind over 30 yrs
- 80.0%
Air-quality risk 2/10 · Minimal
- Unhealthy air days now
- 0 days/yr
- Unhealthy air days in 30 yrs
- 1 days/yr
Risk factors via First Street. Map © Google.
Why this score? — see what drove the D+ grade
The composite is a weighted blend of 9 inputs, each scored 0–100. Each bar is that input's sub-score; the figure is the points it added to the 100-point composite (weight × sub-score).
- ARV discount +15.0/15.0
- Cash flow +14.2/30.0
- DSCR +4.3/10.0
- Livability +3.8/5.0
- 1% rule +3.6/10.0
- Schools +3.5/10.0
- Condition / age +2.5/5.0
- Rent growth +2.4/5.0
- Appreciation +0.0/10.0
$240,000
🖨 Deal sheet (PDF) 📄 Offer letter ✓ Due diligence
Listing remarks
Beautifully remodeled 4 bedroom, 2 bath manufactured home in the heart of Kyle! Featuring a bright, open layout with abundant natural light. This move in ready home showcases modern finishes and stylish updates throughout. The thoughtfully designed floor plan combines an open concept feel with well placed room separation, offering both functionality and privacy, while the spacious bedrooms provide comfort for everyone. Enjoy outdoor living from the inviting front porch or back patio, ideal for morning coffee, weekend gatherings, or relaxing evenings at home. You'll love the convenience of being just minutes from Downtown Kyle, shopping and dining, and main roadways for easy access to Austin
Key facts
- Remodeled
- Front porch
- Natural light
Tags
Property features AI
Exterior
- Parking: Outside unpaved parking for four vehicles
- Utilities: Electricity available; Public water; Septic tank sewer
- Home design: Single-story home; Faces east; Resale property
- Construction: Built per public records; Aluminum siding; Composition roof; Pillar/post/pier foundation
- Exterior features: Rear covered porch; Deck; Exterior steps; Partial chain link fencing; Level lot
Interior
- Kitchen: Dishwasher; Disposal; Microwave; Oven; Refrigerator
- Bedrooms: Four main-level bedrooms
- Flooring: Tile; Vinyl; Carpet-free
- Bathrooms: Two full bathrooms
- Heating & cooling: Central heating; Central air conditioning
- Interior features: Ceiling fan(s); Eat-in kitchen; Multiple living areas; Open floorplan; Blinds on windows
- Laundry & utility: Interior laundry room
Neighborhood map
What this means for you Summary
Snapshot
- This is a 4-bed/2.0-bath manufactured listed at $240k.
Deal economics
- At list price, monthly cash flow is $41 ($494/yr) — positive.
- The deal already cash-flows at list — no discount required.
- To meet the 1% rule (rent ≥ 1% of price), the offer needs to be $207k (13.8% below list).
- Recommended offer: $207k (13.8% below list) — sets the bar for 1% rule.
- Cap rate 6.5% vs local median 3.3% in Kyle — top-decile yield for the area; either an underpriced asset or a hidden risk that comps aren't pricing in. Stress-test before assuming the spread holds.
Location & tenants
- Location reads 75/100 on livability (#138 in TX, #3,993 nationally) — a middle-class / working-renter tenant base. Strengths: housing A+, health & safety A+, employment A; Watch: amenities F, commute F.
- Hays CISD (rural): math 35% / reading 41% proficiency, ranked #390 of 826 in TX (top 47%) — families likely to look elsewhere, expect single-tenant / working-renter base with shorter leases.
- Zoned schools: Blanco Vista El (math 33% / reading 42%, grade F, #1,744 of 4,322 statewide, top 41%, 731 students, 58% FRL); Laura B Wallace Middle (math 31% / reading 34%, grade F, #947 of 1,662 statewide, top 58%, 789 students, 53% FRL); Lehman H S (math 20% / reading 32%, grade F, #1,234 of 1,632 statewide, top 76%, 2,120 students, 59% FRL).
- Market conditions: Rents soft (-0.3%/yr); 1820 active listings in the ZIP; 40 comparable units currently listed for rent nearby; rentals at typical pace (median 20d on market — plan ~3-4 weeks tenant-placement turnaround); solid renter incomes; 5,270 units permitted in Hays County in 2024 (1,464 in 5+ unit buildings).
Forward outlook
- Local home prices are declining (-3.0%/yr); year-one equity from $2k of loan paydown is wiped out by about $7k of value loss. Plan a longer hold.
- Hays County population projected at +93% by 2050 — long-run rental-demand tailwind backs the buy-and-hold thesis.
Negotiation context
- Only 7 days on market — expect competitive offers; lowballing is unlikely to land.
- 3 sale attempts since 23y ago with the ask held roughly flat each time — persistent listings suggest the price (not the market) is what's stuck; bring a comps-based counter.
Risks & watch-outs
- Climate carrying-cost: severe wind risk, 80% chance of damaging wind over 30y; extreme-heat days projected 7→21/yr by 2055 (HVAC capex compounding) — expect insurance premiums to compound above CPI over the hold.
Questions for the listing agent
- Is there a deadline driving the sale (1031 exchange, divorce, estate, relocation)? That informs how much negotiation room exists.
- Schools are D-rated, which usually means shorter tenancies and higher turnover. Who's the typical renter profile here, and what's been the actual vacancy rate?
- The area grade is low — what's the realistic commute time and amenity access for the typical tenant pool here? Any planned neighborhood developments (good or bad) we should know about?
- What's the average days-on-market for RENTAL listings here right now (not sales)? A rising rental-DOM trend means longer vacancies and softer asking-rent achievability than the comps imply.
- What's the recent tenant-quality profile in this submarket — average credit score on applications, eviction rate, late-payment / NSF rate, and stable-employment percentage? A property-management company in the area should have these aggregated.
- How much new for-sale + rental construction is in the pipeline within 1–3 miles? Heavy new supply typically softens prices + rents 12–24 months out; constrained supply supports both.
Investment metrics
- 1% rule
- 0.86% ✗
- Cap rate
- 6.50%
- Cash-on-cash
- 0.73%
- DSCR
- 1.03
- GRM
- 9.7
CMA / ARV
- ARV (on-the-fly)
- $325,920
- Comps found
- 2
Show comp detail 2 sales within ~0.75 mi
| Address | Dist | Beds/Ba | Sqft | Sold | Price | $/sf | Match |
|---|---|---|---|---|---|---|---|
| 265 Quail Ridge Dr | 0.18mi | 3/2.0 (-1) | 1,440 (-14%) | 12mo | $279,900 | $194 | 53 |
| 123 Quail Ridge Dr | 0.47mi | 4/2.0 | 1,510 (-10%) | 22mo | $245,000 | $162 | 43 |
Match score weights: distance 35% · size 25% · config 20% · recency 20%. Top-matched comps best support the ARV.
Projected returns pro-forma
-3.0% appreciation · 0.0% rent growth · sell at horizon
- IRR
- -18.4%
- Equity multiple
- 0.37×
- Total profit
- $-42,343
- Equity at exit
- $35,785
- IRR
- -17.9%
- Equity multiple
- 0.15×
- Total profit
- $-56,965
- Equity at exit
- $20,751
Cash invested: $67,200 (down + closing). Projections, not guarantees.
Landlord ↔ Tenant lean methodology
- Overall (STATE)
- 87 Strongly Landlord-Friendly
- State Texas
- 87 Strongly Landlord-Friendly · R+5
- County
- — inherits STATE
- City
- — inherits STATE
ZIP-level market 78640
- Home prices YoY
- -33.8%
- Rents YoY
- -0.3%
- Active inventory
- 1820
- Price-to-rent
- 9.7×
Monthly cashflow live
- Estimated rent
- $2,069 high interval (Pro) →
- Mortgage (P&I)
- −$1,259
- Tax from tax record
- −$235 /mo · $2,816/yr
- Insurance
- −$100
- HOA
- −$0
- Vacancy / Maint / Mgmt
- −$434
- Net cashflow
- $41
Break-even live
Sensitivity live
| Price | -10% $177 | -5% $109 | +0% $41 | +5% $-27 | +10% $-95 |
|---|---|---|---|---|---|
| Rent | -10% $-122 | -5% $-41 | +0% $41 | +5% $123 | +10% $205 |
| Rate | -1.0pp $162 | -0.5pp $102 | base $41 | +0.5pp $-21 | +1.0pp $-84 |
UW: 25.0% down · 7.5% · 30yr · 1.5% tax · 5.0% vac · 8.0% maint · 8.0% mgmt
Financing live
Cash to close
- Down payment
- $60,000
- Closing costs
- $7,200
- Reserves months
- —
- Total cash needed
- —
Loan-product check · same deal, 3 products live
Conventional
25% down · 7.5% · 30yr
- Down + closing
- —
- Monthly P&I
- —
- Monthly cashflow
- —
- DSCR
- —
- Eligible?
- —
Personal DTI + credit; lowest rate.
DSCR
20% down · 8.5% · 30yr
- Down + closing
- —
- Monthly P&I
- —
- Monthly cashflow
- —
- DSCR
- —
- Eligible?
- —
No personal income docs; deal must DSCR.
Hard money
10% down · 12.0% · 12mo
- Down + closing
- —
- Monthly P&I
- —
- Monthly cashflow
- —
- DSCR
- —
- Eligible?
- —
Short-term bridge; refi at stabilization.
Rent comps 40 comps
| Address | Beds | Baths | Sqft | Rent | $/sqft | DOM | Units | Dist |
|---|---|---|---|---|---|---|---|---|
| 310 Fossil Dr Kyle, TX | 3.0 | 2.0 | 1602 | $2,000 | $1.25 | 6d | 1 | 0.55mi |
| 364 Kenai Dr Kyle, TX | 3.0 | 2.0 | 1157 | $2,000 | $1.73 | 6d | 1 | 0.60mi |
| 141 Opal Ln Kyle, TX | 3.0 | 1.0–2.0 | 886 | $2,000 | $2.26 | 0d | 92 | 0.60mi |
| 265 Garner Dr Kyle, TX | 3.0 | 2.0 | 1551 | $2,250 | $1.45 | 45d | 1 | 0.66mi |
| 185 Voss Kyle, TX | 3.0 | 2.0 | 1371 | $1,800 | $1.31 | 13d | 1 | 0.74mi |
| 232 Voss Kyle, TX | 3.0 | 2.0 | 1467 | $1,895 | $1.29 | 6d | 1 | 0.76mi |
| 157 Mammoth Dr Kyle, TX | 3.0 | 2.0 | 1607 | $1,895 | $1.18 | 25d | 1 | 0.80mi |
| 141 Everglades Dr Kyle, TX | 3.0 | 2.5 | 2179 | $2,000 | $0.92 | 45d | 1 | 0.83mi |
| 149 Biscayne Dr Kyle, TX | 4.0 | 2.0 | 1800 | $1,900 | $1.06 | 19d | 1 | 0.86mi |
| 384 Discovery Kyle, TX | 4.0 | 2.5 | 2080 | $1,995 | $0.96 | 45d | 1 | 0.90mi |
| 121 Yellowstone Dr Kyle, TX | 3.0 | 2.0 | 1723 | $2,200 | $1.28 | 25d | 1 | 0.91mi |
| 349 Zarya Kyle, TX | 4.0 | 2.5 | 2089 | $6,200 | $2.97 | 19d | 1 | 0.91mi |
| 376 Musgrav Kyle, TX | 3.0 | 2.0 | 1476 | $1,988 | $1.35 | 18d | 1 | 0.97mi |
| 376 Musgrav Kyle, TX | 3.0 | 2.0 | 1476 | $1,890 | $1.28 | 0d | 1 | 0.97mi |
| 190 Sormonne Loop Kyle, TX | 3.0 | 2.0 | 1450 | $1,650 | $1.14 | 25d | 1 | 1.00mi |
| 184 Unity Kyle, TX | 4.0 | 2.5 | 1704 | $2,000 | $1.17 | 45d | 1 | 1.03mi |
| 208 Discovery Kyle, TX | 3.0 | 2.0 | 1893 | $2,025 | $1.07 | 45d | 1 | 1.06mi |
| 208 Discovery Kyle, TX | 3.0 | 2.0 | 1893 | $1,895 | $1.00 | 0d | 1 | 1.06mi |
| 591 Avre Loop Kyle, TX | 4.0 | 2.0 | 1950 | $2,200 | $1.13 | 25d | 1 | 1.09mi |
| 514 Silo St San Marcos, TX | 3.0 | 2.0 | 1368 | $2,045 | $1.49 | 6d | 1 | 1.12mi |
| 147 Otter Rd Kyle, TX | 3.0 | 2.0 | 1622 | $1,850 | $1.14 | 14d | 1 | 1.12mi |
| 125 Voyager Cv Kyle, TX | 3.0 | 2.0 | 1476 | $1,800 | $1.22 | 45d | 1 | 1.15mi |
| 149 River Rise Rd Kyle, TX | 4.0 | 2.0 | 1896 | $1,950 | $1.03 | 25d | 1 | 1.15mi |
| 148 River Rise Rd Kyle, TX | 4.0 | 2.0 | 1622 | $1,800 | $1.11 | 45d | 1 | 1.18mi |
| 212 Durata San Marcos, TX | 3.0 | 2.0 | 1862 | $2,250 | $1.21 | 45d | 1 | 1.23mi |
| 420 Chaste Tree Dr San Marcos, TX | 4.0 | 2.0 | 1900 | $2,600 | $1.37 | 45d | 1 | 1.26mi |
| 271 Alamito Ave Kyle, TX | 4.0 | 3.5 | 1923 | $2,100 | $1.09 | 16d | 1 | 1.27mi |
| 366 Silver Springs Bnd Kyle, TX | 3.0 | 2.5 | 1909 | $2,145 | $1.12 | 5d | 1 | 1.27mi |
| 343 Silver Glen Dr Kyle, TX | 3.0 | 2.5 | 1913 | $1,895 | $0.99 | 45d | 1 | 1.29mi |
| 290 Silver Glen Dr Kyle, TX | 3.0 | 2.5 | 2085 | $2,350 | $1.13 | 19d | 1 | 1.30mi |
| 195 Salt Springs Rd Kyle, TX | 4.0 | 2.0 | 1818 | $2,100 | $1.16 | 19d | 1 | 1.32mi |
| 149 Red Sun Dr Kyle, TX | 3.0 | 2.0 | 1421 | $1,850 | $1.30 | 12d | 1 | 1.37mi |
| 126 Avre Loop Kyle, TX | 3.0 | 2.0 | 1230 | $1,700 | $1.38 | 45d | 1 | 1.38mi |
| 112 Lakeview Ct Kyle, TX | 3.0 | 2.5 | 1765 | $1,795 | $1.02 | 6d | 1 | 1.43mi |
| 106 Lakeview Ct Kyle, TX | 3.0 | 2.5 | 1765 | $1,795 | $1.02 | 19d | 1 | 1.43mi |
| 1689 Woodlands Dr Kyle, TX | 4.0 | 2.0 | 1515 | $1,850 | $1.22 | 45d | 1 | 1.45mi |
| 149 Creekside Villa Dr Kyle, TX | 3.0 | 2.0 | 1266 | $1,495 | $1.18 | 16d | 1 | 1.48mi |
| 155 Creekside Villa Dr Kyle, TX | 3.0 | 2.0 | 1266 | $1,695 | $1.34 | 25d | 1 | 1.48mi |
| 155 Creekside Villa Dr Kyle, TX | 3.0 | 2.0 | 1266 | $1,695 | $1.34 | 6d | 1 | 1.48mi |
| 155 Creekside Villa Dr Kyle, TX | 3.0 | 2.0 | 1266 | $1,495 | $1.18 | 16d | 1 | 1.48mi |
Listing history 4 events
-
2026-06-16days on market $240,000 Active 7 DOM
-
2026-06-15days on market $240,000 Active 6 DOM
-
2026-06-13remarks 699-char remark
-
2026-06-13$240,000 Active 4 DOM
ⓘ Source: listings_history table (triggers on properties + properties_extension) + one-shot
backfill from property_details.listing_events for pre-trigger history.
Tax reassessment forecast TX · Resets to sale price
- Current annual tax
- $2,816 · $235/mo
- Projected year-2 tax
- $4,392 · $366/mo
- Expected delta
- +$1,576/yr (+$131/mo · 56.0%)
ⓘ Screening estimate from a state-policy table — verify with the county assessor before closing.
Climate risk First Street
- Flood 1/10 Low FEMA zone X (unshaded) · 0% chance over 30 yrs
- Wildfire 4/10 Moderate
- Heat 8/10 Severe 7 d/yr ≥108°F today · 21 d/yr by 30 yrs out
- Wind 8/10 Severe 80% chance of damaging wind over 30 yrs
- Air quality 2/10 Low 0 unhealthy d/yr today · 1 by 30 yrs out
Nearby sold comps map
Loading sold comps map…
Walkable amenities ~0.75 mi
Loading nearby amenities…
Taxation est. · year 1
- Rental income
- $24,826
- − Mortgage interest
- −$13,444
- − Property taxes
- −$2,816
- − Insurance
- −$1,200
- − Repairs & maintenance
- −$1,986
- − Management
- −$1,986
- − Depreciation
- −$6,982
- Taxable loss
- −$3,588
- Est. tax savings @ 24.0%
- +$861
- After-tax cash flow
- $1,355/yr
For passive investors: Depreciation is non-cash, so a rental often shows a tax loss while cash-flowing — sheltering income. Rental losses are passive: they offset passive income freely, and up to $25,000/yr can offset ordinary (W-2) income if you actively participate and your MAGI is under $100k (phasing out to $0 by $150k); unused losses carry forward. On sale, claimed depreciation is recaptured at up to 25%, and gains may owe capital-gains tax (a 1031 exchange can defer both). Figures are a year-1 estimate at your 24.0% rate — not tax advice; consult a CPA.
Schools (NCES district)
- District
- Hays CISD
- NCES district ID
- 4800010
- Math proficiency
- 35% ▼ -15.00%
- Reading proficiency
- 41% ▼ -5.00%
- Median HH income
- $70,570
- Composite
- 34.78/100
- National rank
- #5118
- State rank
- #390 of 826 in TX
Livability — Kyle
- Score
- 75/100
- State rank
- #138
- US rank
- #3993
Category grades
Schools grade is shown separately in the Schools card above.
Census & demographics
- Census place
- Kyle, TX
- County
- Hays County · 280,138 people
- City population
- 77,531
- Metro
- Austin-Round Rock-Georgetown, TX
- Population (ZIP)
- 77,531
- Household income
- $90,075
- Rent vs Own
- Severe rent burden
- 2552.0
Population outlook (Hays County) Hauer SSP2
- Today (2025)
- 286,948 people
- By 2030
- 336,923 · +17.4%
- By 2040
- 441,894 · +54.0%
- By 2050
- 553,462 · +92.9%
- By 2075
- 838,261 · +192.1%
- By 2100
- 1,063,658 · +270.7%
Race, ethnicity, and origin ACS 2023
- Neighborhood character
- Diverse neighborhood (Simpson 0.56)
- Race & ethnicity
- Hispanic / Latino 55% White 36% Two or more races 29% Black 5% Native American 1%
- Hispanic origin (detail)
- Mexican 47% Puerto Rican 1%
- Common ancestry
- Italian 2% Slovak 2% Lithuanian 1%
- Foreign-born
- 13% · Canada
- Languages at home
- 63% English-only · Spanish 35%
Political lean MEDSL · Hays
- 2024 margin
- Lean D (+5.7) · D 52.1% · R 46.5% · Other 1.4%
- 2008→2024 swing
- +7.7pp toward D · 2008: -2.0pp · 2024: 5.7pp
- All cycles
- 2024: D+5.7 2020: D+10.8 2016: R+0.9 2012: R+10.4 2008: R+2.0
Not yet ingested
- Civics
- —
Market trends
- HPI YoY
- ▼ -92.64%
- Current HPI
- 181.7969
- Rent YoY
- ▼ -0.34%
- Metro
- Austin-Round Rock-Georgetown, TX
- State GDP YoY
- ▲ 3.95%
- F500 in state
- 110
Industry mix (Fortune 500 HQ in TX)
| Industry | F500 HQs | Revenue |
|---|---|---|
| Energy | 16 | $1,198B |
|
||
| Technology | 5 | $198B |
|
||
| Engineering / Construction | 4 | $72B |
|
||
| Energy Services | 3 | $60B |
|
||
| Utilities | 3 | $41B |
|
||
| Healthcare | 2 | $330B |
|
||
Price history
7 events — show timeline
- 2026-06-10 Listed $240,000 Unlock MLS
- 2020-12-15 Sold (Public Records) — Public Records
- 2019-03-20 Sold (Public Records) — Public Records
- 2012-07-16 Delisted — Unlock MLS
- 2012-05-28 Listed — Unlock MLS
- 2004-04-12 Delisted — Unlock MLS
- 2003-11-11 Listed — Unlock MLS
Property tax history
+7.9%/yrLatest (2025): $2,816 · +8.6% YoY. Source: county tax records.
Cash-flow waterfall
monthlySold comps — $/sqft
last 12 mo · ≤1 miLoading sold comps…