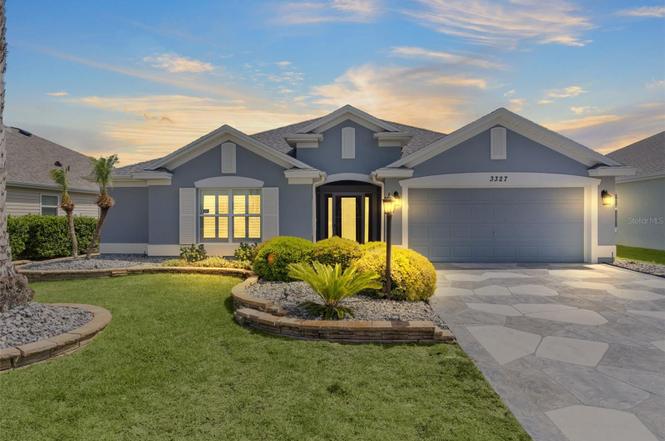
3327 Dalkeith Ter · The Villages, FL
Flood risk 1/10 · Minimal
- FEMA flood zone
- X (unshaded)
- Chance of flooding over 30 yrs
- 0.0%
- Est. flood insurance / yr
- $507 – $1,088
Fire risk 4/10 · Minor
- Est. fire insurance / yr
- $947 – $1,759
Heat risk 9/10 · Severe
- Hot days now (above 108°F)
- 7 days/yr
- Hot days in 30 yrs
- 23 days/yr
Wind risk 9/10 · Severe
- Chance of severe wind over 30 yrs
- 99.0%
Air-quality risk 3/10 · Minor
- Unhealthy air days now
- 2 days/yr
- Unhealthy air days in 30 yrs
- 3 days/yr
Risk factors via First Street. Map © Google.
Why this score? — see what drove the D+ grade
The composite is a weighted blend of 9 inputs, each scored 0–100. Each bar is that input's sub-score; the figure is the points it added to the 100-point composite (weight × sub-score).
- ARV discount +15.0/15.0
- Appreciation +10.0/10.0
- Cash flow +5.6/30.0
- Schools +5.2/10.0
- Livability +3.5/5.0
- Rent growth +2.5/5.0
- Condition / age +2.5/5.0
- 1% rule +1.6/10.0
- DSCR +0.0/10.0
$435,000
🖨 Deal sheet (PDF) 📄 Offer letter ✓ Due diligence
Listing remarks
Under contract-accepting backup offers. One or more photo(s) has been virtually staged. Welcome home to this beautifully maintained 3-bedroom, 2-bath “Holly” model, ideally located in the highly desirable Village of Charlotte. Centrally positioned and gently lived in, this home offers a perfect blend of comfort, style, and convenience. From the moment you arrive, you’ll appreciate the exceptional curb appeal, featuring a stamped concrete driveway and meticulously maintained landscaping. Inside, the home showcases soaring ceilings, laminate flooring, plantation shutters, upgraded lighting and ceiling fans, fresh interior paint, and elegant crown molding throughout. The spac
Key facts
- Primary suite
- Walk-in closets
- Roman shower
Tags
Property features AI
Finance
- Other: CDD present
- Financial info: Total monthly association fees $199 (total annual fees $2,388)
- HOA & community: The Villages association (monthly fee $199); Association fee includes pool; Community features: fitness center, golf carts allowed, golf, park, pool, tennis courts, basketball court, pickleball courts, playground, recreation facilities, trails, street lights; Senior community; Pets allowed; Vehicle restrictions
Exterior
- Parking: Attached 2-car garage (20 x 21) with garage door opener; Driveway
- Security: Key card entry; Smoke detectors
- Utilities: Public water; Public sewer; Cable available and connected; Electricity connected; Phone available; Sprinkler meter; Underground utilities; Water connected
- Home design: Single family residence; One story; Southwest facing; Completed condition
- Construction: Block and stucco construction; Shingle roof; Slab foundation; Built by model 'Holly'
- Exterior features: Front porch (screened); Paved lot; Trees/landscaped; Irrigation system
Interior
- Kitchen: Dishwasher; Disposal; Microwave; Range; Refrigerator; Eat-in kitchen; Solid wood cabinets
- Bedrooms: 3 bedrooms
- Flooring: Carpet; Tile
- Bathrooms: 2 full bathrooms
- Heating & cooling: Central heating (electric); Central air
- Interior features: Built-in features; Ceiling fans; Crown molding; Eat-in kitchen; High ceilings; Open floorplan; Solid wood cabinets; Split bedroom layout; Thermostat; Vaulted ceilings; Walk-in closets; Window treatments; Blinds; Shutters
- Laundry & utility: Inside laundry room; Washer; Dryer; Electric water heater; Inside utility
Neighborhood map
What this means for you Summary
Snapshot
- This is a 3-bed/2.0-bath single-family listed at $435k.
Deal economics
- At list price, monthly cash flow is $-918 ($-11k/yr) — negative.
- To cash-flow at today's rent, offer at most $273k (37.3% below list).
- To meet the 1% rule (rent ≥ 1% of price), the offer needs to be $287k (33.9% below list).
- Recommended offer: $273k (37.3% below list) — sets the bar for cash-flow.
- Cap rate 3.8% vs local median 5.0% in The Villages — below-typical yield; the buyer is paying a premium for something (appreciation thesis, condition, location) that the cap rate doesn't capture.
Location & tenants
- Location reads 70/100 on livability (#431 in FL) — a middle-class / working-renter tenant base. Strengths: schools A+, crime A+, housing A; Watch: amenities F, commute F, health & safety F.
- Sumter (rural): math 61% / reading 61% proficiency, ranked #11 of 73 in FL (top 15%) — acceptable for families but not a draw, mixed tenant base, ~2y average lease.
- Market conditions: 265 active listings in the ZIP; 7 comparable units currently listed for rent nearby; rentals at typical pace (median 22d on market — plan ~3-4 weeks tenant-placement turnaround); solid renter incomes; 3,961 units permitted in Sumter County in 2024 (248 in 5+ unit buildings).
- This rent runs 36% of the median local income ($97k/yr) — at the standard rent-burdened threshold; future hikes will face affordability resistance.
Forward outlook
- In year one you build about $47k of equity ($3k loan paydown + $44k appreciation (10.0% local appreciation)).
- Sumter County population projected at +45% by 2050 — long-run rental-demand tailwind backs the buy-and-hold thesis.
- By year 2, paydown + projected appreciation supports a ~$75k cash-out refi (75% LTV) — recoverable capital for the next deal without selling this one.
Negotiation context
- It's been on market 234 days — a 12% lower offer ($383k) is reasonable based on typical stale-listing flexibility.
- 4 sale attempts since 4y ago with the ask held roughly flat each time — persistent listings suggest the price (not the market) is what's stuck; bring a comps-based counter.
Risks & watch-outs
- Climate carrying-cost: severe wind risk, 99% chance of damaging wind over 30y; extreme-heat days projected 7→23/yr by 2055 (HVAC capex compounding) — expect insurance premiums to compound above CPI over the hold.
Questions for the listing agent
- What do current leases actually rent for vs. the listed asking? Can we see a recent rent roll and the last 12 months of T-12 income?
- It's been on market 234 days. Have you received any prior offers? Is the seller open to a 37% concession, seller financing, or rate buy-down credit?
- What does the HOA fee cover, when was the last increase, and are there any pending special assessments or reserve-fund shortfalls?
- Why hasn't it sold? Are there any deal-killer items the seller is aware of (foundation, flood, title, zoning, code violations)?
- Is there a deadline driving the sale (1031 exchange, divorce, estate, relocation)? That informs how much negotiation room exists.
- Schools are A-rated — typically a magnet for longer-tenancy family renters. What's the average tenant stay here, and is there a school-zone premium baked into asking?
- The area grade is low — what's the realistic commute time and amenity access for the typical tenant pool here? Any planned neighborhood developments (good or bad) we should know about?
- What's the average days-on-market for RENTAL listings here right now (not sales)? A rising rental-DOM trend means longer vacancies and softer asking-rent achievability than the comps imply.
- What's the recent tenant-quality profile in this submarket — average credit score on applications, eviction rate, late-payment / NSF rate, and stable-employment percentage? A property-management company in the area should have these aggregated.
- How much new for-sale + rental construction is in the pipeline within 1–3 miles? Heavy new supply typically softens prices + rents 12–24 months out; constrained supply supports both.
Investment metrics
- 1% rule
- 0.66% ✗
- Cap rate
- 3.76%
- Cash-on-cash
- -9.04%
- DSCR
- 0.60
- GRM
- 12.6
CMA / ARV
- ARV (on-the-fly)
- $592,596
- Comps found
- 12
Show comp detail 12 sales within ~0.75 mi
| Address | Dist | Beds/Ba | Sqft | Sold | Price | $/sf | Match |
|---|---|---|---|---|---|---|---|
| 3258 Sylewood Ave | 0.15mi | 3/2.0 | 1,956 (-8%) | 1mo | $430,000 | $220 | 79 |
| 3436 Countryside Path | 0.33mi | 3/2.0 | 2,013 (-5%) | 0mo | $630,000 | $313 | 76 |
| 3406 Countryside Path | 0.24mi | 3/2.0 | 1,956 (-8%) | 0mo | $415,000 | $212 | 76 |
| 3183 Apollo Ln | 0.50mi | 3/2.0 | 2,050 (-4%) | 2mo | $629,000 | $307 | 69 |
| 1148 Allaire Loop | 0.61mi | 3/2.0 | 2,179 (+3%) | 0mo | $445,000 | $204 | 67 |
| 1198 Reading Rd | 0.58mi | 3/2.5 | 2,168 (+2%) | 1mo | $544,000 | $251 | 67 |
| 909 Vanilla Leaf Pl | 0.48mi | 3/2.0 | 1,939 (-9%) | 1mo | $495,000 | $255 | 62 |
| 1016 Pickering Path | 0.63mi | 3/2.0 | 2,230 (+5%) | 1mo | $675,000 | $303 | 61 |
| 3343 Rabbit Run Path | 0.58mi | 3/2.0 | 1,976 (-7%) | 2mo | $817,000 | $413 | 60 |
| 595 Yarborough Way | 0.56mi | 3/2.0 | 1,965 (-8%) | 2mo | $549,000 | $279 | 60 |
| 3556 Mistletoe Ct | 0.64mi | 3/2.0 | 1,913 (-10%) | 3mo | $610,000 | $319 | 51 |
| 650 Bradford Loop | 0.67mi | 3/2.0 | 1,875 (-12%) | 1mo | $400,000 | $213 | 48 |
Match score weights: distance 35% · size 25% · config 20% · recency 20%. Top-matched comps best support the ARV.
Projected returns pro-forma
10.0% appreciation · 3.0% rent growth · sell at horizon
- IRR
- 17.9%
- Equity multiple
- 2.47×
- Total profit
- $178,602
- Equity at exit
- $391,882
- IRR
- 16.8%
- Equity multiple
- 5.70×
- Total profit
- $572,241
- Equity at exit
- $845,109
Cash invested: $121,800 (down + closing). Projections, not guarantees.
Landlord ↔ Tenant lean methodology
- Overall (STATE)
- 87 Strongly Landlord-Friendly
- State Florida
- 87 Strongly Landlord-Friendly · R+3
- County
- — inherits STATE
- City
- — inherits STATE
ZIP-level market 32163
- Home prices YoY
- 9.8%
- Active inventory
- 265
- Price-to-rent
- 12.6×
Monthly cashflow live
- Estimated rent
- $2,875 high interval (Pro) →
- Mortgage (P&I)
- −$2,281
- Tax from tax record
- −$528 /mo · $6,332/yr
- Insurance
- −$181
- HOA
- −$199
- Vacancy / Maint / Mgmt
- −$604
- Net cashflow
- $-918
Break-even live
Sensitivity live
| Price | -10% $-672 | -5% $-795 | +0% $-918 | +5% $-1,041 | +10% $-1,164 |
|---|---|---|---|---|---|
| Rent | -10% $-1,145 | -5% $-1,032 | +0% $-918 | +5% $-804 | +10% $-691 |
| Rate | -1.0pp $-699 | -0.5pp $-807 | base $-918 | +0.5pp $-1,031 | +1.0pp $-1,145 |
UW: 25.0% down · 7.5% · 30yr · 1.5% tax · 5.0% vac · 8.0% maint · 8.0% mgmt
Financing live
Cash to close
- Down payment
- $108,750
- Closing costs
- $13,050
- Reserves months
- —
- Total cash needed
- —
Loan-product check · same deal, 3 products live
Conventional
25% down · 7.5% · 30yr
- Down + closing
- —
- Monthly P&I
- —
- Monthly cashflow
- —
- DSCR
- —
- Eligible?
- —
Personal DTI + credit; lowest rate.
DSCR
20% down · 8.5% · 30yr
- Down + closing
- —
- Monthly P&I
- —
- Monthly cashflow
- —
- DSCR
- —
- Eligible?
- —
No personal income docs; deal must DSCR.
Hard money
10% down · 12.0% · 12mo
- Down + closing
- —
- Monthly P&I
- —
- Monthly cashflow
- —
- DSCR
- —
- Eligible?
- —
Short-term bridge; refi at stabilization.
Rent comps 7 comps
| Address | Beds | Baths | Sqft | Rent | $/sqft | DOM | Units | Dist |
|---|---|---|---|---|---|---|---|---|
| 3068 Islawild Way The Villages, FL | 3.0 | 2.0 | 1542 | $2,200 | $1.43 | 21d | 1 | 0.37mi |
| 3314 Abana Path Unit 1525266P The Villages, FL | 3.0 | 2.0 | 1571 | $1,770 | $1.13 | 21d | 1 | 0.45mi |
| 798 Journey Ln The Villages, FL | 3.0 | 2.0 | 1551 | $2,300 | $1.48 | 21d | 1 | 0.56mi |
| 2875 Rain Lily Loop The Villages, FL | 3.0 | 2.0 | 1965 | $4,490 | $2.28 | 21d | 1 | 0.64mi |
| 3394 Ridgewood Path The Villages, FL | 3.0 | 2.0 | 1559 | $4,000 | $2.57 | 21d | 1 | 1.10mi |
| 1109 Alcove Loop The Villages, FL | 3.0 | 2.0 | 1970 | $3,000 | $1.52 | 21d | 1 | 1.19mi |
| 3225 Wise Way The Villages, FL | 3.0 | 2.0 | 1652 | $2,650 | $1.60 | 24d | 1 | 1.31mi |
HOA detail
- Monthly dues
- $199 · $2,388/yr
- Likely covers
- landscaping
Listing history 24 events
-
2026-06-09status $435,000 Pending 234 DOM
-
2026-06-08days on market $435,000 Active 234 DOM
-
2026-06-07days on market $435,000 Active 233 DOM
-
2026-06-02days on market $435,000 Active 228 DOM
-
2026-06-01days on market $435,000 Active 227 DOM
-
2026-05-31days on market $435,000 Active 226 DOM
-
2026-05-30days on market $435,000 Active 225 DOM
-
2026-05-04price $435,000
-
2026-04-16status Active
-
2026-04-16price $445,000
-
2026-04-16historical
-
2026-04-15$445,000 Active
-
2026-04-02historical
-
2026-03-13price $449,900
-
2026-02-23price $455,000
-
2025-11-14price $465,000
-
2025-11-05price $475,000
-
2025-10-03$485,000 Active
-
2023-04-28soldstatus $437,500
-
2022-08-11status Pending
-
2022-08-10historical
-
2022-07-08price $529,500
-
2022-05-26price $539,500
-
2022-05-12$559,000 Active
ⓘ Source: listings_history table (triggers on properties + properties_extension) + one-shot
backfill from property_details.listing_events for pre-trigger history.
Tax reassessment forecast FL · Resets to sale price
- Current annual tax
- $6,332 · $528/mo
- Projected year-2 tax
- $6,332 · $528/mo
- Expected delta
- $0/yr ($0/mo · 0.0%)
ⓘ Screening estimate from a state-policy table — verify with the county assessor before closing.
Climate risk First Street
- Flood 1/10 Low FEMA zone X (unshaded) · 0% chance over 30 yrs
- Wildfire 4/10 Moderate
- Heat 9/10 Extreme 7 d/yr ≥108°F today · 23 d/yr by 30 yrs out
- Wind 9/10 Extreme 99% chance of damaging wind over 30 yrs
- Air quality 3/10 Moderate 2 unhealthy d/yr today · 3 by 30 yrs out
Nearby sold comps map
Loading sold comps map…
Walkable amenities ~0.75 mi
Loading nearby amenities…
Taxation est. · year 1
- Rental income
- $34,498
- − Mortgage interest
- −$24,367
- − Property taxes
- −$6,332
- − Insurance
- −$2,175
- − Repairs & maintenance
- −$2,760
- − Management
- −$2,760
- − HOA
- −$2,388
- − Depreciation
- −$12,655
- Taxable loss
- −$18,938
- Est. tax savings @ 24.0%
- +$4,545
- After-tax cash flow
- $-6,471/yr
For passive investors: Depreciation is non-cash, so a rental often shows a tax loss while cash-flowing — sheltering income. Rental losses are passive: they offset passive income freely, and up to $25,000/yr can offset ordinary (W-2) income if you actively participate and your MAGI is under $100k (phasing out to $0 by $150k); unused losses carry forward. On sale, claimed depreciation is recaptured at up to 25%, and gains may owe capital-gains tax (a 1031 exchange can defer both). Figures are a year-1 estimate at your 24.0% rate — not tax advice; consult a CPA.
Schools (NCES district)
- District
- Sumter
- NCES district ID
- 1201800
- Math proficiency
- 61% ▼ -4.00%
- Reading proficiency
- 61% ▼ -2.00%
- Median HH income
- $48,240
- Composite
- 51.74/100
- National rank
- #1682
- State rank
- #11 of 73 in FL
Livability — The Villages
- Score
- 70/100
- State rank
- #431
- US rank
- #7363
Category grades
Schools grade is shown separately in the Schools card above.
Census & demographics
- Census place
- The Villages, FL
- County
- Sumter County · 110,591 people
- City population
- 83,973
- Metro
- The Villages, FL
- Population (ZIP)
- 28,549
- Household income
- $96,775
- Rent vs Own
- Severe rent burden
- 307.0
Population outlook (Sumter County) Hauer SSP2
- Today (2025)
- 161,172 people
- By 2030
- 180,083 · +11.7%
- By 2040
- 209,892 · +30.2%
- By 2050
- 234,186 · +45.3%
- By 2075
- 284,602 · +76.6%
- By 2100
- 317,039 · +96.7%
Race, ethnicity, and origin ACS 2023
- Neighborhood character
- Predominantly White (95%)
- Race & ethnicity
- White 95% Two or more races 2% Hispanic / Latino 2% Asian 1%
- Common ancestry
- Romanian 6% Lithuanian 3% Iranian 3%
- Foreign-born
- 6% · Canada, Vietnam
- Languages at home
- 96% English-only · Spanish 2% Vietnamese 1% Other Indo-European 0%
Political lean MEDSL · Sumter
- 2024 margin
- Solid R (+37.6) · D 30.9% · R 68.6%
- 2008→2024 swing
- -10.6pp toward R · 2008: -27.0pp · 2024: -37.6pp
- All cycles
- 2024: R+37.6 2020: R+36.1 2016: R+39.2 2012: R+34.9 2008: R+27.0
Not yet ingested
- Civics
- —
Market trends
- HPI YoY
- ▲ 20.47%
- Current HPI
- 229.0075
- Rent YoY
- —
- Metro
- The Villages, FL
- State GDP YoY
- ▲ 3.28%
- F500 in state
- 36
Industry mix (Fortune 500 HQ in FL)
| Industry | F500 HQs | Revenue |
|---|---|---|
| Industrial Technology | 2 | $29B |
|
||
| Insurance | 2 | $17B |
|
||
| Retail | 1 | $60B |
|
||
| Technology Distribution | 1 | $58B |
|
||
| Homebuilding | 1 | $35B |
|
||
| Technology Manufacturing | 1 | $35B |
|
||
Price history
-22.2% since first listed17 events — show timeline
- 2026-05-04 Price Changed $435,000 Stellar MLS as Distributed by MLS Grid
- 2026-04-16 Relisted — Stellar MLS as Distributed by MLS Grid
- 2026-04-16 Price Changed $445,000 Stellar MLS as Distributed by MLS Grid
- 2026-04-16 Listing Removed — Stellar MLS as Distributed by MLS Grid
- 2026-04-15 Listed $445,000 Stellar MLS as Distributed by MLS Grid
- 2026-04-02 Listing Removed — Stellar MLS as Distributed by MLS Grid
- 2026-03-13 Price Changed $449,900 Stellar MLS as Distributed by MLS Grid
- 2026-02-23 Price Changed $455,000 Stellar MLS as Distributed by MLS Grid
- 2025-11-14 Price Changed $465,000 Stellar MLS as Distributed by MLS Grid
- 2025-11-05 Price Changed $475,000 Stellar MLS as Distributed by MLS Grid
- 2025-10-03 Listed $485,000 Stellar MLS as Distributed by MLS Grid
- 2023-04-28 Sold (Public Records) $437,500 Public Records
- 2022-08-11 Pending — Stellar MLS as Distributed by MLS Grid
- 2022-08-10 Listing Removed — Stellar MLS as Distributed by MLS Grid
- 2022-07-08 Price Changed $529,500 Stellar MLS as Distributed by MLS Grid
- 2022-05-26 Price Changed $539,500 Stellar MLS as Distributed by MLS Grid
- 2022-05-12 Listed $559,000 Stellar MLS as Distributed by MLS Grid
Property tax history
+6.6%/yrLatest (2025): $6,332 · -1.1% YoY. Source: county tax records.
Cash-flow waterfall
monthlySold comps — $/sqft
last 12 mo · ≤1 miLoading sold comps…