 🏗️ New Construction
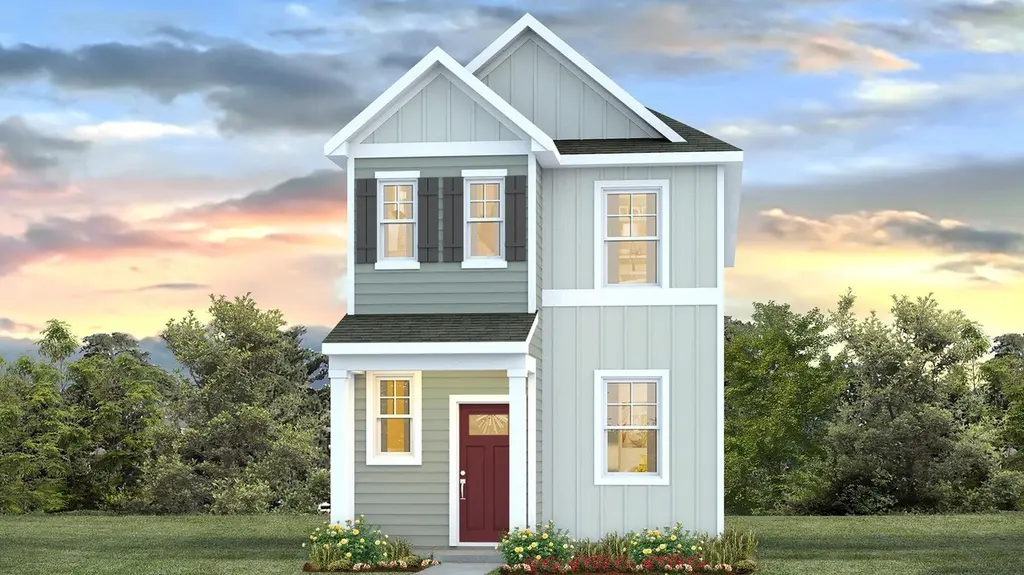
NEWPORT Plan · Holden Beach, NC
Flood risk No data
- FEMA flood zone
- —
- Chance of flooding over 30 yrs
- —
- Est. flood insurance / yr
- —
Fire risk No data
- Est. fire insurance / yr
- —
Heat risk No data
- Hot days now (above threshold)
- —
- Hot days in 30 yrs
- —
Wind risk No data
- Chance of severe wind over 30 yrs
- —
Air-quality risk No data
- Unhealthy air days now
- —
- Unhealthy air days in 30 yrs
- —
Risk factors via First Street. Map © Google.
Why this score? — see what drove the D grade
The composite is a weighted blend of 9 inputs, each scored 0–100. Each bar is that input's sub-score; the figure is the points it added to the 100-point composite (weight × sub-score).
- Cash flow +13.5/30.0
- ARV discount +7.5/15.0
- Condition / age +5.0/5.0
- DSCR +4.1/10.0
- Schools +3.9/10.0
- 1% rule +3.8/10.0
- Livability +3.2/5.0
- Rent growth +2.5/5.0
- Appreciation +0.0/10.0
$225,990
🖨 Deal sheet 📄 Offer letter ✓ Due diligence
Listing remarks
Welcome to Fox Run in Supply, NC Now selling in beautiful Supply, North Carolina, Fox Run offers thoughtfully designed new homes for every stage of life. With a wide variety of floor plans ranging from 989 to 2,203 square feet, this welcoming community features modern layouts, great included features, and our industry-leading Smart Home technology package designed for today's connected lifestyle. Conveniently located off Mt. Pisgah SW in Brunswick County, Fox Run places you close to everything you love about coastal Carolina living. Enjoy a short drive to Holden Beach and Ocean Isle Beach for sunny days by the water, or head to nearby Shallotte for convenient shopping, dining, and everyda
Key facts
- Nearby shallotte
- Listed 28 days
Tags
Property features AI
Finance
- Financial info: List price $225,990
Exterior
- Home design: Single-family plan (NEWPORT)
- Exterior features: Living area approximately 1,582; Address: 4029 Chase Dr SW, Supply, NC 28462
Interior
- Bedrooms: 3 bedrooms
- Bathrooms: 3 full bathrooms and 1 half bathroom
- Interior features: Plan: NEWPORT; Active listing
Neighborhood map
What this means for you Summary
Snapshot
- This is a 3-bed/3.5-bath single-family listed at $226k. Condition is rated excellent.
Deal economics
- At list price, monthly cash flow is $9 ($108/yr) — positive.
- The deal already cash-flows at list — no discount required.
- To meet the 1% rule (rent ≥ 1% of price), the offer needs to be $199k (12.0% below list).
- Recommended offer: $199k (12.0% below list) — sets the bar for 1% rule.
- Cap rate 6.3% vs local median 3.1% in Holden Beach — top-decile yield for the area; either an underpriced asset or a hidden risk that comps aren't pricing in. Stress-test before assuming the spread holds.
Location & tenants
- Location reads 65/100 on livability (#334 in NC) — a middle-class / working-renter tenant base. Strengths: employment A+, crime A, housing A; Watch: schools C-, cost of living D, health & safety D.
- Brunswick County Schools (rural): math 45% / reading 47% proficiency, ranked #82 of 178 in NC (top 46%) — families likely to look elsewhere, expect single-tenant / working-renter base with shorter leases.
- Market conditions: 506 active listings in the ZIP; 6,112 units permitted in Brunswick County in 2024 (990 in 5+ unit buildings).
- This rent runs 40% of the median local income ($60k/yr) — at the standard rent-burdened threshold; future hikes will face affordability resistance.
Forward outlook
- Local home prices are declining (-3.0%/yr); year-one equity from $2k of loan paydown is wiped out by about $7k of value loss. Plan a longer hold.
- Brunswick County population projected at +36% by 2050 — long-run rental-demand tailwind backs the buy-and-hold thesis.
Negotiation context
- It's been on market 28 days — a 2% lower offer ($223k) is reasonable based on typical stale-listing flexibility.
Questions for the listing agent
- Is there a deadline driving the sale (1031 exchange, divorce, estate, relocation)? That informs how much negotiation room exists.
- The area grade is low — what's the realistic commute time and amenity access for the typical tenant pool here? Any planned neighborhood developments (good or bad) we should know about?
- What's the average days-on-market for RENTAL listings here right now (not sales)? A rising rental-DOM trend means longer vacancies and softer asking-rent achievability than the comps imply.
- What's the recent tenant-quality profile in this submarket — average credit score on applications, eviction rate, late-payment / NSF rate, and stable-employment percentage? A property-management company in the area should have these aggregated.
- How much new for-sale + rental construction is in the pipeline within 1–3 miles? Heavy new supply typically softens prices + rents 12–24 months out; constrained supply supports both.
Investment metrics
- 1% rule
- 0.88% ✗
- Cap rate
- 6.34%
- Cash-on-cash
- 0.17%
- DSCR
- 1.01
- GRM
- 9.5
CMA / ARV
No comps found within radius.
Projected returns pro-forma
-3.0% appreciation · 3.0% rent growth · sell at horizon
- IRR
- -16.0%
- Equity multiple
- 0.43×
- Total profit
- $-36,017
- Equity at exit
- $33,696
- IRR
- -7.6%
- Equity multiple
- 0.52×
- Total profit
- $-30,503
- Equity at exit
- $19,539
Cash invested: $63,277 (down + closing). Projections, not guarantees.
Landlord ↔ Tenant lean methodology
- Overall (STATE)
- 85 Strongly Landlord-Friendly
- State North Carolina
- 85 Strongly Landlord-Friendly · R+3
- County
- — inherits STATE
- City
- — inherits STATE
ZIP-level market 28462
- Active inventory
- 506
- Price-to-rent
- 9.5×
Monthly cashflow live
- Estimated rent
- $1,988 medium interval (Pro) →
- Mortgage (P&I)
- −$1,185
- Tax est. 1.5%
- −$282 /mo · $3,390/yr
- Insurance
- −$94
- HOA
- −$0
- Vacancy / Maint / Mgmt
- −$418
- Net cashflow
- $9
Break-even live
UW: 25.0% down · 7.5% · 30yr · 1.5% tax · 5.0% vac · 8.0% maint · 8.0% mgmt
Financing live
Cash to close
- Down payment
- $56,498
- Closing costs
- $6,780
- Reserves months
- —
- Total cash needed
- —
Loan-product check · same deal, 3 products live
Conventional
25% down · 7.5% · 30yr
- Down + closing
- —
- Monthly P&I
- —
- Monthly cashflow
- —
- DSCR
- —
- Eligible?
- —
Personal DTI + credit; lowest rate.
DSCR
20% down · 8.5% · 30yr
- Down + closing
- —
- Monthly P&I
- —
- Monthly cashflow
- —
- DSCR
- —
- Eligible?
- —
No personal income docs; deal must DSCR.
Hard money
10% down · 12.0% · 12mo
- Down + closing
- —
- Monthly P&I
- —
- Monthly cashflow
- —
- DSCR
- —
- Eligible?
- —
Short-term bridge; refi at stabilization.
Listing history 16 events
-
2026-06-18days on market $225,990 Active 28 DOM
-
2026-06-17days on market $225,990 Active 27 DOM
-
2026-06-16days on market $225,990 Active 26 DOM
-
2026-06-15days on market $225,990 Active 25 DOM
-
2026-06-14days on market $225,990 Active 23 DOM
-
2026-06-13days on market $225,990 Active 22 DOM
-
2026-06-10days on market $225,990 Active 20 DOM
-
2026-06-09days on market $225,990 Active 19 DOM
-
2026-06-08days on market $225,990 Active 18 DOM
-
2026-06-07days on market $225,990 Active 17 DOM
-
2026-06-05days on market $225,990 Active 14 DOM
-
2026-06-03days on market $225,990 Active 13 DOM
-
2026-06-02days on market $225,990 Active 12 DOM
-
2026-06-01days on market $225,990 Active 11 DOM
-
2026-05-31days on market $225,990 Active 10 DOM
-
2026-05-30days on market $225,990 Active 9 DOM
ⓘ Source: listings_history table (triggers on properties + properties_extension) + one-shot
backfill from property_details.listing_events for pre-trigger history.
Nearby sold comps map
Loading sold comps map…
Walkable amenities ~0.75 mi
Loading nearby amenities…
Taxation est. · year 1
- Rental income
- $23,860
- − Mortgage interest
- −$12,659
- − Property taxes
- −$3,390
- − Insurance
- −$1,130
- − Repairs & maintenance
- −$1,909
- − Management
- −$1,909
- − Depreciation
- −$6,574
- Taxable loss
- −$3,711
- Est. tax savings @ 24.0%
- +$891
- After-tax cash flow
- $999/yr
For passive investors: Depreciation is non-cash, so a rental often shows a tax loss while cash-flowing — sheltering income. Rental losses are passive: they offset passive income freely, and up to $25,000/yr can offset ordinary (W-2) income if you actively participate and your MAGI is under $100k (phasing out to $0 by $150k); unused losses carry forward. On sale, claimed depreciation is recaptured at up to 25%, and gains may owe capital-gains tax (a 1031 exchange can defer both). Figures are a year-1 estimate at your 24.0% rate — not tax advice; consult a CPA.
Condition & rehab AI · 4 photos
This home is in excellent condition with no visible repairs or maintenance needed. It is move-in ready and offers modern amenities and a beautiful curb appeal.
Value-add opportunities
- Both Smart Home technology package — Enhances modern living and attracts tech-savvy buyers
- Both Landscaping improvements — Enhances curb appeal and attracts buyers
- Both Interior updates — Modernizes the interior and attracts buyers
Renovation cost estimate screening
Value-add ROI direction
- Both Smart Home technology package — Enhances modern living and attracts tech-savvy buyers ↑
- Both Landscaping improvements — Enhances curb appeal and attracts buyers ↑
- Both Interior updates — Modernizes the interior and attracts buyers ↑
ⓘ Cost ranges are severity-bucket heuristics (US national rule-of-thumb). Get contractor quotes + a written scope before underwriting a rehab budget.
Schools (NCES district)
- District
- Brunswick County Schools
- NCES district ID
- 3700420
- Math proficiency
- 45% ▲ 4.00%
- Reading proficiency
- 47% ▲ 4.00%
- Median HH income
- $47,494
- Composite
- 39.23/100
- National rank
- #4011
- State rank
- #82 of 178 in NC
Livability — Holden Beach
- Score
- 65/100
- State rank
- #334
- US rank
- #13586
Category grades
Schools grade is shown separately in the Schools card above.
Census & demographics
- County
- Brunswick County · 131,536 people
- Metro
- Myrtle Beach-Conway-North Myrtle Beach, SC-NC
- Population (ZIP)
- 12,340
- Household income
- $60,349
- Rent vs Own
- Severe rent burden
- 269.0
Population outlook (Brunswick County) Hauer SSP2
- Today (2025)
- 152,111 people
- By 2030
- 165,705 · +8.9%
- By 2040
- 188,494 · +23.9%
- By 2050
- 206,228 · +35.6%
- By 2075
- 237,876 · +56.4%
- By 2100
- 251,451 · +65.3%
Race, ethnicity, and origin ACS 2023
- Neighborhood character
- Predominantly White (87%)
- Race & ethnicity
- White 87% Black 7% Two or more races 5% Hispanic / Latino 2%
- Common ancestry
- Slovak 4% Lithuanian 4% Serbian 2%
- Foreign-born
- 1% · Canada
- Languages at home
- 99% English-only · Spanish 1%
Political lean MEDSL · Brunswick
- 2024 margin
- Strong R (+24.9) · D 37.2% · R 62.0%
- 2008→2024 swing
- -6.9pp toward R · 2008: -17.9pp · 2024: -24.9pp
- All cycles
- 2024: R+24.9 2020: R+25.0 2016: R+28.7 2012: R+22.2 2008: R+17.9
Not yet ingested
- Civics
- —
Market trends
- HPI YoY
- ▼ -259.44%
- Current HPI
- 144.2462
- Rent YoY
- —
- Metro
- Myrtle Beach-Conway-North Myrtle Beach, SC-NC
- State GDP YoY
- ▲ 3.28%
- F500 in state
- 26
Industry mix (Fortune 500 HQ in NC)
| Industry | F500 HQs | Revenue |
|---|---|---|
| Financial Services | 2 | $213B |
|
||
| Retail | 2 | $95B |
|
||
| Industrial Conglomerate | 1 | $38B |
|
||
| Metals / Steel | 1 | $35B |
|
||
| Utilities | 1 | $30B |
|
||
| Industrial Machinery | 1 | $19B |
|
||
Cash-flow waterfall
monthlySold comps — $/sqft
last 12 mo · ≤1 miLoading sold comps…