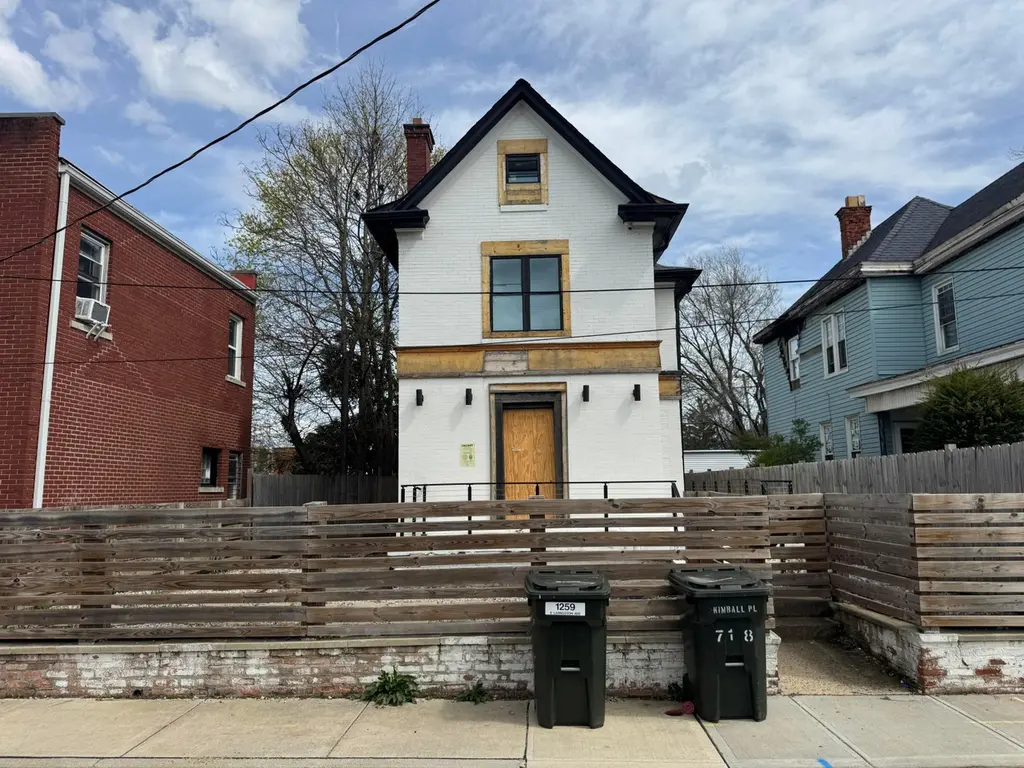
856 Ellsworth Ave · Columbus, OH
Flood risk 1/10 · Minimal
- FEMA flood zone
- X (unshaded)
- Chance of flooding over 30 yrs
- 0.0%
- Est. flood insurance / yr
- $473 – $860
Fire risk 1/10 · Minimal
- Est. fire insurance / yr
- $713 – $1,323
Heat risk 3/10 · Minor
- Hot days now (above 100°F)
- 7 days/yr
- Hot days in 30 yrs
- 17 days/yr
Wind risk 2/10 · Minimal
- Chance of severe wind over 30 yrs
- 1.0%
Air-quality risk 3/10 · Minor
- Unhealthy air days now
- 2 days/yr
- Unhealthy air days in 30 yrs
- 3 days/yr
Risk factors via First Street. Map © Google.
Why this score? — see what drove the D grade
The composite is a weighted blend of 9 inputs, each scored 0–100. Each bar is that input's sub-score; the figure is the points it added to the 100-point composite (weight × sub-score).
- Cash flow +15.0/30.0
- ARV discount +7.5/15.0
- 1% rule +5.0/10.0
- DSCR +5.0/10.0
- Livability +4.0/5.0
- Rent growth +3.4/5.0
- Condition / age +2.5/5.0
- Schools +1.7/10.0
- Appreciation +0.0/10.0
$40,000
🖨 Deal sheet 📄 Offer letter ✓ Due diligence
Listing remarks
Court Appointed Receiver Sale - 856 Ellsworth Avenue, a great opportunity in Columbus to add value or apply your own personal finishes. Property offers 2 bedrooms, 2 full bathrooms and 1 half bathroom, 1,578 SF, situated on 0.217 acres. The home includes a full partially finished basement, a fenced yard with large rear deck and a parking space. Open layout with tiled bathrooms and a vaulted master.
Key facts
- 8,712 sq ft lot
- Built 1900
- Listed 28 days
Property features AI
Finance
- Other: Property offered via auction
Exterior
- Parking: On-street parking
- Utilities: Public water; Public sewer
- Home design: Single-family residence; Two levels; No common walls; Built in 1900
- Construction: Poured foundation; Original construction year 1900
- Exterior features: Poured foundation; Lot approximately 0.2 acres
Interior
- Bedrooms: 2 main-level bedrooms
- Bathrooms: 4 full bathrooms; 1 half bathroom (4.5 total)
- Interior features: Full basement; Building area ~1578 (source: Realist)
Neighborhood map
What this means for you Summary
Snapshot
- This is a 3-bed/1.0-bath single-family listed at $40k.
Deal economics
- At list price, monthly cash flow is $1k ($13k/yr) — positive.
- The deal already cash-flows at list — no discount required.
- Meets the 1% rule at list price ($2k rent vs $40k).
- Recommended offer: $39k (1.5% below list) — sets the bar for market timing.
- Cap rate 38.9% vs local median 3.8% in Columbus — top-decile yield for the area; either an underpriced asset or a hidden risk that comps aren't pricing in. Stress-test before assuming the spread holds.
Location & tenants
- Location reads 81/100 on livability (#97 in OH, #1,491 nationally) — a professional / high-income tenant draw. Strengths: commute A+, cost of living A+, housing A+; Watch: employment C-, crime F.
- Columbus City School District (urban): math 15% / reading 26% proficiency, ranked #626 of 656 in OH (top 95%) — low school quality limits family demand, transient renter base, plan for 1-2y turnover; 72% free/reduced lunch — lower-income household profile, screen leases tightly.
- Market conditions: Rents rising (+3.5%/yr); 193 active listings in the ZIP; 40 comparable units currently listed for rent nearby; rentals at typical pace (median 24d on market — plan ~3-4 weeks tenant-placement turnaround); 45% of comp listings sitting > 30 days — soft ceiling on asking rent; solid renter incomes; 8,139 units permitted in Franklin County in 2024 (5,940 in 5+ unit buildings).
Forward outlook
- Local home prices are declining (-3.0%/yr); year-one equity from $277 of loan paydown is wiped out by about $1k of value loss. Plan a longer hold.
- Franklin County population projected at +34% by 2050 — long-run rental-demand tailwind backs the buy-and-hold thesis.
- At projected returns (-3.0% appreciation + 3.5% rent growth), your $11k cash investment doubles in ~1 year — after that, you're playing with house money.
Negotiation context
- It's been on market 28 days — a 2% lower offer ($39k) is reasonable based on typical stale-listing flexibility.
- 11 sale attempts since 10y ago with the ask held roughly flat each time — persistent listings suggest the price (not the market) is what's stuck; bring a comps-based counter.
Risks & watch-outs
- Watch-outs: built in 1900 — expect roof / HVAC / electrical / plumbing capex.
Questions for the listing agent
- Built in 1900 — when were the roof, HVAC, electrical panel, plumbing, and water heater last replaced?
- Is there a deadline driving the sale (1031 exchange, divorce, estate, relocation)? That informs how much negotiation room exists.
- Crime grade is F in this area — have there been break-ins, vandalism, or insurance claims at this property in the last 3 years? What carrier currently insures it and at what premium?
- The area grade is low — what's the realistic commute time and amenity access for the typical tenant pool here? Any planned neighborhood developments (good or bad) we should know about?
- What's the average days-on-market for RENTAL listings here right now (not sales)? A rising rental-DOM trend means longer vacancies and softer asking-rent achievability than the comps imply.
- What's the recent tenant-quality profile in this submarket — average credit score on applications, eviction rate, late-payment / NSF rate, and stable-employment percentage? A property-management company in the area should have these aggregated.
- How much new for-sale + rental construction is in the pipeline within 1–3 miles? Heavy new supply typically softens prices + rents 12–24 months out; constrained supply supports both.
Investment metrics
- 1% rule
- 4.31% ✓
- Cap rate
- 38.85%
- Cash-on-cash
- 116.28%
- DSCR
- 6.17
- GRM
- 1.9
CMA / ARV
- ARV (on-the-fly)
- $266,682
- Comps found
- 12
Show comp detail 12 sales within ~0.75 mi
| Address | Dist | Beds/Ba | Sqft | Sold | Price | $/sf | Match |
|---|---|---|---|---|---|---|---|
| 1005 Studer Ave | 0.34mi | 3/2.5 | 1,544 (-2%) | 2mo | $272,900 | $177 | 73 |
| 675 Oakwood Ave | 0.49mi | 3/1.0 | 1,631 (+3%) | 1mo | $153,000 | $94 | 71 |
| 1029 Geers Ave | 0.31mi | 2/1.0 (-1) | 1,412 (-10%) | 1mo | $235,000 | $166 | 62 |
| 795 S Ohio Ave | 0.60mi | 3/2.5 | 1,535 (-3%) | 2mo | $340,000 | $221 | 60 |
| 1129 Oakwood Ave | 0.67mi | 3/2.5 | 1,540 (-2%) | 2mo | $327,500 | $213 | 58 |
| 1570 E Rich St | 0.72mi | 3/2.5 | 1,460 (-8%) | 2mo | $385,000 | $264 | 46 |
| 1327 E Fulton St | 0.44mi | 2/2.5 (-1) | 1,368 (-13%) | 2mo | $199,000 | $145 | 45 |
| 518 Kelton Ave | 0.51mi | 2/2.5 (-1) | 1,368 (-13%) | 1mo | $199,000 | $145 | 42 |
| 935 S Ohio Ave | 0.64mi | 4/2.5 (+1) | 1,735 (+10%) | 1mo | $330,000 | $190 | 42 |
| 489 Lilley Ave | 0.56mi | 2/2.5 (-1) | 1,368 (-13%) | 2mo | $199,000 | $145 | 39 |
| 987 E Whittier St | 0.64mi | 2/2.0 (-1) | 1,798 (+14%) | 0mo | $235,000 | $131 | 38 |
| 827 S 22nd St | 0.67mi | 4/3.0 (+1) | 1,777 (+13%) | 1mo | $300,000 | $169 | 34 |
Match score weights: distance 35% · size 25% · config 20% · recency 20%. Top-matched comps best support the ARV.
Projected returns pro-forma
-3.0% appreciation · 3.51% rent growth · sell at horizon
- IRR
- —
- Equity multiple
- 6.67×
- Total profit
- $63,556
- Equity at exit
- $5,964
- IRR
- —
- Equity multiple
- 14.23×
- Total profit
- $148,141
- Equity at exit
- $3,458
Cash invested: $11,200 (down + closing). Projections, not guarantees.
Landlord ↔ Tenant lean methodology
- Overall (STATE)
- 73 Landlord-Friendly
- State Ohio
- 73 Landlord-Friendly · R+6
- County
- — inherits STATE
- City
- — inherits STATE
ZIP-level market 43206
- Rents YoY
- 3.5%
- Active inventory
- 193
- Price-to-rent
- 1.9×
Monthly cashflow live
- Estimated rent
- $1,724 high interval (Pro) →
- Mortgage (P&I)
- −$210
- Tax est. 1.5%
- −$50 /mo · $600/yr
- Insurance
- −$17
- HOA
- −$0
- Vacancy / Maint / Mgmt
- −$362
- Net cashflow
- $1,085
Break-even live
UW: 25.0% down · 7.5% · 30yr · 1.5% tax · 5.0% vac · 8.0% maint · 8.0% mgmt
Financing live
Cash to close
- Down payment
- $10,000
- Closing costs
- $1,200
- Reserves months
- —
- Total cash needed
- —
Loan-product check · same deal, 3 products live
Conventional
25% down · 7.5% · 30yr
- Down + closing
- —
- Monthly P&I
- —
- Monthly cashflow
- —
- DSCR
- —
- Eligible?
- —
Personal DTI + credit; lowest rate.
DSCR
20% down · 8.5% · 30yr
- Down + closing
- —
- Monthly P&I
- —
- Monthly cashflow
- —
- DSCR
- —
- Eligible?
- —
No personal income docs; deal must DSCR.
Hard money
10% down · 12.0% · 12mo
- Down + closing
- —
- Monthly P&I
- —
- Monthly cashflow
- —
- DSCR
- —
- Eligible?
- —
Short-term bridge; refi at stabilization.
Rent comps 40 comps
| Address | Beds | Baths | Sqft | Rent | $/sqft | DOM | Units | Dist |
|---|---|---|---|---|---|---|---|---|
| 908 Ellsworth Ave Columbus, OH | 3.0 | 1.0 | 1154 | $1,325 | $1.15 | 3d | 1 | 0.08mi |
| 904 Studer Ave Columbus, OH | 3.0 | 1.5 | 1364 | $1,780 | $1.30 | 23d | 1 | 0.21mi |
| 883 Studer Ave Columbus, OH | 4.0 | 2.5 | 2217 | $2,500 | $1.13 | 1d | 1 | 0.22mi |
| 773-775 Berkeley Rd Columbus, OH | 3.0 | 1.0 | 1280 | $1,400 | $1.09 | 21d | 1 | 0.24mi |
| 773-775 Berkeley Rd Columbus, OH | 3.0 | 1.0 | 1280 | $1,350 | $1.05 | 1d | 1 | 0.24mi |
| 1026 Ellsworth Ave Columbus, OH | 3.0 | 1.0 | 1100 | $1,295 | $1.18 | 19d | 1 | 0.25mi |
| 932 Linwood Ave Columbus, OH | 4.0 | 1.5 | 1663 | $2,045 | $1.23 | 43d | 1 | 0.30mi |
| 1275-1279 E Kossuth St Columbus, OH | 2.0 | 2.0 | 1160 | $1,350 | $1.16 | 43d | 1 | 0.31mi |
| 1272 Kent St Columbus, OH | 2.0 | 1.0 | 1152 | $1,250 | $1.09 | 1d | 1 | 0.31mi |
| 1272 Kent St Unit 2 Columbus, OH | 2.0 | 1.0 | 1152 | $1,295 | $1.12 | 21d | 1 | 0.31mi |
| 813 Wilson Ave Unit 1 Columbus, OH | 3.0 | 1.5 | 1400 | $1,500 | $1.07 | 7d | 1 | 0.35mi |
| 815 Wilson Ave Columbus, OH | 3.0 | 1.5 | 1400 | $1,500 | $1.07 | 7d | 1 | 0.35mi |
| 988 Linwood Ave Columbus, OH | 4.0 | 3.0 | 1800 | $2,750 | $1.53 | 17d | 1 | 0.35mi |
| 857 Wilson Ave #859 Columbus, OH | 3.0 | 2.5 | 1527 | $1,650 | $1.08 | 43d | 1 | 0.36mi |
| 1106 Ellsworth Ave Columbus, OH | 3.0 | 1.0 | 1150 | $1,495 | $1.30 | 7d | 1 | 0.37mi |
| 736 Seymour Ave Columbus, OH | 3.0 | 1.0 | 1176 | $1,350 | $1.15 | 43d | 1 | 0.40mi |
| 614-616 Lilley Ave Columbus, OH | 3.0 | 1.5 | 1232 | $1,700 | $1.38 | 43d | 1 | 0.40mi |
| 864 Fairwood Ave Columbus, OH | 3.0 | 1.0 | 1176 | $1,300 | $1.11 | 43d | 1 | 0.41mi |
| 730-732 Oakwood Ave Unit 732 Columbus, OH | 3.0 | 1.0 | 1232 | $1,425 | $1.16 | 43d | 1 | 0.41mi |
| 852-854 Fairwood Ave Columbus, OH | 3.0 | 1.0 | 1176 | $1,295 | $1.10 | 14d | 1 | 0.41mi |
| 852-854 Fairwood Ave Columbus, OH | 3.0 | 1.0 | 1176 | $1,295 | $1.10 | 23d | 1 | 0.41mi |
| 854 Fairwood Ave Columbus, OH | 3.0 | 1.0 | 1176 | $1,295 | $1.10 | 43d | 1 | 0.41mi |
| 597 Lilley Ave Columbus, OH | 2.0 | 1.5 | 1300 | $1,550 | $1.19 | 43d | 1 | 0.41mi |
| 555 Kimball Pl Columbus, OH | 3.0 | 2.5 | 1252 | $1,785 | $1.43 | 43d | 1 | 0.43mi |
| 1167 E Whittier St Columbus, OH | 3.0 | 1.5 | 1300 | $1,950 | $1.50 | 43d | 1 | 0.47mi |
| 1165-1167 E Whittier St Columbus, OH | 3.0 | 1.5 | 1300 | $1,950 | $1.50 | 43d | 1 | 0.47mi |
| 558 Lilley Ave Columbus, OH | 3.0 | 1.0 | 1372 | $1,600 | $1.17 | 43d | 1 | 0.48mi |
| 627 Oakwood Ave Columbus, OH | 3.0 | 2.5 | 2009 | $2,379 | $1.18 | 12d | 1 | 0.49mi |
| 1056 Wilson Ave Unit A Columbus, OH | 2.0 | 1.0 | 1100 | $1,225 | $1.11 | 43d | 1 | 0.49mi |
| 1056 Wilson Ave Unit B Columbus, OH | 2.0 | 1.0 | 1100 | $1,195 | $1.09 | 17d | 1 | 0.49mi |
| 522 Kelton Ave Columbus, OH | 2.0 | 2.0 | 1108 | $1,995 | $1.80 | 43d | 1 | 0.50mi |
| 685 S Champion Ave Unit 683 Columbus, OH | 3.0 | 1.0 | 1364 | $1,575 | $1.15 | 21d | 1 | 0.52mi |
| 997 Oakwood Ave Columbus, OH | 3.0 | 1.5 | 1260 | $1,800 | $1.43 | 12d | 1 | 0.53mi |
| 1050 Bulen Ave Columbus, OH | 3.0 | 2.0 | 1104 | $1,700 | $1.54 | 17d | 1 | 0.54mi |
| 814 S Ohio Ave Columbus, OH | 3.0 | 1.0 | 1380 | $1,600 | $1.16 | 43d | 1 | 0.55mi |
| 1445 E Main St Unit A Columbus, OH | 2.0 | 1.0 | 1250 | $1,050 | $0.84 | 10d | 1 | 0.59mi |
| 1805 Kent St Columbus, OH | 4.0 | 1.5 | 1399 | $1,900 | $1.36 | 23d | 1 | 0.61mi |
| 461 Oakwood Ave Columbus, OH | 3.0 | 1.5 | 1386 | $1,845 | $1.33 | 43d | 1 | 0.64mi |
| 910 Rhoads Ave Columbus, OH | 1.0–3.0 | 1.0–2.0 | 941 | $1,350 | $1.43 | 1d | 30 | 0.65mi |
| 977 S Ohio Ave Columbus, OH | 3.0 | 2.5 | 1650 | $2,500 | $1.52 | 43d | 1 | 0.65mi |
Listing history 29 events
-
2026-05-01status Pending
-
2026-04-03$40,000 Active
-
2024-11-14historical
-
2024-10-16$150,000 Active
-
2023-08-18historical
-
2023-07-20status Active
-
2023-06-30historical
-
2023-05-25price $354,000
-
2023-05-03price $364,000
-
2023-04-13$380,000 Active
-
2020-09-23soldstatus $110,000
-
2020-09-09soldstatus $110,000 Closed
-
2020-09-08status Active
-
2020-09-01historical Contingent Finance and Inspection
-
2020-08-21$129,000 Active
-
2020-08-12historical
-
2020-07-17price $129,000
-
2020-06-10$139,000 Active
-
2018-03-20soldstatus $37,000 Closed
-
2018-03-09status Pending
-
2018-02-20status Active
-
2018-01-30status Pending
-
2018-01-27$39,900 Active
-
2017-02-17soldstatus $15,000 Closed
-
2017-02-07status Pending
-
2017-01-24price $17,500
-
2016-12-13status Active
-
2016-10-31status Pending
-
2016-08-13$19,000 Active
ⓘ Source: listings_history table (triggers on properties + properties_extension) + one-shot
backfill from property_details.listing_events for pre-trigger history.
Climate risk First Street
- Flood 1/10 Low FEMA zone X (unshaded) · 0% chance over 30 yrs
- Wildfire 1/10 Low
- Heat 3/10 Moderate 7 d/yr ≥100°F today · 17 d/yr by 30 yrs out
- Wind 2/10 Low 100% chance of damaging wind over 30 yrs
- Air quality 3/10 Moderate 2 unhealthy d/yr today · 3 by 30 yrs out
Nearby sold comps map
Loading sold comps map…
Walkable amenities ~0.75 mi
Loading nearby amenities…
Taxation est. · year 1
- Rental income
- $20,684
- − Mortgage interest
- −$2,241
- − Property taxes
- −$600
- − Insurance
- −$200
- − Repairs & maintenance
- −$1,655
- − Management
- −$1,655
- − Depreciation
- −$1,164
- Taxable income
- $13,171
- Est. tax owed @ 24.0%
- −$3,161
- After-tax cash flow
- $9,862/yr
For passive investors: Depreciation is non-cash, so a rental often shows a tax loss while cash-flowing — sheltering income. Rental losses are passive: they offset passive income freely, and up to $25,000/yr can offset ordinary (W-2) income if you actively participate and your MAGI is under $100k (phasing out to $0 by $150k); unused losses carry forward. On sale, claimed depreciation is recaptured at up to 25%, and gains may owe capital-gains tax (a 1031 exchange can defer both). Figures are a year-1 estimate at your 24.0% rate — not tax advice; consult a CPA.
Schools (NCES district)
- District
- Columbus City School District
- NCES district ID
- 3904380
- Math proficiency
- 15% ▼ -17.00%
- Reading proficiency
- 26% ▼ -12.00%
- Median HH income
- $38,483
- Composite
- 17.19/100
- National rank
- #9105
- State rank
- #626 of 656 in OH
Livability — Columbus
- Score
- 81/100
- State rank
- #97
- US rank
- #1491
Category grades
Schools grade is shown separately in the Schools card above.
Census & demographics
- Census place
- Columbus, OH
- County
- Franklin County · 1,351,780 people
- City population
- 612,189
- Metro
- Columbus, OH
- Population (ZIP)
- 21,996
- Household income
- $75,806
- Rent vs Own
- Severe rent burden
- 846.0
Population outlook (Franklin County) Hauer SSP2
- Today (2025)
- 1,456,139 people
- By 2030
- 1,556,890 · +6.9%
- By 2040
- 1,757,349 · +20.7%
- By 2050
- 1,950,539 · +34.0%
- By 2075
- 2,376,171 · +63.2%
- By 2100
- 2,636,796 · +81.1%
Race, ethnicity, and origin ACS 2023
- Neighborhood character
- Diverse neighborhood (Simpson 0.59)
- Race & ethnicity
- White 56% Black 31% Two or more races 9% Hispanic / Latino 4% Asian 1% Native American 1%
- Common ancestry
- Romanian 3% Slovak 2% Lithuanian 1%
- Foreign-born
- 4% · Canada
- Languages at home
- 96% English-only · Spanish 2% Other Indo-European 1%
Political lean MEDSL · Franklin
- 2024 margin
- Strong D (+28.4) · D 63.7% · R 35.3% · Other 1.0%
- 2008→2024 swing
- +7.7pp toward D · 2008: 20.7pp · 2024: 28.4pp
- All cycles
- 2024: D+28.4 2020: D+31.4 2016: D+25.9 2012: D+21.7 2008: D+20.7
Not yet ingested
- Civics
- —
Market trends
- HPI YoY
- ▼ -576.73%
- Current HPI
- 173.8569
- Rent YoY
- ▲ 3.51%
- Metro
- Columbus, OH
- State GDP YoY
- ▲ 1.98%
- F500 in state
- 48
Industry mix (Fortune 500 HQ in OH)
| Industry | F500 HQs | Revenue |
|---|---|---|
| Insurance | 3 | $145B |
|
||
| Industrial Machinery | 3 | $49B |
|
||
| Financial Services | 3 | $24B |
|
||
| Consumer Goods | 2 | $93B |
|
||
| Aerospace / Defense | 2 | $47B |
|
||
| Utilities | 2 | $33B |
|
||
Price history
+110.5% since first listed29 events — show timeline
- 2026-05-01 Pending — CBRMLS
- 2026-04-03 Listed $40,000 CBRMLS
- 2024-11-14 Listing Removed — CBRMLS
- 2024-10-16 Listed $150,000 CBRMLS
- 2023-08-18 Listing Removed — CBRMLS
- 2023-07-20 Relisted — CBRMLS
- 2023-06-30 Listing Removed — CBRMLS
- 2023-05-25 Price Changed $354,000 CBRMLS
- 2023-05-03 Price Changed $364,000 CBRMLS
- 2023-04-13 Listed $380,000 CBRMLS
- 2020-09-23 Sold (Public Records) $110,000 Public Records
- 2020-09-09 Sold (MLS) $110,000 CBRMLS
- 2020-09-08 Relisted — CBRMLS
- 2020-09-01 Contingent — CBRMLS
- 2020-08-21 Listed $129,000 CBRMLS
- 2020-08-12 Listing Removed — CBRMLS
- 2020-07-17 Price Changed $129,000 CBRMLS
- 2020-06-10 Listed $139,000 CBRMLS
- 2018-03-20 Sold (MLS) $37,000 CBRMLS
- 2018-03-09 Pending — CBRMLS
- 2018-02-20 Relisted — CBRMLS
- 2018-01-30 Pending — CBRMLS
- 2018-01-27 Listed $39,900 CBRMLS
- 2017-02-17 Sold (MLS) $15,000 CBRMLS
- 2017-02-07 Pending — CBRMLS
- 2017-01-24 Price Changed $17,500 CBRMLS
- 2016-12-13 Relisted — CBRMLS
- 2016-10-31 Pending — CBRMLS
- 2016-08-13 Listed $19,000 CBRMLS
Property tax history
+15.6%/yrLatest (2024): $3,123 · -3.4% YoY. Source: county tax records.
Cash-flow waterfall
monthlySold comps — $/sqft
last 12 mo · ≤1 miLoading sold comps…