 Multi-family
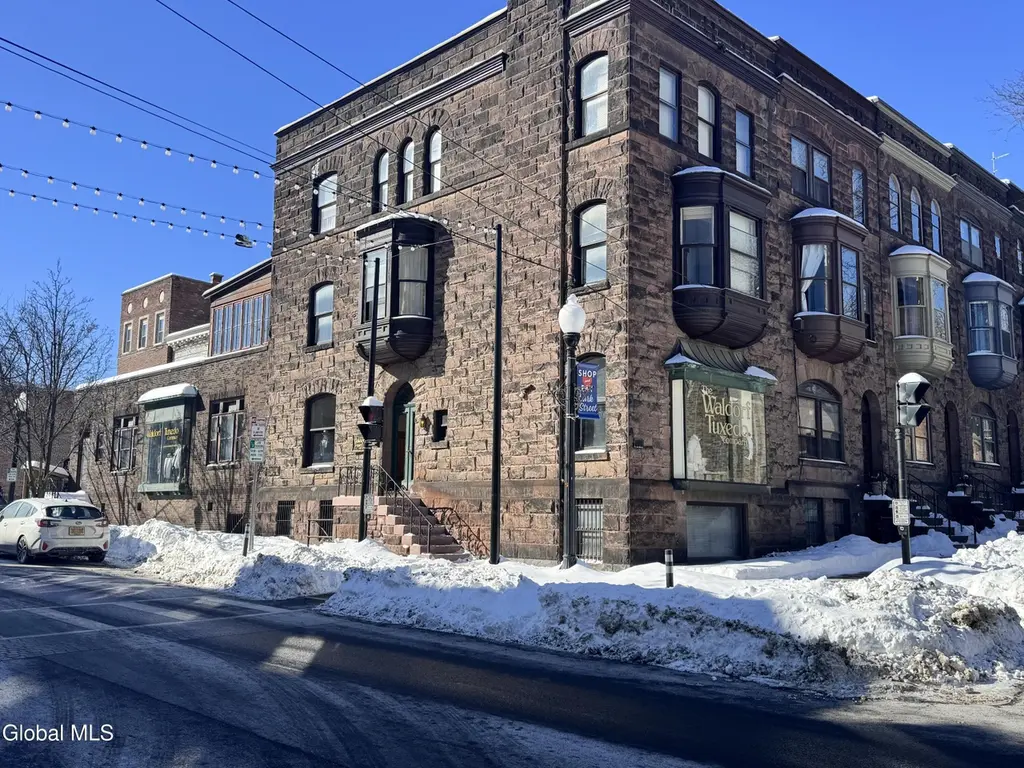
204 Lancaster St · Albany, NY
Flood risk No data
- FEMA flood zone
- —
- Chance of flooding over 30 yrs
- —
- Est. flood insurance / yr
- —
Fire risk No data
- Est. fire insurance / yr
- —
Heat risk No data
- Hot days now (above threshold)
- —
- Hot days in 30 yrs
- —
Wind risk No data
- Chance of severe wind over 30 yrs
- —
Air-quality risk No data
- Unhealthy air days now
- —
- Unhealthy air days in 30 yrs
- —
Risk factors via First Street. Map © Google.
Why this score? — see what drove the C- grade
The composite is a weighted blend of 9 inputs, each scored 0–100. Each bar is that input's sub-score; the figure is the points it added to the 100-point composite (weight × sub-score).
- ARV discount +15.0/15.0
- Cash flow +12.4/30.0
- Appreciation +5.0/10.0
- Livability +4.0/5.0
- Condition / age +4.0/5.0
- DSCR +3.7/10.0
- 1% rule +3.5/10.0
- Schools +3.2/10.0
- Rent growth +2.5/5.0
$649,000
🖨 Deal sheet 📄 Offer letter ✓ Due diligence
Multi-family units
County records classify this as Multi-Family (2-4 Unit). Listing-text estimate: 1 unit. estimate disagrees with records
Listing remarks MLS
Mixed-Use Opportunity in Historic Albany! Welcome to 204 Lancaster Street, a well-located mixed-use building offering flexibility and versatility. This historic property features a ground-floor retail space with strong street presence, currently operated as a tailor shop, and suitable for a wide variety of commercial uses. Above the storefront are two residential apartments. Situated in a vibrant Albany neighborhood with steady foot and vehicle traffic, this property is ideal for investors or owner-occupants seeking a combination of commercial and residential use. The property has seen significant recent capital improvements totaling over $25,000, including a new commercial central air conditioning system, a new rubber roof, and a brand new hot water tank -- providing buyers with peace of mind and minimal near-term capital expenditure requirements. A unique opportunity to own a versatile, well-maintained building in one of Albany's established corridors. Tailor inventory can be purchased separately or included with the sale of the property.
Key facts
- Historic property
- Versatile building
- 1,742 sq ft lot
Tags
Neighborhood map
What this means for you Summary
Snapshot
- This is a 2-bed/3.5-bath multifamily listed at $649k. Condition is rated good.
Deal economics
- At list price, monthly cash flow is $-108 ($-1k/yr) — negative.
- To cash-flow at today's rent, offer at most $633k (2.4% below list).
- To meet the 1% rule (rent ≥ 1% of price), the offer needs to be $554k (14.6% below list).
- Recommended offer: $554k (14.6% below list) — sets the bar for 1% rule.
Location & tenants
- Location reads 79/100 on livability (#129 in NY, #2,083 nationally) — a middle-class / working-renter tenant base. Strengths: amenities A+, commute A+, housing A+; Watch: employment C-, crime F.
- Albany City School District (urban): math 37% / reading 40% proficiency, ranked #543 of 590 in NY (top 92%) — families likely to look elsewhere, expect single-tenant / working-renter base with shorter leases; 66% free/reduced lunch — lower-income household profile, screen leases tightly.
- Market conditions: 2 active listings in the ZIP; 675 units permitted in Albany County in 2024 (451 in 5+ unit buildings).
Forward outlook
- In year one you build about $24k of equity ($4k loan paydown + $19k appreciation (3.0% local appreciation)).
- Albany County population projected at +9% by 2050 — modest demand growth; plan on rents tracking national, not racing it.
- By year 2, paydown + projected appreciation supports a ~$39k cash-out refi (75% LTV) — recoverable capital for the next deal without selling this one.
Negotiation context
- It's been on market 105 days — a 9% lower offer ($591k) is reasonable based on typical stale-listing flexibility.
Risks & watch-outs
- Watch-outs: built in 1930 — expect roof / HVAC / electrical / plumbing capex.
Questions for the listing agent
- What do current leases actually rent for vs. the listed asking? Can we see a recent rent roll and the last 12 months of T-12 income?
- It's been on market 105 days. Have you received any prior offers? Is the seller open to a 15% concession, seller financing, or rate buy-down credit?
- Built in 1930 — when were the roof, HVAC, electrical panel, plumbing, and water heater last replaced?
- Why hasn't it sold? Are there any deal-killer items the seller is aware of (foundation, flood, title, zoning, code violations)?
- Is there a deadline driving the sale (1031 exchange, divorce, estate, relocation)? That informs how much negotiation room exists.
- Crime grade is F in this area — have there been break-ins, vandalism, or insurance claims at this property in the last 3 years? What carrier currently insures it and at what premium?
- What's the average days-on-market for RENTAL listings here right now (not sales)? A rising rental-DOM trend means longer vacancies and softer asking-rent achievability than the comps imply.
- What's the recent tenant-quality profile in this submarket — average credit score on applications, eviction rate, late-payment / NSF rate, and stable-employment percentage? A property-management company in the area should have these aggregated.
- How much new apartment / multifamily construction is in the pipeline within 1–3 miles? Heavy new supply (>2% of stock underway) typically softens rents 12–24 months out; light construction supports rent growth.
Investment metrics
- 1% rule
- 0.85% ✗
- Cap rate
- 6.09%
- Cash-on-cash
- -0.71%
- DSCR
- 0.97
- GRM
- 9.8
CMA / ARV
- ARV (median comp)
- $889,563
- List price
- $649,000
- Delta
- -27.04%
- Verdict
- UNDERPRICED
- Comps
- 20 within 1.0 mi
Projected returns pro-forma
3.0% appreciation · 3.0% rent growth · sell at horizon
- IRR
- 6.8%
- Equity multiple
- 1.39×
- Total profit
- $71,406
- Equity at exit
- $291,819
- IRR
- 9.7%
- Equity multiple
- 2.45×
- Total profit
- $264,026
- Equity at exit
- $449,727
Cash invested: $181,720 (down + closing). Projections, not guarantees.
Landlord ↔ Tenant lean methodology
- Overall (STATE)
- 15 Strongly Tenant-Friendly
- State New York
- 15 Strongly Tenant-Friendly · D+10
- County
- — inherits STATE
- City
- — inherits STATE
ZIP-level market 12201
- Active inventory
- 2
- Price-to-rent
- 29.3×
Monthly cashflow live
- Estimated rent
- $5,541 high interval (Pro) →
- Mortgage (P&I)
- −$3,403
- Tax est. 1.5%
- −$811 /mo · $9,735/yr
- Insurance
- −$270
- HOA
- −$0
- Vacancy / Maint / Mgmt
- −$1,164
- Net cashflow
- $-108
Break-even live
3-unit breakdown (identical units grouped — click to expand)
| Units | Beds | Baths | Est. rent |
|---|---|---|---|
| 3× units | 1 | 1 | $5,541 |
| #1 | 1 | 1 | $1,847 |
| #2 | 1 | 1 | $1,847 |
| #3 | 1 | 1 | $1,847 |
| Total (3 units) | $5,541 | ||
UW: 25.0% down · 7.5% · 30yr · 1.5% tax · 5.0% vac · 8.0% maint · 8.0% mgmt
Financing live
Cash to close
- Down payment
- $162,250
- Closing costs
- $19,470
- Reserves months
- —
- Total cash needed
- —
Loan-product check · same deal, 3 products live
Conventional
25% down · 7.5% · 30yr
- Down + closing
- —
- Monthly P&I
- —
- Monthly cashflow
- —
- DSCR
- —
- Eligible?
- —
Personal DTI + credit; lowest rate.
DSCR
20% down · 8.5% · 30yr
- Down + closing
- —
- Monthly P&I
- —
- Monthly cashflow
- —
- DSCR
- —
- Eligible?
- —
No personal income docs; deal must DSCR.
Hard money
10% down · 12.0% · 12mo
- Down + closing
- —
- Monthly P&I
- —
- Monthly cashflow
- —
- DSCR
- —
- Eligible?
- —
Short-term bridge; refi at stabilization.
Listing history 14 events
-
2026-06-18days on market $649,000 Active 105 DOM
-
2026-06-17days on market $649,000 Active 104 DOM
-
2026-06-16days on market $649,000 Active 103 DOM
-
2026-06-15days on market $649,000 Active 102 DOM
-
2026-06-14days on market $649,000 Active 100 DOM
-
2026-06-10days on market $649,000 Active 97 DOM
-
2026-06-08days on market $649,000 Active 95 DOM
-
2026-06-07days on market $649,000 Active 94 DOM
-
2026-06-03days on market $649,000 Active 90 DOM
-
2026-06-02days on market $649,000 Active 89 DOM
-
2026-06-01days on market $649,000 Active 88 DOM
-
2026-05-31days on market $649,000 Active 87 DOM
-
2026-05-31days on market $649,000 Active 86 DOM
-
2026-03-03$649,000 Active 1059-char remark
Show marketing remark (1059 chars)
Mixed-Use Opportunity in Historic Albany! Welcome to 204 Lancaster Street, a well-located mixed-use building offering flexibility and versatility. This historic property features a ground-floor retail space with strong street presence, currently operated as a tailor shop, and suitable for a wide variety of commercial uses. Above the storefront are two residential apartments. Situated in a vibrant Albany neighborhood with steady foot and vehicle traffic, this property is ideal for investors or owner-occupants seeking a combination of commercial and residential use. The property has seen significant recent capital improvements totaling over $25,000, including a new commercial central air conditioning system, a new rubber roof, and a brand new hot water tank -- providing buyers with peace of mind and minimal near-term capital expenditure requirements. A unique opportunity to own a versatile, well-maintained building in one of Albany's established corridors. Tailor inventory can be purchased separately or included with the sale of the property.
ⓘ Source: listings_history table (triggers on properties + properties_extension) + one-shot
backfill from property_details.listing_events for pre-trigger history.
Nearby sold comps map
Loading sold comps map…
Walkable amenities ~0.75 mi
Loading nearby amenities…
Taxation est. · year 1
- Rental income
- $66,492
- − Mortgage interest
- −$36,354
- − Property taxes
- −$9,735
- − Insurance
- −$3,245
- − Repairs & maintenance
- −$5,319
- − Management
- −$5,319
- − Depreciation
- −$18,880
- Taxable loss
- −$12,361
- Est. tax savings @ 24.0%
- +$2,967
- After-tax cash flow
- $1,674/yr
For passive investors: Depreciation is non-cash, so a rental often shows a tax loss while cash-flowing — sheltering income. Rental losses are passive: they offset passive income freely, and up to $25,000/yr can offset ordinary (W-2) income if you actively participate and your MAGI is under $100k (phasing out to $0 by $150k); unused losses carry forward. On sale, claimed depreciation is recaptured at up to 25%, and gains may owe capital-gains tax (a 1031 exchange can defer both). Figures are a year-1 estimate at your 24.0% rate — not tax advice; consult a CPA.
Condition & rehab AI · 14 photos
This historic mixed-use building in Albany is in good condition with recent capital improvements. It has a strong street presence and is ideal for investors seeking a combination of commercial and residential use.
Value-add opportunities
- Resale Paint the exterior walls — Painting the exterior walls will enhance the building's curb appeal and make it more attractive to potential buyers.
- Rental Replace the carpet in the hallway — Replacing the carpet in the hallway will make the space more comfortable and appealing for tenants.
- Both Clean the HVAC system — A clean HVAC system will improve air quality and energy efficiency, benefiting both buyers and tenants.
Renovation cost estimate screening
Value-add ROI direction
- Resale Paint the exterior walls — Painting the exterior walls will enhance the building's curb appeal and make it more attractive to potential buyers. ↑
- Rental Replace the carpet in the hallway — Replacing the carpet in the hallway will make the space more comfortable and appealing for tenants. ↑
- Both Clean the HVAC system — A clean HVAC system will improve air quality and energy efficiency, benefiting both buyers and tenants. ↑
ⓘ Cost ranges are severity-bucket heuristics (US national rule-of-thumb). Get contractor quotes + a written scope before underwriting a rehab budget.
Schools (NCES district)
- District
- Albany City School District
- NCES district ID
- 3602460
- Math proficiency
- 37% ▲ 6.00%
- Reading proficiency
- 40% ▲ 7.00%
- Median HH income
- $40,568
- Composite
- 32.34/100
- National rank
- #5744
- State rank
- #543 of 590 in NY
Livability — Albany
- Score
- 79/100
- State rank
- #129
- US rank
- #2083
Category grades
Schools grade is shown separately in the Schools card above.
Census & demographics
- Census place
- Albany, NY
Population outlook (Albany County) Hauer SSP2
- Today (2025)
- 320,794 people
- By 2030
- 327,401 · +2.1%
- By 2040
- 338,218 · +5.4%
- By 2050
- 348,467 · +8.6%
- By 2075
- 381,693 · +19.0%
- By 2100
- 393,809 · +22.8%
Not yet ingested
- Political lean
- —
- Race & ethnicity
- —
- Common origin
- —
- Civics
- —
Market trends
- HPI YoY
- —
- Current HPI
- —
- Rent YoY
- —
- Metro
- —
- State GDP YoY
- ▲ 2.60%
- F500 in state
- 92
Industry mix (Fortune 500 HQ in NY)
| Industry | F500 HQs | Revenue |
|---|---|---|
| Financial Services | 10 | $950B |
|
||
| Consumer Goods | 9 | $162B |
|
||
| Insurance | 4 | $225B |
|
||
| Telecommunications | 2 | $144B |
|
||
| Pharmaceuticals | 2 | $112B |
|
||
| Media / Entertainment | 2 | $69B |
|
||
Price history
1 event — show timeline
- 2026-03-03 Listed $649,000 Global MLS
Cash-flow waterfall
monthlySold comps — $/sqft
last 12 mo · ≤1 miLoading sold comps…