 Triplex
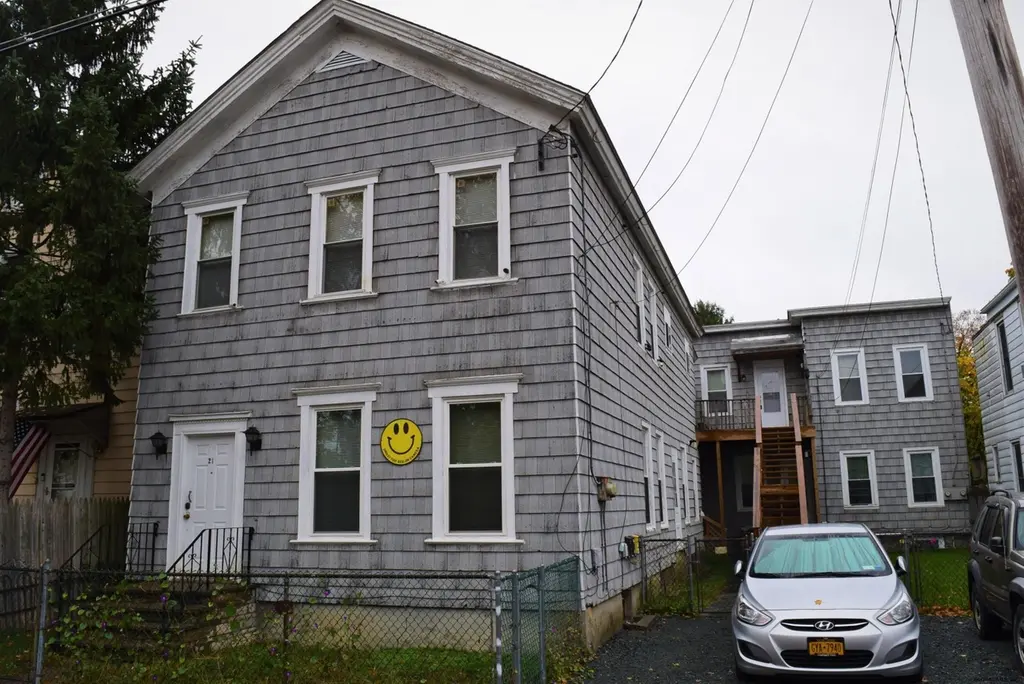
21 River St Unit 23 River St · Cohoes, NY
Flood risk 10/10 · Severe
- FEMA flood zone
- X (unshaded)
- Chance of flooding over 30 yrs
- 0.99%
- Est. flood insurance / yr
- $473 – $860
Fire risk 3/10 · Minor
- Est. fire insurance / yr
- $691 – $1,283
Heat risk 4/10 · Minor
- Hot days now (above 98°F)
- 7 days/yr
- Hot days in 30 yrs
- 16 days/yr
Wind risk 3/10 · Minor
- Chance of severe wind over 30 yrs
- 7.0%
Air-quality risk 2/10 · Minimal
- Unhealthy air days now
- 0 days/yr
- Unhealthy air days in 30 yrs
- 1 days/yr
Risk factors via First Street. Map © Google.
Why this score? — see what drove the B- grade
The composite is a weighted blend of 9 inputs, each scored 0–100. Each bar is that input's sub-score; the figure is the points it added to the 100-point composite (weight × sub-score).
- Cash flow +30.0/30.0
- 1% rule +10.0/10.0
- DSCR +10.0/10.0
- Rent growth +4.4/5.0
- Livability +4.2/5.0
- Condition / age +3.8/5.0
- Schools +3.6/10.0
- ARV discount +0.3/15.0
- Appreciation +0.0/10.0
$335,000
🖨 Deal sheet 📄 Offer letter ✓ Due diligence
Multi-family units
County records classify this as Multi-Family (5+ Unit). Listing-text estimate: 3 units. estimate disagrees with records
5+ unit building — per-unit beds/baths from public records are typically unavailable; the breakdown below (if shown) is an estimate from the listing text.
Listing remarks
Two duplexes (21 River St and 23 River St) on one lot attached by common deck and stairs on the island in Cohoes. Many recent updates including new roof and combo boilers in front building in past few years. Both buildings have gas heat and full basements, vinyl replacement windows, circuit breaker panels, separate utilities. Off street parking for 2 cars, great location, easy commute to most of the Capital District, short walk to bus line. Very Good Condition overall.
Key facts
- Separate utilities
- Off street parking
- Gas heat
Tags
Property features AI
Finance
- Financial info: 4 rental units total; Tenants pay electricity and gas; Owner pays water, sewer, and trash collection
Exterior
- Parking: Off-street parking; Driveway; 2 total parking spaces
- Utilities: Public water; Public sewer; Electric service with circuit breakers
- Home design: Quadruplex; Shingle siding
- Construction: Asphalt roof; Other roof materials
- Exterior features: Deck; Chain link fencing; Other exterior features
Interior
- Bedrooms: Unit 1: 3 bedrooms; Unit 2: 2 bedrooms; Unit 3: 2 bedrooms; Unit 4: 1 bedroom
- Flooring: Vinyl flooring; Tile flooring; Wood flooring
- Bathrooms: 4 full bathrooms (located across 1st and 2nd levels)
- Heating & cooling: Hot water heating; Space heaters; Natural gas heating
- Interior features: Double-pane windows
- Laundry & utility: Washer hookup; Electric dryer hookup; Additional/other laundry provisions
Neighborhood map
What this means for you Summary
Snapshot
- This is a 3 × 3-bed/?-bath units multifamily listed at $335k. Condition is rated good.
Deal economics
- At list price, monthly cash flow is $2k ($24k/yr) — positive. Per door: $664/mo.
- The deal already cash-flows at list — no discount required.
- Meets the 1% rule at list price ($6k rent vs $335k).
- Cap rate 13.6% vs local median 4.7% in Cohoes — top-decile yield for the area; either an underpriced asset or a hidden risk that comps aren't pricing in. Stress-test before assuming the spread holds.
Location & tenants
- Location reads 83/100 on livability (#61 in NY, #895 nationally) — a professional / high-income tenant draw. Strengths: amenities A+, commute A+, housing A+; Watch: employment C-.
- Cohoes City School District (suburban): math 38% / reading 48% proficiency, ranked #487 of 590 in NY (top 82%) — families likely to look elsewhere, expect single-tenant / working-renter base with shorter leases.
- Market conditions: Rents rising fast (+7.6%/yr); 114 active listings in the ZIP; 675 units permitted in Albany County in 2024 (451 in 5+ unit buildings).
- At $5,524/mo this rent would consume 100% of the median local household income ($66k/yr) (locally 1395% of renters already pay >50% of income on rent) — very limited rent-growth headroom before tenants either downsize or default.
Forward outlook
- Local home prices are declining (-3.0%/yr); year-one equity from $2k of loan paydown is wiped out by about $10k of value loss. Plan a longer hold.
- Albany County population projected at +9% by 2050 — modest demand growth; plan on rents tracking national, not racing it.
- At projected returns (-3.0% appreciation + 7.6% rent growth), your $94k cash investment doubles in ~5 years — after that, you're playing with house money.
Negotiation context
- Only 4 days on market — expect competitive offers; lowballing is unlikely to land.
- 3 sale attempts since 5y ago with the ask held roughly flat each time — persistent listings suggest the price (not the market) is what's stuck; bring a comps-based counter.
Risks & watch-outs
- Watch-outs: flood insurance adds $56/mo; built in 1920 — expect roof / HVAC / electrical / plumbing capex.
- Climate carrying-cost: severe flood risk — expect insurance premiums to compound above CPI over the hold.
Questions for the listing agent
- Can we see the unit-by-unit rent roll, current vacancy, and any below-market leases? What's the average tenancy length?
- What capital expenditures (roof, boiler, parking lot, exteriors) have been made in the last 5 years, and what's planned in the next 2?
- Built in 1920 — when were the roof, HVAC, electrical panel, plumbing, and water heater last replaced?
- What's the actual annual flood-insurance premium (NFIP or private), and is the property in a SFHA with mandatory coverage?
- Is there a deadline driving the sale (1031 exchange, divorce, estate, relocation)? That informs how much negotiation room exists.
- What's the average days-on-market for RENTAL listings here right now (not sales)? A rising rental-DOM trend means longer vacancies and softer asking-rent achievability than the comps imply.
- What's the recent tenant-quality profile in this submarket — average credit score on applications, eviction rate, late-payment / NSF rate, and stable-employment percentage? A property-management company in the area should have these aggregated.
- How much new apartment / multifamily construction is in the pipeline within 1–3 miles? Heavy new supply (>2% of stock underway) typically softens rents 12–24 months out; light construction supports rent growth.
Investment metrics
- 1% rule
- 1.65% ✓
- Cap rate
- 13.63%
- Cash-on-cash
- 26.21%
- DSCR
- 2.17
- GRM
- 5.1
CMA / ARV
- ARV (on-the-fly)
- $289,000
- Comps found
- 7
Show comp detail 7 sales within ~0.75 mi
| Address | Dist | Beds/Ba | Sqft | Sold | Price | $/sf | Match |
|---|---|---|---|---|---|---|---|
| 94 Breslin Ave | 0.12mi | 9/3.0 | 3,300 (-3%) | 1mo | $270,000 | $82 | 85 |
| 128-130 Congress St | 0.71mi | 10/4.0 (+1) | 3,500 (+3%) | 3mo | $362,000 | $103 | 54 |
| 122 Congress St | 0.71mi | 9/3.0 | 3,336 (-2%) | 12mo | $265,000 | $79 | 50 |
| 129 Main St | 0.68mi | 9/3.0 | 3,312 (-3%) | 12mo | $329,000 | $99 | 50 |
| 164 Main St | 0.70mi | 10/4.0 (+1) | 3,480 (+2%) | 12mo | $280,000 | $80 | 48 |
| 53 Saratoga Ave | 0.72mi | 9/3.0 | 3,824 (+12%) | 22mo | $325,000 | $85 | 23 |
| 308 Saratoga St | 0.73mi | 9/3.0 | 3,900 (+15%) | 20mo | $331,500 | $85 | 21 |
Match score weights: distance 35% · size 25% · config 20% · recency 20%. Top-matched comps best support the ARV.
Projected returns pro-forma
-3.0% appreciation · 7.6% rent growth · sell at horizon
- IRR
- 24.3%
- Equity multiple
- 2.06×
- Total profit
- $99,540
- Equity at exit
- $49,950
- IRR
- 34.9%
- Equity multiple
- 4.96×
- Total profit
- $371,366
- Equity at exit
- $28,965
Cash invested: $93,800 (down + closing). Projections, not guarantees.
Landlord ↔ Tenant lean methodology
- Overall (STATE)
- 15 Strongly Tenant-Friendly
- State New York
- 15 Strongly Tenant-Friendly · D+10
- County
- — inherits STATE
- City
- — inherits STATE
ZIP-level market 12047
- Home prices YoY
- -10.7%
- Rents YoY
- 7.6%
- Active inventory
- 114
- Price-to-rent
- 15.2×
Monthly cashflow live
- Estimated rent
- $5,524 high interval (Pro) →
- Mortgage (P&I)
- −$1,757
- Tax est. 1.5%
- −$419 /mo · $5,025/yr
- Insurance
- −$140
- Flood insurance flood zone
- −$56 /mo · $666/yr
- HOA
- −$0
- Vacancy / Maint / Mgmt
- −$1,160
- Net cashflow
- $1,993
Break-even live
3-unit breakdown (identical units grouped — click to expand)
| Units | Beds | Baths | Est. rent |
|---|---|---|---|
| 3× units | 3 | — | $5,523 |
| #1 | 3 | — | $1,841 |
| #2 | 3 | — | $1,841 |
| #3 | 3 | — | $1,841 |
| Total (3 units) | $5,524 | ||
UW: 25.0% down · 7.5% · 30yr · 1.5% tax · 5.0% vac · 8.0% maint · 8.0% mgmt
Financing live
Cash to close
- Down payment
- $83,750
- Closing costs
- $10,050
- Reserves months
- —
- Total cash needed
- —
Loan-product check · same deal, 3 products live
Conventional
25% down · 7.5% · 30yr
- Down + closing
- —
- Monthly P&I
- —
- Monthly cashflow
- —
- DSCR
- —
- Eligible?
- —
Personal DTI + credit; lowest rate.
DSCR
20% down · 8.5% · 30yr
- Down + closing
- —
- Monthly P&I
- —
- Monthly cashflow
- —
- DSCR
- —
- Eligible?
- —
No personal income docs; deal must DSCR.
Hard money
10% down · 12.0% · 12mo
- Down + closing
- —
- Monthly P&I
- —
- Monthly cashflow
- —
- DSCR
- —
- Eligible?
- —
Short-term bridge; refi at stabilization.
Listing history 7 events
-
2026-05-19$335,000 Active
-
2022-04-05historical
-
2022-02-22status Pending
-
2022-02-10status Active
-
2021-12-31status Pending
-
2021-12-27historical Contingent
-
2021-11-15$250,000 New
ⓘ Source: listings_history table (triggers on properties + properties_extension) + one-shot
backfill from property_details.listing_events for pre-trigger history.
Climate risk First Street
- Flood 10/10 Extreme FEMA zone X (unshaded) · 99% chance over 30 yrs
- Wildfire 3/10 Moderate
- Heat 4/10 Moderate 7 d/yr ≥98°F today · 16 d/yr by 30 yrs out
- Wind 3/10 Moderate 7% chance of damaging wind over 30 yrs
- Air quality 2/10 Low 0 unhealthy d/yr today · 1 by 30 yrs out
Nearby sold comps map
Loading sold comps map…
Walkable amenities ~0.75 mi
Loading nearby amenities…
Taxation est. · year 1
- Rental income
- $66,288
- − Mortgage interest
- −$18,765
- − Property taxes
- −$5,025
- − Insurance
- −$2,342
- − Repairs & maintenance
- −$5,303
- − Management
- −$5,303
- − Depreciation
- −$9,745
- Taxable income
- $19,805
- Est. tax owed @ 24.0%
- −$4,753
- After-tax cash flow
- $19,167/yr
For passive investors: Depreciation is non-cash, so a rental often shows a tax loss while cash-flowing — sheltering income. Rental losses are passive: they offset passive income freely, and up to $25,000/yr can offset ordinary (W-2) income if you actively participate and your MAGI is under $100k (phasing out to $0 by $150k); unused losses carry forward. On sale, claimed depreciation is recaptured at up to 25%, and gains may owe capital-gains tax (a 1031 exchange can defer both). Figures are a year-1 estimate at your 24.0% rate — not tax advice; consult a CPA.
Condition & rehab AI · 13 photos
This property is in good condition with recent updates, including a new roof and combo boilers. The interior is in good condition, and the property has a good location with easy access to public transportation and commuting. The property has a good potential for value increase with minor updates to the kitchen and bathroom.
Repairs flagged
- Minor Kitchen Countertops — The countertops could be updated for a more modern look.
- Minor Bathroom Fixtures — The bathroom fixtures could be refreshed for a more appealing look.
Value-add opportunities
- Resale Updating the kitchen countertops and backsplash — Updating the kitchen will make it more appealing to potential buyers.
- Resale Refreshing the bathroom fixtures and tiles — Refreshing the bathroom will make it more appealing to potential buyers.
- Both Painting the exterior — Painting the exterior will improve the curb appeal and increase the property's value.
Renovation cost estimate screening
| Repair item | Severity | Est. cost |
|---|---|---|
| Kitchen Countertops · The countertops could be updated for a more modern look. | Minor | $500–3,000 |
| Bathroom Fixtures · The bathroom fixtures could be refreshed for a more appealing look. | Minor | $500–3,000 |
| Total estimated repair cost · 2 items | $1,000–6,000 |
Value-add ROI direction
- Resale Updating the kitchen countertops and backsplash — Updating the kitchen will make it more appealing to potential buyers. ↑
- Resale Refreshing the bathroom fixtures and tiles — Refreshing the bathroom will make it more appealing to potential buyers. ↑
- Both Painting the exterior — Painting the exterior will improve the curb appeal and increase the property's value. ↑
ⓘ Cost ranges are severity-bucket heuristics (US national rule-of-thumb). Get contractor quotes + a written scope before underwriting a rehab budget.
Schools (NCES district)
- District
- Cohoes City School District
- NCES district ID
- 3607980
- Math proficiency
- 38% ▼ -4.00%
- Reading proficiency
- 48% ▲ 3.00%
- Median HH income
- $45,104
- Composite
- 36.48/100
- National rank
- #4655
- State rank
- #487 of 590 in NY
Livability — Cohoes
- Score
- 83/100
- State rank
- #61
- US rank
- #895
Category grades
Schools grade is shown separately in the Schools card above.
Census & demographics
- Census place
- Cohoes, NY
- County
- Albany County · 196,626 people
- City population
- 23,532
- Metro
- Albany-Schenectady-Troy, NY
- Population (ZIP)
- 23,532
- Household income
- $66,071
- Rent vs Own
- Severe rent burden
- 1395.0
Population outlook (Albany County) Hauer SSP2
- Today (2025)
- 320,794 people
- By 2030
- 327,401 · +2.1%
- By 2040
- 338,218 · +5.4%
- By 2050
- 348,467 · +8.6%
- By 2075
- 381,693 · +19.0%
- By 2100
- 393,809 · +22.8%
Race, ethnicity, and origin ACS 2023
- Neighborhood character
- Predominantly White (70%)
- Race & ethnicity
- White 70% Two or more races 11% Black 9% Hispanic / Latino 7% Asian 5%
- Hispanic origin (detail)
- Puerto Rican 3% Dominican 2%
- Common ancestry
- Lithuanian 8% Romanian 6% Iranian 2%
- Foreign-born
- 9% · Canada, China
- Languages at home
- 87% English-only · Spanish 3% Other Indo-European 3% Chinese 2%
Political lean MEDSL · Albany
- 2024 margin
- Strong D (+25.8) · D 62.9% · R 37.1%
- 2008→2024 swing
- -3.6pp toward R · 2008: 29.4pp · 2024: 25.8pp
- All cycles
- 2024: D+25.8 2020: D+31.4 2016: D+24.3 2012: D+31.0 2008: D+29.4
Not yet ingested
- Civics
- —
Market trends
- HPI YoY
- ▼ -38.15%
- Current HPI
- 317.4057
- Rent YoY
- ▲ 7.60%
- Metro
- Albany-Schenectady-Troy, NY
- State GDP YoY
- ▲ 2.60%
- F500 in state
- 92
Industry mix (Fortune 500 HQ in NY)
| Industry | F500 HQs | Revenue |
|---|---|---|
| Financial Services | 10 | $950B |
|
||
| Consumer Goods | 9 | $162B |
|
||
| Insurance | 4 | $225B |
|
||
| Telecommunications | 2 | $144B |
|
||
| Pharmaceuticals | 2 | $112B |
|
||
| Media / Entertainment | 2 | $69B |
|
||
Price history
+34.0% since first listed7 events — show timeline
- 2026-05-19 Listed $335,000 Global MLS
- 2022-04-05 Listing Removed — Global MLS
- 2022-02-22 Pending — Global MLS
- 2022-02-10 Relisted — Global MLS
- 2021-12-31 Pending — Global MLS
- 2021-12-27 Contingent — Global MLS
- 2021-11-15 Listed $250,000 Global MLS
Cash-flow waterfall
monthlySold comps — $/sqft
last 12 mo · ≤1 miLoading sold comps…