214 Polasek Dr · Abilene, TX
Flood risk 1/10 · Minimal
- FEMA flood zone
- X (unshaded)
- Chance of flooding over 30 yrs
- 0.0%
- Est. flood insurance / yr
- $507 – $1,088
Fire risk 6/10 · Moderate
- Est. fire insurance / yr
- $1,222 – $2,270
Heat risk 6/10 · Moderate
- Hot days now (above 103°F)
- 7 days/yr
- Hot days in 30 yrs
- 23 days/yr
Wind risk 4/10 · Minor
- Chance of severe wind over 30 yrs
- 17.0%
Air-quality risk 1/10 · Minimal
- Unhealthy air days now
- 0 days/yr
- Unhealthy air days in 30 yrs
- 0 days/yr
Risk factors via First Street. Map © Google.
Why this score? — see what drove the B- grade
The composite is a weighted blend of 9 inputs, each scored 0–100. Each bar is that input's sub-score; the figure is the points it added to the 100-point composite (weight × sub-score).
- Cash flow +26.4/30.0
- DSCR +9.0/10.0
- 1% rule +7.1/10.0
- ARV discount +6.4/15.0
- Rent growth +5.0/5.0
- Condition / age +4.8/5.0
- Livability +3.8/5.0
- Schools +2.8/10.0
- Appreciation +0.0/10.0
$217,990
🖨 Deal sheet 📄 Offer letter ✓ Due diligence
Listing remarks
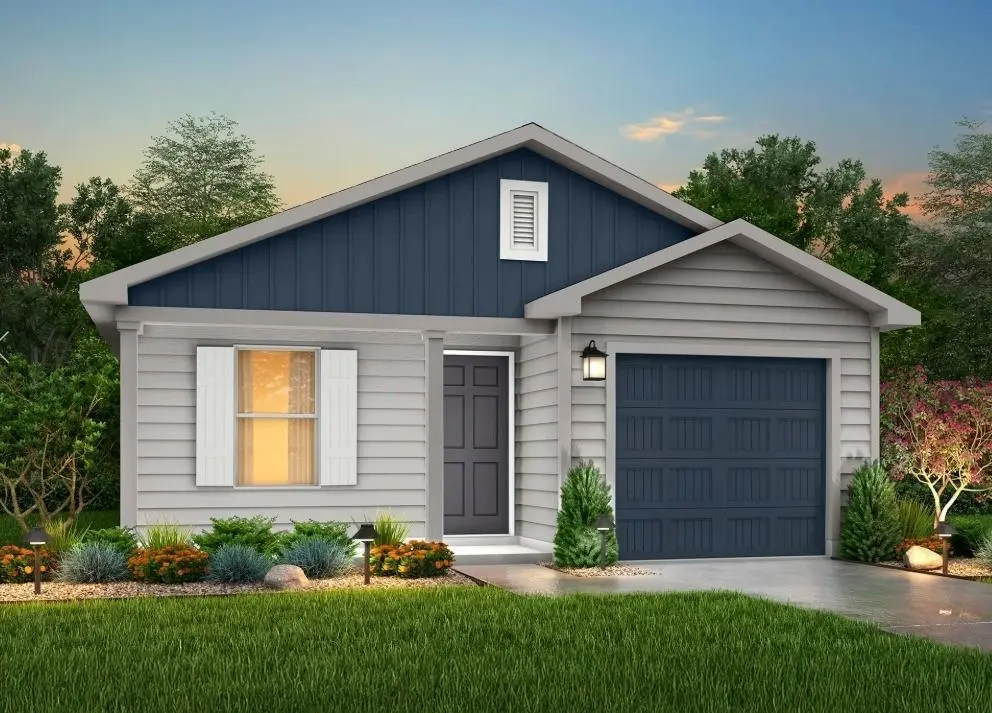
MLS# 21235609 - Built by NHC - Aug 2026 completion! ~ Model 1202 B1 - Yosemite The Yosemite Plan from our Freedom Series is a cozy and efficient single-story home featuring 3 bedrooms, 2 bathrooms, a 1-car garage, and 1,202 square feet of smartly designed living space. This split-level floorplan places two secondary bedrooms and a full bathroom at the front of the home, offering privacy and convenience. Continue into the open-concept living area, where the kitchen with a central island overlooks the dining area and family room—perfect for meals, gatherings, and quality family time. The primary suite is thoughtfully positioned off the family room for added privacy and includes a privat
Key facts
- 4,356 sq ft lot
- 2 garage spots
- Built 2025
Property features AI
Finance
- Other: Special listing condition: Builder; Possession at closing/funding
- Financial info: Listing accepts Cash, Conventional, FHA, and VA financing; No second mortgage indicated
- HOA & community: No association (Association type: None); Association covers grounds maintenance; Association fee listed as $0 (annually)
Exterior
- Parking: 2-car garage (garage faces front); 2 covered parking spaces
- Security: No smart home features indicated
- Utilities: City water; City sewer; Not in a municipal utility district
- Home design: Single family residence; Residential property; New construction (incomplete, 2025)
- Construction: Siding exterior; Composition roof; Slab foundation; Year built 2025 (new construction - incomplete)
- Exterior features: Lot less than 0.5 acre; Subdivision: Waterside at Cedar Creek
Interior
- Kitchen: Dishwasher; Disposal; Electric range; Microwave
- Bedrooms: 3 bedrooms; Primary bedroom on main level with walk-in closet; Other bedrooms on main level
- Flooring: Carpet; Vinyl
- Bathrooms: 2 full bathrooms
- Heating & cooling: Central heating (electric); Central air (electric)
- Interior features: Open floorplan; Eat-in kitchen; Pantry; One living area; One dining area; 6 total rooms; One story
- Laundry & utility: Laundry/utility details not provided
Neighborhood map
What this means for you Summary
Snapshot
- This is a 3-bed/2.0-bath single-family listed at $218k. Condition is rated excellent.
Deal economics
- At list price, monthly cash flow is $569 ($7k/yr) — positive.
- The deal already cash-flows at list — no discount required.
- Meets the 1% rule at list price ($3k rent vs $218k).
- Cap rate 9.4% vs local median 6.7% in Abilene — top-decile yield for the area; either an underpriced asset or a hidden risk that comps aren't pricing in. Stress-test before assuming the spread holds.
Location & tenants
- Location reads 75/100 on livability (#142 in TX, #4,037 nationally) — a middle-class / working-renter tenant base. Strengths: cost of living A+, housing A+, health & safety A+; Watch: crime D, commute F.
- Abilene ISD (urban): math 32% / reading 34% proficiency, ranked #575 of 826 in TX (top 70%) — families likely to look elsewhere, expect single-tenant / working-renter base with shorter leases.
- Zoned schools: Alcorta El (math 35% / reading 28%, grade F, #2,396 of 4,322 statewide, top 56%, 451 students, 70% FRL).
- Market conditions: Rents rising fast (+33.5%/yr); 370 active listings in the ZIP; 9 comparable units currently listed for rent nearby; rentals leasing fast (median 13d on market — plan ~1-2 weeks tenant-placement turnaround); solid renter incomes; 508 units permitted in Taylor County in 2024 (0 in 5+ unit buildings).
- This rent runs 35% of the median local income ($90k/yr) — at the standard rent-burdened threshold; future hikes will face affordability resistance.
Forward outlook
- Local home prices are declining (-3.0%/yr); year-one equity from $2k of loan paydown is wiped out by about $7k of value loss. Plan a longer hold.
- Taylor County population projected at +16% by 2050 — long-run rental-demand tailwind backs the buy-and-hold thesis.
- At projected returns (-3.0% appreciation + 8.0% rent growth), your $61k cash investment doubles in ~7 years — after that, you're playing with house money.
Negotiation context
- Only 1 days on market — expect competitive offers; lowballing is unlikely to land.
Risks & watch-outs
- Climate carrying-cost: major wildfire risk; extreme-heat days projected 7→23/yr by 2055 (HVAC capex compounding) — expect insurance premiums to compound above CPI over the hold.
Questions for the listing agent
- Is there a deadline driving the sale (1031 exchange, divorce, estate, relocation)? That informs how much negotiation room exists.
- Schools are D-rated, which usually means shorter tenancies and higher turnover. Who's the typical renter profile here, and what's been the actual vacancy rate?
- Crime grade is D in this area — have there been break-ins, vandalism, or insurance claims at this property in the last 3 years? What carrier currently insures it and at what premium?
- What's the average days-on-market for RENTAL listings here right now (not sales)? A rising rental-DOM trend means longer vacancies and softer asking-rent achievability than the comps imply.
- What's the recent tenant-quality profile in this submarket — average credit score on applications, eviction rate, late-payment / NSF rate, and stable-employment percentage? A property-management company in the area should have these aggregated.
- How much new for-sale + rental construction is in the pipeline within 1–3 miles? Heavy new supply typically softens prices + rents 12–24 months out; constrained supply supports both.
Investment metrics
- 1% rule
- 1.21% ✓
- Cap rate
- 9.43%
- Cash-on-cash
- 11.19%
- DSCR
- 1.50
- GRM
- 6.9
CMA / ARV
- ARV (on-the-fly)
- $212,754
- Comps found
- 12
Show comp detail 12 sales within ~0.75 mi
| Address | Dist | Beds/Ba | Sqft | Sold | Price | $/sf | Match |
|---|---|---|---|---|---|---|---|
| 3541 Silver Springs Ct | 0.23mi | 3/2.0 | 1,209 (+1%) | 1mo | $234,490 | $194 | 88 |
| 2948 Waterside Dr | 0.19mi | 3/2.0 | 1,202 (0%) | 4mo | $218,000 | $181 | 88 |
| 214 Houston Hollow St | 0.09mi | 3/2.0 | 1,209 (+1%) | 10mo | $209,990 | $174 | 86 |
| 144 Houston Hollow St | 0.10mi | 3/2.0 | 1,209 (+1%) | 11mo | $196,990 | $163 | 85 |
| 3501 Silver Springs Ct | 0.22mi | 2/2.5 (-1) | 1,212 (+1%) | 1mo | $214,433 | $177 | 81 |
| 3502 Water Ridge Ct | 0.26mi | 2/2.5 (-1) | 1,212 (+1%) | 0mo | $247,990 | $205 | 79 |
| 3526 Silver Springs Ct | 0.63mi | 3/2.0 | 1,209 (+1%) | 1mo | $234,990 | $194 | 69 |
| 3502 Silver Springs Ct | 0.64mi | 2/2.5 (-1) | 1,212 (+1%) | 1mo | $225,490 | $186 | 61 |
| 2670 Maple St | 0.32mi | 2/1.0 (-1) | 1,080 (-10%) | 3mo | $155,000 | $144 | 56 |
| 3333 Waverly Ave | 0.73mi | 3/1.0 | 1,116 (-7%) | 1mo | $110,000 | $99 | 49 |
| 3125 Waverly Ave | 0.70mi | 3/2.0 | 1,332 (+11%) | 1mo | $155,000 | $116 | 48 |
| 2909 Poplar St | 0.74mi | 3/2.0 | 1,036 (-14%) | 10mo | $99,900 | $96 | 34 |
Match score weights: distance 35% · size 25% · config 20% · recency 20%. Top-matched comps best support the ARV.
Projected returns pro-forma
-3.0% appreciation · 8.0% rent growth · sell at horizon
- IRR
- 5.9%
- Equity multiple
- 1.24×
- Total profit
- $14,844
- Equity at exit
- $32,503
- IRR
- 19.4%
- Equity multiple
- 3.01×
- Total profit
- $122,950
- Equity at exit
- $18,848
Cash invested: $61,037 (down + closing). Projections, not guarantees.
Landlord ↔ Tenant lean methodology
- Overall (STATE)
- 87 Strongly Landlord-Friendly
- State Texas
- 87 Strongly Landlord-Friendly · R+5
- County
- — inherits STATE
- City
- — inherits STATE
ZIP-level market 79602
- Home prices YoY
- -19.6%
- Rents YoY
- 33.5%
- Active inventory
- 370
- Price-to-rent
- 6.9×
Monthly cashflow live
- Estimated rent
- $2,627 high interval (Pro) →
- Mortgage (P&I)
- −$1,143
- Tax est. 1.5%
- −$272 /mo · $3,270/yr
- Insurance
- −$91
- HOA
- −$0
- Vacancy / Maint / Mgmt
- −$552
- Net cashflow
- $569
Break-even live
UW: 25.0% down · 7.5% · 30yr · 1.5% tax · 5.0% vac · 8.0% maint · 8.0% mgmt
Financing live
Cash to close
- Down payment
- $54,498
- Closing costs
- $6,540
- Reserves months
- —
- Total cash needed
- —
Loan-product check · same deal, 3 products live
Conventional
25% down · 7.5% · 30yr
- Down + closing
- —
- Monthly P&I
- —
- Monthly cashflow
- —
- DSCR
- —
- Eligible?
- —
Personal DTI + credit; lowest rate.
DSCR
20% down · 8.5% · 30yr
- Down + closing
- —
- Monthly P&I
- —
- Monthly cashflow
- —
- DSCR
- —
- Eligible?
- —
No personal income docs; deal must DSCR.
Hard money
10% down · 12.0% · 12mo
- Down + closing
- —
- Monthly P&I
- —
- Monthly cashflow
- —
- DSCR
- —
- Eligible?
- —
Short-term bridge; refi at stabilization.
Rent comps 9 comps
| Address | Beds | Baths | Sqft | Rent | $/sqft | DOM | Units | Dist |
|---|---|---|---|---|---|---|---|---|
| 801 S 17th St Abilene, TX | 3.0 | 1.0 | 1200 | $1,800 | $1.50 | 13d | 1 | 1.22mi |
| 1709 Bandolero Rd Abilene, TX | 3.0 | 2.0 | 1288 | $4,500 | $3.49 | 13d | 1 | 1.33mi |
| 1097 Lytle Creek Dr Abilene, TX | 3.0 | 2.0 | 1456 | $2,895 | $1.99 | 13d | 1 | 1.34mi |
| 3749 Duke Ln Abilene, TX | 2.0 | 1.0 | 925 | $1,650 | $1.78 | 7d | 1 | 1.43mi |
| 3601 Purdue Ln Abilene, TX | 3.0 | 1.0 | 1172 | $2,150 | $1.83 | 3d | 1 | 1.45mi |
| 1651 Palm St Abilene, TX | 2.0 | 1.0 | 760 | $2,500 | $3.29 | 43d | 1 | 1.46mi |
| 1649 Palm St Abilene, TX | 2.0 | 1.0 | 760 | $2,500 | $3.29 | 43d | 1 | 1.47mi |
| 3933 Wake Forest Ln Abilene, TX | 3.0 | 2.0 | 1320 | $2,495 | $1.89 | 22d | 1 | 1.48mi |
| 3933 Wake Forest Ln Abilene, TX | 3.0 | 2.0 | 1320 | $2,495 | $1.89 | 20d | 1 | 1.48mi |
Listing history 2 events
-
2026-04-10status Pending
-
2026-04-10$217,990 Active
ⓘ Source: listings_history table (triggers on properties + properties_extension) + one-shot
backfill from property_details.listing_events for pre-trigger history.
Climate risk First Street
- Flood 1/10 Low FEMA zone X (unshaded) · 0% chance over 30 yrs
- Wildfire 6/10 Major
- Heat 6/10 Major 7 d/yr ≥103°F today · 23 d/yr by 30 yrs out
- Wind 4/10 Moderate 17% chance of damaging wind over 30 yrs
- Air quality 1/10 Low 0 unhealthy d/yr today · 0 by 30 yrs out
Nearby sold comps map
Loading sold comps map…
Walkable amenities ~0.75 mi
Loading nearby amenities…
Taxation est. · year 1
- Rental income
- $31,527
- − Mortgage interest
- −$12,211
- − Property taxes
- −$3,270
- − Insurance
- −$1,090
- − Repairs & maintenance
- −$2,522
- − Management
- −$2,522
- − Depreciation
- −$6,342
- Taxable income
- $3,571
- Est. tax owed @ 24.0%
- −$857
- After-tax cash flow
- $5,972/yr
For passive investors: Depreciation is non-cash, so a rental often shows a tax loss while cash-flowing — sheltering income. Rental losses are passive: they offset passive income freely, and up to $25,000/yr can offset ordinary (W-2) income if you actively participate and your MAGI is under $100k (phasing out to $0 by $150k); unused losses carry forward. On sale, claimed depreciation is recaptured at up to 25%, and gains may owe capital-gains tax (a 1031 exchange can defer both). Figures are a year-1 estimate at your 24.0% rate — not tax advice; consult a CPA.
Condition & rehab AI · 2 photos
This single-family home is in excellent condition with a modern kitchen and well-maintained exterior. It offers a good investment opportunity with potential for minor updates to enhance its curb appeal and market value.
Value-add opportunities
- Both Painting the exterior and interior walls — Fresh paint can enhance curb appeal and interior aesthetics.
- Both Landscaping improvements — Enhanced landscaping can boost curb appeal and attract potential buyers/tenants.
- Both Adding smart home features — Smart home features can increase the home's appeal and market value.
- Both Upgrading the kitchen appliances — Modernizing the kitchen can make the home more attractive to buyers and renters.
- Both Adding a smart thermostat — A smart thermostat can improve energy efficiency and comfort, making the home more attractive to buyers and renters.
Renovation cost estimate screening
Value-add ROI direction
- Both Painting the exterior and interior walls — Fresh paint can enhance curb appeal and interior aesthetics. ↑
- Both Landscaping improvements — Enhanced landscaping can boost curb appeal and attract potential buyers/tenants. ↑
- Both Adding smart home features — Smart home features can increase the home's appeal and market value. ↑
- Both Upgrading the kitchen appliances — Modernizing the kitchen can make the home more attractive to buyers and renters. ↑
- Both Adding a smart thermostat — A smart thermostat can improve energy efficiency and comfort, making the home more attractive to buyers and renters. ↑
ⓘ Cost ranges are severity-bucket heuristics (US national rule-of-thumb). Get contractor quotes + a written scope before underwriting a rehab budget.
Schools (NCES district)
- District
- Abilene ISD
- NCES district ID
- 4807440
- Math proficiency
- 32% ▼ -11.00%
- Reading proficiency
- 34% ▼ -5.00%
- Median HH income
- $39,782
- Composite
- 27.71/100
- National rank
- #6909
- State rank
- #575 of 826 in TX
Livability — Abilene
- Score
- 75/100
- State rank
- #142
- US rank
- #4037
Category grades
Schools grade is shown separately in the Schools card above.
Census & demographics
- Census place
- Abilene, TX
- County
- Taylor County · 136,672 people
- City population
- 136,672
- Metro
- Abilene, TX
- Population (ZIP)
- 27,425
- Household income
- $89,551
- Rent vs Own
- Severe rent burden
- 338.0
Population outlook (Taylor County) Hauer SSP2
- Today (2025)
- 145,270 people
- By 2030
- 150,050 · +3.3%
- By 2040
- 159,417 · +9.7%
- By 2050
- 168,883 · +16.3%
- By 2075
- 194,436 · +33.8%
- By 2100
- 203,163 · +39.9%
Race, ethnicity, and origin ACS 2023
- Neighborhood character
- Majority White (64%)
- Race & ethnicity
- White 64% Hispanic / Latino 22% Two or more races 12% Black 10% Asian 2%
- Hispanic origin (detail)
- Mexican 19%
- Common ancestry
- Romanian 2% Italian 2% Portuguese 2%
- Foreign-born
- 6% · Canada, Vietnam, Jamaica
- Languages at home
- 87% English-only · Spanish 9% Other Asian/Pacific 1% French/Haitian/Cajun 1%
Political lean MEDSL · Taylor
- 2024 margin
- Solid R (+49.8) · D 24.6% · R 74.4% · Other 1.0%
- 2008→2024 swing
- -4.2pp toward R · 2008: -45.6pp · 2024: -49.8pp
- All cycles
- 2024: R+49.8 2020: R+45.3 2016: R+51.1 2012: R+53.6 2008: R+45.6
Not yet ingested
- Civics
- —
Market trends
- HPI YoY
- ▼ -46.04%
- Current HPI
- 189.3098
- Rent YoY
- ▲ 33.46%
- Metro
- Abilene, TX
- State GDP YoY
- ▲ 3.95%
- F500 in state
- 110
Industry mix (Fortune 500 HQ in TX)
| Industry | F500 HQs | Revenue |
|---|---|---|
| Energy | 16 | $1,198B |
|
||
| Technology | 5 | $198B |
|
||
| Engineering / Construction | 4 | $72B |
|
||
| Energy Services | 3 | $60B |
|
||
| Utilities | 3 | $41B |
|
||
| Healthcare | 2 | $330B |
|
||
Price history
2 events — show timeline
- 2026-04-10 Pending — NTREIS
- 2026-04-10 Listed $217,990 NTREIS
Cash-flow waterfall
monthlySold comps — $/sqft
last 12 mo · ≤1 miLoading sold comps…