 Duplex
28-30 Sirchia Rd · Mechanicville, NY
Flood risk 1/10 · Minimal
- FEMA flood zone
- —
- Chance of flooding over 30 yrs
- 0.0%
- Est. flood insurance / yr
- —
Fire risk 3/10 · Minor
- Est. fire insurance / yr
- $691 – $1,283
Heat risk 3/10 · Minor
- Hot days now (above 97°F)
- 7 days/yr
- Hot days in 30 yrs
- 16 days/yr
Wind risk 3/10 · Minor
- Chance of severe wind over 30 yrs
- 5.0%
Air-quality risk 2/10 · Minimal
- Unhealthy air days now
- 0 days/yr
- Unhealthy air days in 30 yrs
- 1 days/yr
Risk factors via First Street. Map © Google.
Why this score? — see what drove the B- grade
The composite is a weighted blend of 9 inputs, each scored 0–100. Each bar is that input's sub-score; the figure is the points it added to the 100-point composite (weight × sub-score).
- Cash flow +24.4/30.0
- Appreciation +10.0/10.0
- DSCR +7.9/10.0
- ARV discount +6.7/15.0
- 1% rule +6.5/10.0
- Schools +4.9/10.0
- Livability +3.4/5.0
- Rent growth +2.5/5.0
- Condition / age +2.5/5.0
$270,000
🖨 Deal sheet 📄 Offer letter ✓ Due diligence
Multi-family units
County records classify this as Multi-Family (2-4 Unit). Listing-text estimate: 2 units. confirmed
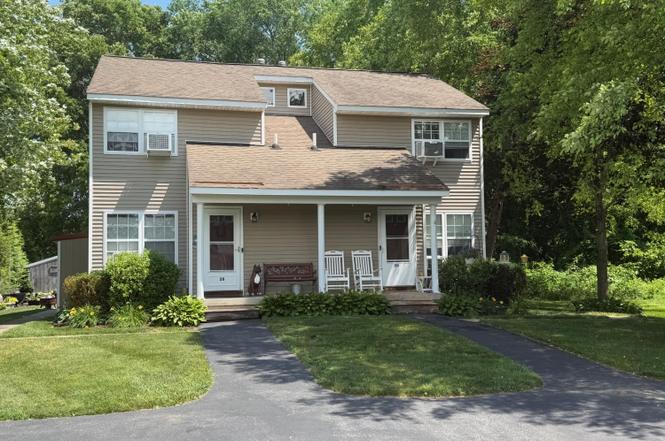
Listing remarks
Fully Rented Duplex On The Stillwater/Mechanicville Line. 2 bedrooms, 1.5 Bath, Gorgeous Lot On A Very Nice Street - Opportunity Awaits You. .. .. .
Key facts
- 0.37 acre lot
- 4 parking spots
- Built 1997
Property features AI
Finance
- Financial info: Two-unit property (duplex)
Exterior
- Parking: Off-street parking for 4 vehicles
- Utilities: 150 amp electric service; Public water; Public sewer; Cable available
- Home design: Duplex; Vinyl siding; Asphalt roof; Concrete perimeter foundation
- Construction: Vinyl siding construction; Asphalt roof; Concrete perimeter foundation
- Exterior features: Deck; Front porch; Back yard fencing; Level, landscaped lot (approx. 0.37 acres)
Interior
- Bedrooms: Each unit has 2 bedrooms
- Flooring: Carpet
- Bathrooms: Two full bathrooms (both on 2nd level); Two half bathrooms (both on 1st level)
- Heating & cooling: Forced air heating (natural gas); Window air conditioning units
- Interior features: Paddle fan; High-speed internet; French doors
- Laundry & utility: Laundry in basement
Neighborhood map
What this means for you Summary
Snapshot
- This is a 2 × 2.0-bed/1.5-bath units multifamily listed at $270k.
Deal economics
- At list price, monthly cash flow is $548 ($7k/yr) — positive. Per door: $274/mo.
- The deal already cash-flows at list — no discount required.
- Meets the 1% rule at list price ($3k rent vs $270k).
- Cap rate 8.7% vs local median 1.9% in Mechanicville — top-decile yield for the area; either an underpriced asset or a hidden risk that comps aren't pricing in. Stress-test before assuming the spread holds.
Location & tenants
- Location reads 67/100 on livability (#568 in NY) — a middle-class / working-renter tenant base. Strengths: housing A+, health & safety A+, cost of living B+; Watch: amenities C-, crime D+, employment D.
- Mechanicville City School District (rural): math 57% / reading 57% proficiency, ranked #270 of 590 in NY (top 46%) — acceptable for families but not a draw, mixed tenant base, ~2y average lease.
- Market conditions: 144 active listings in the ZIP; 2 comparable units currently listed for rent nearby; solid renter incomes; 1,132 units permitted in Saratoga County in 2024 (378 in 5+ unit buildings).
- This rent runs 40% of the median local income ($93k/yr) — at the standard rent-burdened threshold; future hikes will face affordability resistance.
Forward outlook
- In year one you build about $29k of equity ($2k loan paydown + $27k appreciation (10.0% local appreciation)).
- Saratoga County population projected at +4% by 2050 — modest demand growth; plan on rents tracking national, not racing it.
- At projected returns (10.0% appreciation + 3.0% rent growth), your $76k cash investment doubles in ~3 years — after that, you're playing with house money.
- By year 2, paydown + projected appreciation supports a ~$46k cash-out refi (75% LTV) — recoverable capital for the next deal without selling this one.
Negotiation context
- Only 1 days on market — expect competitive offers; lowballing is unlikely to land.
- Current owner paid $16k; list at $270k implies a 1588% gain — meaningful room to come down on a strong offer.
Questions for the listing agent
- Can we see the unit-by-unit rent roll, current vacancy, and any below-market leases? What's the average tenancy length?
- What capital expenditures (roof, boiler, parking lot, exteriors) have been made in the last 5 years, and what's planned in the next 2?
- Is there a deadline driving the sale (1031 exchange, divorce, estate, relocation)? That informs how much negotiation room exists.
- Schools are B-rated — typically a magnet for longer-tenancy family renters. What's the average tenant stay here, and is there a school-zone premium baked into asking?
- Crime grade is D in this area — have there been break-ins, vandalism, or insurance claims at this property in the last 3 years? What carrier currently insures it and at what premium?
- What's the average days-on-market for RENTAL listings here right now (not sales)? A rising rental-DOM trend means longer vacancies and softer asking-rent achievability than the comps imply.
- What's the recent tenant-quality profile in this submarket — average credit score on applications, eviction rate, late-payment / NSF rate, and stable-employment percentage? A property-management company in the area should have these aggregated.
- How much new apartment / multifamily construction is in the pipeline within 1–3 miles? Heavy new supply (>2% of stock underway) typically softens rents 12–24 months out; light construction supports rent growth.
Investment metrics
- 1% rule
- 1.15% ✓
- Cap rate
- 8.73%
- Cash-on-cash
- 8.69%
- DSCR
- 1.39
- GRM
- 7.3
CMA / ARV
- ARV (on-the-fly)
- $265,224
- Comps found
- 10
Show comp detail 10 sales within ~0.75 mi
| Address | Dist | Beds/Ba | Sqft | Sold | Price | $/sf | Match |
|---|---|---|---|---|---|---|---|
| 23-25 Leonard St | 0.26mi | 5/2.0 (+1) | 2,080 (+1%) | 9mo | $250,000 | $120 | 70 |
| 27 Saratoga Ave | 0.47mi | 3/2.0 (-1) | 2,013 (-2%) | 7mo | $260,000 | $129 | 60 |
| 221 N 3rd Ave | 0.60mi | 5/2.0 (+1) | 2,132 (+4%) | 2mo | $280,000 | $131 | 55 |
| 220 Saratoga Ave | 0.29mi | 5/2.0 (+1) | 1,824 (-11%) | 5mo | $259,000 | $142 | 54 |
| 249 Saratoga Ave | 0.35mi | 5/2.0 (+1) | 2,240 (+9%) | 11mo | $285,000 | $127 | 51 |
| 26 Walnut St | 0.32mi | 4/2.0 | 1,804 (-12%) | 13mo | $226,000 | $125 | 50 |
| 58 Mabbett St | 0.58mi | 5/3.0 (+1) | 2,100 (+2%) | 20mo | $287,200 | $137 | 48 |
| 39 William St | 0.57mi | 5/2.0 (+1) | 1,848 (-10%) | 5mo | $200,000 | $108 | 43 |
| 67 William St | 0.51mi | 5/2.0 (+1) | 2,238 (+9%) | 22mo | $160,000 | $71 | 34 |
| 76 East St | 0.61mi | 3/2.0 (-1) | 1,848 (-10%) | 17mo | $309,000 | $167 | 31 |
Match score weights: distance 35% · size 25% · config 20% · recency 20%. Top-matched comps best support the ARV.
Projected returns pro-forma
10.0% appreciation · 3.0% rent growth · sell at horizon
- IRR
- 30.6%
- Equity multiple
- 3.41×
- Total profit
- $181,994
- Equity at exit
- $243,237
- IRR
- 26.5%
- Equity multiple
- 7.73×
- Total profit
- $508,644
- Equity at exit
- $524,551
Cash invested: $75,600 (down + closing). Projections, not guarantees.
Landlord ↔ Tenant lean methodology
- Overall (STATE)
- 15 Strongly Tenant-Friendly
- State New York
- 15 Strongly Tenant-Friendly · D+10
- County
- — inherits STATE
- City
- — inherits STATE
ZIP-level market 12118
- Home prices YoY
- 8.3%
- Active inventory
- 144
- Price-to-rent
- 14.5×
Monthly cashflow live
- Estimated rent
- $3,094 high interval (Pro) →
- Mortgage (P&I)
- −$1,416
- Tax from tax record
- −$368 /mo · $4,419/yr
- Insurance
- −$112
- HOA
- −$0
- Vacancy / Maint / Mgmt
- −$650
- Net cashflow
- $548
Break-even live
2-unit breakdown (identical units grouped — click to expand)
| Units | Beds | Baths | Est. rent |
|---|---|---|---|
| 2× units | 2.0 | 1.5 | $3,094 |
| #1 | 2.0 | 1.5 | $1,547 |
| #2 | 2.0 | 1.5 | $1,547 |
| Total (2 units) | $3,094 | ||
UW: 25.0% down · 7.5% · 30yr · 1.5% tax · 5.0% vac · 8.0% maint · 8.0% mgmt
Financing live
Cash to close
- Down payment
- $67,500
- Closing costs
- $8,100
- Reserves months
- —
- Total cash needed
- —
Loan-product check · same deal, 3 products live
Conventional
25% down · 7.5% · 30yr
- Down + closing
- —
- Monthly P&I
- —
- Monthly cashflow
- —
- DSCR
- —
- Eligible?
- —
Personal DTI + credit; lowest rate.
DSCR
20% down · 8.5% · 30yr
- Down + closing
- —
- Monthly P&I
- —
- Monthly cashflow
- —
- DSCR
- —
- Eligible?
- —
No personal income docs; deal must DSCR.
Hard money
10% down · 12.0% · 12mo
- Down + closing
- —
- Monthly P&I
- —
- Monthly cashflow
- —
- DSCR
- —
- Eligible?
- —
Short-term bridge; refi at stabilization.
Rent comps 2 comps
| Address | Beds | Baths | Sqft | Rent | $/sqft | DOM | Units | Dist |
|---|---|---|---|---|---|---|---|---|
| 30 Revere Run Mechanicville, NY | 4.0 | 2.5 | 1997 | $3,450 | $1.73 | 14d | 1 | 0.48mi |
| 2 Battery Blvd Mechanicville, NY | 3.0 | 2.5 | 1804 | $3,450 | $1.91 | 14d | 1 | 0.52mi |
Listing history 2 events
-
2026-06-19remarks 148-char remark
-
2026-06-19$270,000 Pending 1 DOM
ⓘ Source: listings_history table (triggers on properties + properties_extension) + one-shot
backfill from property_details.listing_events for pre-trigger history.
Tax reassessment forecast NY · Partial reset (capped growth)
- Current annual tax
- $4,419 · $368/mo
- Projected year-2 tax
- $4,491 · $374/mo
- Expected delta
- +$72/yr (+$6/mo · 1.6%)
ⓘ Screening estimate from a state-policy table — verify with the county assessor before closing.
Climate risk First Street
- Flood 1/10 Low 0% chance over 30 yrs
- Wildfire 3/10 Moderate
- Heat 3/10 Moderate 7 d/yr ≥97°F today · 16 d/yr by 30 yrs out
- Wind 3/10 Moderate 5% chance of damaging wind over 30 yrs
- Air quality 2/10 Low 0 unhealthy d/yr today · 1 by 30 yrs out
Nearby sold comps map
Loading sold comps map…
Walkable amenities ~0.75 mi
Loading nearby amenities…
Taxation est. · year 1
- Rental income
- $37,128
- − Mortgage interest
- −$15,124
- − Property taxes
- −$4,419
- − Insurance
- −$1,350
- − Repairs & maintenance
- −$2,970
- − Management
- −$2,970
- − Depreciation
- −$7,855
- Taxable income
- $2,440
- Est. tax owed @ 24.0%
- −$586
- After-tax cash flow
- $5,986/yr
For passive investors: Depreciation is non-cash, so a rental often shows a tax loss while cash-flowing — sheltering income. Rental losses are passive: they offset passive income freely, and up to $25,000/yr can offset ordinary (W-2) income if you actively participate and your MAGI is under $100k (phasing out to $0 by $150k); unused losses carry forward. On sale, claimed depreciation is recaptured at up to 25%, and gains may owe capital-gains tax (a 1031 exchange can defer both). Figures are a year-1 estimate at your 24.0% rate — not tax advice; consult a CPA.
Schools (NCES district)
- District
- Mechanicville City School District
- NCES district ID
- 3618900
- Math proficiency
- 57% ▼ -3.00%
- Reading proficiency
- 57% ▲ 5.00%
- Median HH income
- $57,701
- Composite
- 49.33/100
- National rank
- #2021
- State rank
- #270 of 590 in NY
Livability — Mechanicville
- Score
- 67/100
- State rank
- #568
- US rank
- #10227
Category grades
Schools grade is shown separately in the Schools card above.
Census & demographics
- County
- Saratoga County · 166,192 people
- City population
- 17,069
- Metro
- Albany-Schenectady-Troy, NY
- Population (ZIP)
- 17,069
- Household income
- $92,710
- Rent vs Own
- Severe rent burden
- 552.0
Population outlook (Saratoga County) Hauer SSP2
- Today (2025)
- 238,889 people
- By 2030
- 243,681 · +2.0%
- By 2040
- 249,118 · +4.3%
- By 2050
- 248,638 · +4.1%
- By 2075
- 241,675 · +1.2%
- By 2100
- 213,150 · -10.8%
Race, ethnicity, and origin ACS 2023
- Neighborhood character
- Predominantly White (88%)
- Race & ethnicity
- White 88% Two or more races 5% Hispanic / Latino 4% Asian 3%
- Common ancestry
- Lithuanian 8% Romanian 8% Iranian 2%
- Foreign-born
- 5% · Canada, China
- Languages at home
- 92% English-only · Spanish 3% Other Indo-European 2% Chinese 1%
Political lean MEDSL · Saratoga
- 2024 margin
- Toss-up / Even · D 50.9% · R 49.1%
- 2008→2024 swing
- -1.6pp toward R · 2008: 3.4pp · 2024: 1.8pp
- All cycles
- 2024: D+1.8 2020: D+5.4 2016: R+4.4 2012: D+2.1 2008: D+3.4
Not yet ingested
- Civics
- —
Market trends
- HPI YoY
- ▲ 26.43%
- Current HPI
- 343.9893
- Rent YoY
- —
- Metro
- Albany-Schenectady-Troy, NY
- State GDP YoY
- ▲ 2.60%
- F500 in state
- 92
Industry mix (Fortune 500 HQ in NY)
| Industry | F500 HQs | Revenue |
|---|---|---|
| Financial Services | 10 | $950B |
|
||
| Consumer Goods | 9 | $162B |
|
||
| Insurance | 4 | $225B |
|
||
| Telecommunications | 2 | $144B |
|
||
| Pharmaceuticals | 2 | $112B |
|
||
| Media / Entertainment | 2 | $69B |
|
||
Price history
+1587.5% since first listed3 events — show timeline
- 2026-06-18 Pending — Global MLS
- 2026-06-18 Listed $270,000 Global MLS
- 1995-04-04 Sold (Public Records) $16,000 Public Records
Property tax history
+0.2%/yrLatest (2025): $4,419 · -7.8% YoY. Source: county tax records.
Cash-flow waterfall
monthlySold comps — $/sqft
last 12 mo · ≤1 miLoading sold comps…