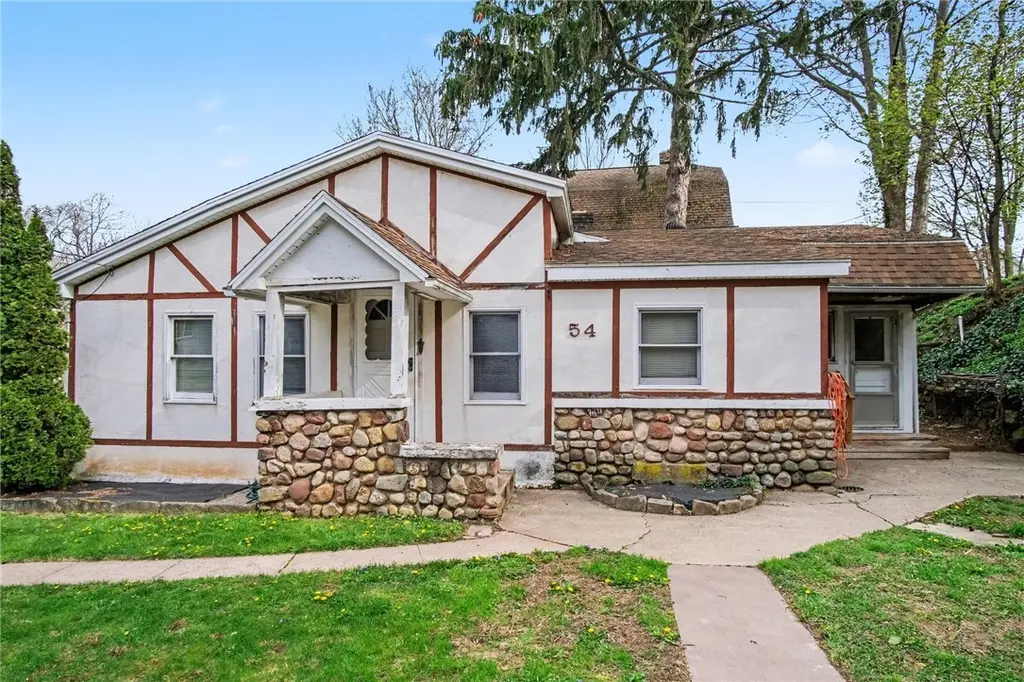
54 Nixon Dr · Irondequoit, NY
Flood risk 6/10 · Moderate
- FEMA flood zone
- X (unshaded)
- Chance of flooding over 30 yrs
- 0.68%
- Est. flood insurance / yr
- $473 – $860
Fire risk 2/10 · Minimal
- Est. fire insurance / yr
- $691 – $1,283
Heat risk 2/10 · Minimal
- Hot days now (above 95°F)
- 7 days/yr
- Hot days in 30 yrs
- 16 days/yr
Wind risk 1/10 · Minimal
- Chance of severe wind over 30 yrs
- 0.0%
Air-quality risk 2/10 · Minimal
- Unhealthy air days now
- 1 days/yr
- Unhealthy air days in 30 yrs
- 2 days/yr
Risk factors via First Street. Map © Google.
Why this score? — see what drove the B- grade
The composite is a weighted blend of 9 inputs, each scored 0–100. Each bar is that input's sub-score; the figure is the points it added to the 100-point composite (weight × sub-score).
- Cash flow +21.5/30.0
- ARV discount +15.0/15.0
- 1% rule +8.9/10.0
- DSCR +6.9/10.0
- Livability +4.0/5.0
- Schools +3.7/10.0
- Rent growth +2.5/5.0
- Condition / age +2.5/5.0
- Appreciation +0.0/10.0
$119,900
🖨 Deal sheet (PDF) 📄 Offer letter ✓ Due diligence
Listing remarks
Located in the heart of Seabreeze, This 3 bedroom, 1 full bath Ranch home has a 1 car detached garage and sits on a . 12 acre lot. A light filled living/dining room is at the center of the home. Offering a great place for entertaining. The kitchen features custom build cabinets, plenty of counter space and a first floor laundry area. There is even room for a breakfast table. The home offers s split bedroom situation with the primary bedroom on one side and two additional bedrooms on the other side . The full walkout basement features a workshop area with a sink. Outside you will find a generous sided partially fenced yard and a patio for summertime entertaining. Hot water tank is newer and
Key facts
- 5,227 sq ft lot
- Garage
- Built 1913
Property features AI
Finance
- Other: Property listed as resale and fixer
Exterior
- Parking: Detached garage with electricity; Driveway parking
- Utilities: Public water connected; Sewer connected; Cable available; Circuit breaker electrical service; Electric water heater
- Home design: Single-story property; Existing construction
- Construction: Stucco and wood siding exterior; Asphalt roof; Block foundation; Built as existing (year built details listed as existing)
- Exterior features: Blacktop driveway; Partial fencing; Patio and open porch; Shed(s) / exterior storage; Rectangular residential lot near public transit; City street frontage
Interior
- Kitchen: Electric oven and electric range; Refrigerator; Eat-in kitchen
- Bedrooms: Three main-level bedrooms
- Flooring: Carpet; Hardwood; Laminate; Tile; Varied flooring
- Bathrooms: One full bathroom on the main level
- Heating & cooling: Oil-fired forced air heating
- Interior features: Ceiling fans; Eat-in kitchen; Separate/formal living room; Combined living and dining area; Main-level primary bedroom; Bedroom on main level; Thermal windows
- Laundry & utility: Washer and dryer; Main-level laundry
Neighborhood map
What this means for you Summary
Snapshot
- This is a 3-bed/1.0-bath single-family listed at $120k.
Deal economics
- At list price, monthly cash flow is $180 ($2k/yr) — positive.
- The deal already cash-flows at list — no discount required.
- Meets the 1% rule at list price ($2k rent vs $120k).
- Cap rate 8.1% vs local median 4.5% in Irondequoit — top-decile yield for the area; either an underpriced asset or a hidden risk that comps aren't pricing in. Stress-test before assuming the spread holds.
Location & tenants
- Location reads 81/100 on livability (#92 in NY, #1,414 nationally) — a professional / high-income tenant draw. Strengths: housing A+, health & safety A+, crime B+; Watch: amenities F.
- East Irondequoit Central School District (suburban): math 40% / reading 47% proficiency, ranked #475 of 590 in NY (top 80%) — families likely to look elsewhere, expect single-tenant / working-renter base with shorter leases.
- Zoned schools: Ivan L Green Primary School (328 students, 58% FRL); East Irondequoit Middle School (math 20% / reading 36%, grade F, #573 of 729 statewide, top 79%, 676 students, 61% FRL); Eastridge Senior High School (math 93% / reading 82%, grade A, #304 of 1,100 statewide, top 28%, 850 students, 56% FRL).
- Zoned-school proficiency averages 58% at this address vs 44% district-wide (+14 pts) — the actual schools serving this property are materially stronger than the East Irondequoit Central School District average implies; a family-tenant draw the district grade alone would hide.
- Market conditions: 48 active listings in the ZIP; solid renter incomes; 1,169 units permitted in Monroe County in 2024 (591 in 5+ unit buildings).
Forward outlook
- Local home prices are declining (-3.0%/yr); year-one equity from $829 of loan paydown is wiped out by about $4k of value loss. Plan a longer hold.
- Monroe County population projected to shrink 6% by 2050 — rents likely to lag national; underwrite the cash flow, not the appreciation.
Negotiation context
- Only 6 days on market — expect competitive offers; lowballing is unlikely to land.
Risks & watch-outs
- Watch-outs: property tax is 4.6% of price; built in 1913 — expect roof / HVAC / electrical / plumbing capex.
- Climate carrying-cost: major flood risk — expect insurance premiums to compound above CPI over the hold.
Questions for the listing agent
- Built in 1913 — when were the roof, HVAC, electrical panel, plumbing, and water heater last replaced?
- Property tax is high relative to price — has the assessment been appealed recently, and will the sale trigger a re-assessment?
- Is there a deadline driving the sale (1031 exchange, divorce, estate, relocation)? That informs how much negotiation room exists.
- Schools are B-rated — typically a magnet for longer-tenancy family renters. What's the average tenant stay here, and is there a school-zone premium baked into asking?
- What's the average days-on-market for RENTAL listings here right now (not sales)? A rising rental-DOM trend means longer vacancies and softer asking-rent achievability than the comps imply.
- What's the recent tenant-quality profile in this submarket — average credit score on applications, eviction rate, late-payment / NSF rate, and stable-employment percentage? A property-management company in the area should have these aggregated.
- How much new for-sale + rental construction is in the pipeline within 1–3 miles? Heavy new supply typically softens prices + rents 12–24 months out; constrained supply supports both.
Investment metrics
- 1% rule
- 1.39% ✓
- Cap rate
- 8.09%
- Cash-on-cash
- 6.42%
- DSCR
- 1.29
- GRM
- 6.0
CMA / ARV
- ARV (median comp)
- $197,278
- List price
- $119,900
- Delta
- -39.22%
- Verdict
- UNDERPRICED
- Comps
- 20 within 1.0 mi
Show comp detail 12 sales within ~0.75 mi
| Address | Dist | Beds/Ba | Sqft | Sold | Price | $/sf | Match |
|---|---|---|---|---|---|---|---|
| 54 Nixon Dr | 0.00mi | 3/1.0 | 984 (0%) | 0mo | $127,500 | $130 | 100 |
| 180 Mallard Dr | 0.20mi | 2/1.0 (-1) | 956 (-3%) | 9mo | $175,000 | $183 | 73 |
| 50 Oberlin St | 0.05mi | 2/1.0 (-1) | 900 (-8%) | 7mo | $160,000 | $178 | 73 |
| 30 Bayton Dr | 0.41mi | 3/1.0 | 997 (+1%) | 8mo | $175,000 | $176 | 72 |
| 98 Bayton Dr | 0.36mi | 2/1.5 (-1) | 1,017 (+3%) | 5mo | $179,500 | $176 | 67 |
| 31 Broderick Dr | 0.17mi | 2/1.0 (-1) | 904 (-8%) | 9mo | $150,000 | $166 | 66 |
| 21 Topper Dr | 0.38mi | 3/1.0 | 1,008 (+2%) | 16mo | $165,000 | $164 | 65 |
| 256 Breezeway Dr | 0.31mi | 2/2.0 (-1) | 1,072 (+9%) | 1mo | $177,000 | $165 | 61 |
| 98 Keating Dr | 0.40mi | 2/1.0 (-1) | 924 (-6%) | 7mo | $180,000 | $195 | 60 |
| 83 Keating Dr | 0.42mi | 2/2.0 (-1) | 1,020 (+4%) | 7mo | $197,812 | $194 | 60 |
| 94 Birchwood Dr | 0.64mi | 3/1.0 | 1,086 (+10%) | 10mo | $200,000 | $184 | 45 |
| 107 Birchwood Dr | 0.65mi | 3/1.0 | 864 (-12%) | 11mo | $210,000 | $243 | 40 |
Match score weights: distance 35% · size 25% · config 20% · recency 20%. Top-matched comps best support the ARV.
Projected returns pro-forma
-3.0% appreciation · 3.0% rent growth · sell at horizon
- IRR
- -6.2%
- Equity multiple
- 0.77×
- Total profit
- $-7,769
- Equity at exit
- $17,877
- IRR
- 3.6%
- Equity multiple
- 1.26×
- Total profit
- $8,852
- Equity at exit
- $10,367
Cash invested: $33,572 (down + closing). Projections, not guarantees.
Landlord ↔ Tenant lean methodology
- Overall (STATE)
- 15 Strongly Tenant-Friendly
- State New York
- 15 Strongly Tenant-Friendly · D+10
- County
- — inherits STATE
- City
- — inherits STATE
ZIP-level market 14622
- Home prices YoY
- -8.1%
- Active inventory
- 48
- Price-to-rent
- 6.0×
Monthly cashflow live
- Estimated rent
- $1,671 medium interval (Pro) →
- Mortgage (P&I)
- −$629
- Tax from tax record
- −$462 /mo · $5,541/yr
- Insurance
- −$50
- HOA
- −$0
- Vacancy / Maint / Mgmt
- −$351
- Net cashflow
- $180
Break-even live
Sensitivity live
| Price | -10% $574 | -5% $214 | +0% $180 | +5% $146 | +10% $112 |
|---|---|---|---|---|---|
| Rent | -10% $48 | -5% $114 | +0% $180 | +5% $246 | +10% $312 |
| Rate | -1.0pp $240 | -0.5pp $210 | base $180 | +0.5pp $149 | +1.0pp $117 |
UW: 25.0% down · 7.5% · 30yr · 1.5% tax · 5.0% vac · 8.0% maint · 8.0% mgmt
Financing live
Cash to close
- Down payment
- $29,975
- Closing costs
- $3,597
- Reserves months
- —
- Total cash needed
- —
Loan-product check · same deal, 3 products live
Conventional
25% down · 7.5% · 30yr
- Down + closing
- —
- Monthly P&I
- —
- Monthly cashflow
- —
- DSCR
- —
- Eligible?
- —
Personal DTI + credit; lowest rate.
DSCR
20% down · 8.5% · 30yr
- Down + closing
- —
- Monthly P&I
- —
- Monthly cashflow
- —
- DSCR
- —
- Eligible?
- —
No personal income docs; deal must DSCR.
Hard money
10% down · 12.0% · 12mo
- Down + closing
- —
- Monthly P&I
- —
- Monthly cashflow
- —
- DSCR
- —
- Eligible?
- —
Short-term bridge; refi at stabilization.
Listing history 2 events
-
2026-05-06status Pending 1150-char remark
-
2026-04-30$119,900 Active 1150-char remark
ⓘ Source: listings_history table (triggers on properties + properties_extension) + one-shot
backfill from property_details.listing_events for pre-trigger history.
Tax reassessment forecast NY · Partial reset (capped growth)
- Current annual tax
- $5,541 · $462/mo
- Projected year-2 tax
- $5,541 · $462/mo
- Expected delta
- $0/yr ($0/mo · 0.0%)
ⓘ Screening estimate from a state-policy table — verify with the county assessor before closing.
Climate risk First Street
- Flood 6/10 Major FEMA zone X (unshaded) · 68% chance over 30 yrs
- Wildfire 2/10 Low
- Heat 2/10 Low 7 d/yr ≥95°F today · 16 d/yr by 30 yrs out
- Wind 1/10 Low 0% chance of damaging wind over 30 yrs
- Air quality 2/10 Low 1 unhealthy d/yr today · 2 by 30 yrs out
Nearby sold comps map
Loading sold comps map…
Walkable amenities ~0.75 mi
Loading nearby amenities…
Taxation est. · year 1
- Rental income
- $20,053
- − Mortgage interest
- −$6,716
- − Property taxes
- −$5,541
- − Insurance
- −$600
- − Repairs & maintenance
- −$1,604
- − Management
- −$1,604
- − Depreciation
- −$3,488
- Taxable income
- $500
- Est. tax owed @ 24.0%
- −$120
- After-tax cash flow
- $2,036/yr
For passive investors: Depreciation is non-cash, so a rental often shows a tax loss while cash-flowing — sheltering income. Rental losses are passive: they offset passive income freely, and up to $25,000/yr can offset ordinary (W-2) income if you actively participate and your MAGI is under $100k (phasing out to $0 by $150k); unused losses carry forward. On sale, claimed depreciation is recaptured at up to 25%, and gains may owe capital-gains tax (a 1031 exchange can defer both). Figures are a year-1 estimate at your 24.0% rate — not tax advice; consult a CPA.
Schools (NCES district)
- District
- East Irondequoit Central School District
- NCES district ID
- 3609690
- Math proficiency
- 40% ▼ -12.00%
- Reading proficiency
- 47% ▲ 8.00%
- Median HH income
- $48,946
- Composite
- 37.27/100
- National rank
- #4451
- State rank
- #475 of 590 in NY
Livability — Irondequoit
- Score
- 81/100
- State rank
- #92
- US rank
- #1414
Category grades
Schools grade is shown separately in the Schools card above.
Census & demographics
- Census place
- Irondequoit, NY
- County
- Monroe County · 674,131 people
- City population
- 74,252
- Metro
- Rochester, NY
- Population (ZIP)
- 12,574
- Household income
- $75,439
- Rent vs Own
- Severe rent burden
- 240.0
Population outlook (Monroe County) Hauer SSP2
- Today (2025)
- 759,460 people
- By 2030
- 757,154 · -0.3%
- By 2040
- 740,644 · -2.5%
- By 2050
- 714,443 · -5.9%
- By 2075
- 645,883 · -15.0%
- By 2100
- 547,084 · -28.0%
Race, ethnicity, and origin ACS 2023
- Neighborhood character
- Predominantly White (77%)
- Race & ethnicity
- White 77% Hispanic / Latino 10% Black 5% Two or more races 5% Asian 4%
- Hispanic origin (detail)
- Puerto Rican 8%
- Common ancestry
- Romanian 8% Lithuanian 2% Iranian 2%
- Foreign-born
- 6% · Canada, South Korea, Philippines
- Languages at home
- 89% English-only · Spanish 4% Russian/Polish/Slavic 2% Other Asian/Pacific 2%
Political lean MEDSL · Monroe
- 2024 margin
- D (+19.1) · D 59.5% · R 40.5%
- 2008→2024 swing
- +1.4pp toward D · 2008: 17.7pp · 2024: 19.1pp
- All cycles
- 2024: D+19.1 2020: D+21.0 2016: D+14.1 2012: D+17.4 2008: D+17.7
Not yet ingested
- Civics
- —
Market trends
- HPI YoY
- ▼ -23.93%
- Current HPI
- 271.5626
- Rent YoY
- —
- Metro
- Rochester, NY
- State GDP YoY
- ▲ 2.60%
- F500 in state
- 92
Industry mix (Fortune 500 HQ in NY)
| Industry | F500 HQs | Revenue |
|---|---|---|
| Financial Services | 10 | $950B |
|
||
| Consumer Goods | 9 | $162B |
|
||
| Insurance | 4 | $225B |
|
||
| Telecommunications | 2 | $144B |
|
||
| Pharmaceuticals | 2 | $112B |
|
||
| Media / Entertainment | 2 | $69B |
|
||
Price history
+6.3% since first listed3 events — show timeline
- 2026-06-09 Sold (MLS) $127,500 UNYREIS
- 2026-05-06 Pending — UNYREIS
- 2026-04-30 Listed $119,900 UNYREIS
Property tax history
+9.6%/yrLatest (2025): $5,541 · +68.7% YoY. Source: county tax records.
Cash-flow waterfall
monthlySold comps — $/sqft
last 12 mo · ≤1 miLoading sold comps…