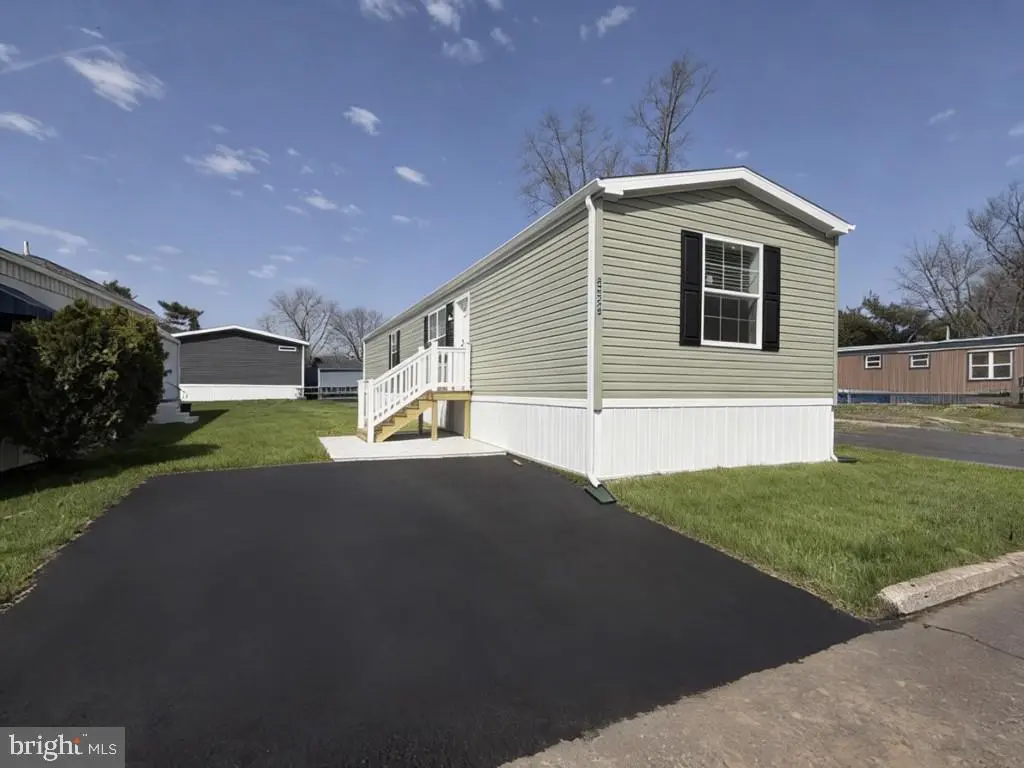
6326 Fuler Dr · Levittown, PA
Flood risk 1/10 · Minimal
- FEMA flood zone
- X (unshaded)
- Chance of flooding over 30 yrs
- 0.0%
- Est. flood insurance / yr
- $473 – $860
Fire risk 1/10 · Minimal
- Est. fire insurance / yr
- $511 – $949
Heat risk 6/10 · Moderate
- Hot days now (above 103°F)
- 7 days/yr
- Hot days in 30 yrs
- 15 days/yr
Wind risk 6/10 · Moderate
- Chance of severe wind over 30 yrs
- 27.0%
Air-quality risk 5/10 · Moderate
- Unhealthy air days now
- 6 days/yr
- Unhealthy air days in 30 yrs
- 8 days/yr
Risk factors via First Street. Map © Google.
Why this score? — see what drove the B- grade
The composite is a weighted blend of 9 inputs, each scored 0–100. Each bar is that input's sub-score; the figure is the points it added to the 100-point composite (weight × sub-score).
- Cash flow +30.0/30.0
- DSCR +10.0/10.0
- 1% rule +9.8/10.0
- Schools +5.2/10.0
- Livability +3.8/5.0
- Rent growth +3.3/5.0
- Condition / age +2.5/5.0
- ARV discount +1.5/15.0
- Appreciation +0.0/10.0
$148,500
🖨 Deal sheet (PDF) 📄 Offer letter ✓ Due diligence
Listing remarks MLS
This affordable home comes complete. Two bedrooms and two full baths. The main bath features a walk-in shower, and the other bath has a tub. There is a separate laundry area with all hook ups. Central air and upgraded kitchen appliances are also included. Built to last with all LED lighting. plus a 2 through 7-year warranty paid for by the factory. * * Driveways are being redone on April 7th and the lots have been graded and seed – Outside Photos only are AI generated
Key facts
- Led lighting
- Walk-in shower
- Central air
Tags
Neighborhood map
What this means for you Summary
Snapshot
- This is a 2-bed/2.0-bath manufactured listed at $148k.
Deal economics
- At list price, monthly cash flow is $827 ($10k/yr) — positive.
- The deal already cash-flows at list — no discount required.
- Meets the 1% rule at list price ($2k rent vs $148k).
- Recommended offer: $140k (6.0% below list) — sets the bar for market timing.
- Cap rate 13.0% vs local median 4.0% in Levittown — top-decile yield for the area; either an underpriced asset or a hidden risk that comps aren't pricing in. Stress-test before assuming the spread holds.
Location & tenants
- Location reads 75/100 on livability (#470 in PA, #4,342 nationally) — a middle-class / working-renter tenant base. Strengths: employment A+, housing A+, cost of living A-; Watch: amenities F, commute F.
- Pennsbury SD (suburban): math 46% / reading 69% proficiency, ranked #67 of 539 in PA (top 12%) — acceptable for families but not a draw, mixed tenant base, ~2y average lease; only 15% free/reduced lunch — higher-income household profile.
- Market conditions: Rents rising (+3.1%/yr); 175 active listings in the ZIP; high-income renter base; 663 units permitted in Bucks County in 2024 (106 in 5+ unit buildings).
Forward outlook
- Local home prices are declining (-3.0%/yr); year-one equity from $1k of loan paydown is wiped out by about $4k of value loss. Plan a longer hold.
- Bucks County population projected to shrink 7% by 2050 — rents likely to lag national; underwrite the cash flow, not the appreciation.
- At projected returns (-3.0% appreciation + 3.1% rent growth), your $42k cash investment doubles in ~6 years — after that, you're playing with house money.
Negotiation context
- It's been on market 84 days — a 6% lower offer ($140k) is reasonable based on typical stale-listing flexibility.
Risks & watch-outs
- Climate carrying-cost: major wind risk, 27% chance of damaging wind over 30y; extreme-heat days projected 7→15/yr by 2055 (HVAC capex compounding) — expect insurance premiums to compound above CPI over the hold.
Questions for the listing agent
- It's been on market 84 days. Have you received any prior offers? Is the seller open to a 6% concession, seller financing, or rate buy-down credit?
- Why hasn't it sold? Are there any deal-killer items the seller is aware of (foundation, flood, title, zoning, code violations)?
- Is there a deadline driving the sale (1031 exchange, divorce, estate, relocation)? That informs how much negotiation room exists.
- Schools are B-rated — typically a magnet for longer-tenancy family renters. What's the average tenant stay here, and is there a school-zone premium baked into asking?
- What's the average days-on-market for RENTAL listings here right now (not sales)? A rising rental-DOM trend means longer vacancies and softer asking-rent achievability than the comps imply.
- What's the recent tenant-quality profile in this submarket — average credit score on applications, eviction rate, late-payment / NSF rate, and stable-employment percentage? A property-management company in the area should have these aggregated.
- How much new for-sale + rental construction is in the pipeline within 1–3 miles? Heavy new supply typically softens prices + rents 12–24 months out; constrained supply supports both.
Investment metrics
- 1% rule
- 1.48% ✓
- Cap rate
- 12.98%
- Cash-on-cash
- 23.87%
- DSCR
- 2.06
- GRM
- 5.6
CMA / ARV
- ARV (median comp)
- $130,921
- List price
- $148,500
- Delta
- 13.43%
- Verdict
- OVERPRICED
- Comps
- 20 within 1.0 mi
Show comp detail 2 sales within ~0.75 mi
| Address | Dist | Beds/Ba | Sqft | Sold | Price | $/sf | Match |
|---|---|---|---|---|---|---|---|
| 1445 Old Bristol Pike #71 | 0.13mi | 2/1.0 | 900 (-15%) | 7mo | $59,900 | $67 | 59 |
| 1047 Aldrich Dr | 0.32mi | 3/2.0 (+1) | 924 (-12%) | 4mo | $130,000 | $141 | 56 |
Match score weights: distance 35% · size 25% · config 20% · recency 20%. Top-matched comps best support the ARV.
Projected returns pro-forma
-3.0% appreciation · 3.12% rent growth · sell at horizon
- IRR
- 17.2%
- Equity multiple
- 1.69×
- Total profit
- $28,840
- Equity at exit
- $22,142
- IRR
- 25.7%
- Equity multiple
- 3.26×
- Total profit
- $93,870
- Equity at exit
- $12,840
Cash invested: $41,580 (down + closing). Projections, not guarantees.
Landlord ↔ Tenant lean methodology
- Overall (STATE)
- 62 Landlord-Friendly
- State Pennsylvania
- 62 Landlord-Friendly · EVEN
- County
- — inherits STATE
- City
- — inherits STATE
ZIP-level market 19067
- Rents YoY
- 3.1%
- Active inventory
- 175
- Price-to-rent
- 5.6×
Monthly cashflow live
- Estimated rent
- $2,193 medium interval (Pro) →
- Mortgage (P&I)
- −$779
- Tax from tax record
- −$65 /mo · $779/yr
- Insurance
- −$62
- HOA
- −$0
- Vacancy / Maint / Mgmt
- −$461
- Net cashflow
- $827
Break-even live
Sensitivity live
| Price | -10% $911 | -5% $869 | +0% $827 | +5% $785 | +10% $743 |
|---|---|---|---|---|---|
| Rent | -10% $654 | -5% $740 | +0% $827 | +5% $914 | +10% $1,000 |
| Rate | -1.0pp $902 | -0.5pp $865 | base $827 | +0.5pp $789 | +1.0pp $749 |
UW: 25.0% down · 7.5% · 30yr · 1.5% tax · 5.0% vac · 8.0% maint · 8.0% mgmt
Financing live
Cash to close
- Down payment
- $37,125
- Closing costs
- $4,455
- Reserves months
- —
- Total cash needed
- —
Loan-product check · same deal, 3 products live
Conventional
25% down · 7.5% · 30yr
- Down + closing
- —
- Monthly P&I
- —
- Monthly cashflow
- —
- DSCR
- —
- Eligible?
- —
Personal DTI + credit; lowest rate.
DSCR
20% down · 8.5% · 30yr
- Down + closing
- —
- Monthly P&I
- —
- Monthly cashflow
- —
- DSCR
- —
- Eligible?
- —
No personal income docs; deal must DSCR.
Hard money
10% down · 12.0% · 12mo
- Down + closing
- —
- Monthly P&I
- —
- Monthly cashflow
- —
- DSCR
- —
- Eligible?
- —
Short-term bridge; refi at stabilization.
Listing history 16 events
-
2026-06-21days on market $148,500 Active 84 DOM
-
2026-06-18days on market $148,500 Active 81 DOM
-
2026-06-17days on market $148,500 Active 80 DOM
-
2026-06-16days on market $148,500 Active 79 DOM
-
2026-06-15days on market $148,500 Active 78 DOM
-
2026-06-13days on market $148,500 Active 76 DOM
-
2026-06-13days on market $148,500 Active 75 DOM
-
2026-06-09days on market $148,500 Active 72 DOM
-
2026-06-08days on market $148,500 Active 71 DOM
-
2026-06-07days on market $148,500 Active 70 DOM
-
2026-06-04days on market $148,500 Active 67 DOM
-
2026-06-03days on market $148,500 Active 66 DOM
-
2026-06-02days on market $148,500 Active 65 DOM
-
2026-06-01days on market $148,500 Active 64 DOM
-
2026-05-31days on market $148,500 Active 63 DOM
-
2026-03-29$148,500 Active 479-char remark
Show marketing remark (479 chars)
This affordable home comes complete. Two bedrooms and two full baths. The main bath features a walk-in shower, and the other bath has a tub. There is a separate laundry area with all hook ups. Central air and upgraded kitchen appliances are also included. Built to last with all LED lighting. plus a 2 through 7-year warranty paid for by the factory. * * Driveways are being redone on April 7th and the lots have been graded and seed – Outside Photos only are AI generated
ⓘ Source: listings_history table (triggers on properties + properties_extension) + one-shot
backfill from property_details.listing_events for pre-trigger history.
Tax reassessment forecast PA · Partial reset (capped growth)
- Current annual tax
- $779 · $65/mo
- Projected year-2 tax
- $1,562 · $130/mo
- Expected delta
- +$784/yr (+$65/mo · 100.7%)
ⓘ Screening estimate from a state-policy table — verify with the county assessor before closing.
Climate risk First Street
- Flood 1/10 Low FEMA zone X (unshaded) · 0% chance over 30 yrs
- Wildfire 1/10 Low
- Heat 6/10 Major 7 d/yr ≥103°F today · 15 d/yr by 30 yrs out
- Wind 6/10 Major 27% chance of damaging wind over 30 yrs
- Air quality 5/10 Major 6 unhealthy d/yr today · 8 by 30 yrs out
Nearby sold comps map
Loading sold comps map…
Walkable amenities ~0.75 mi
Loading nearby amenities…
Taxation est. · year 1
- Rental income
- $26,318
- − Mortgage interest
- −$8,318
- − Property taxes
- −$779
- − Insurance
- −$742
- − Repairs & maintenance
- −$2,105
- − Management
- −$2,105
- − Depreciation
- −$4,320
- Taxable income
- $7,948
- Est. tax owed @ 24.0%
- −$1,908
- After-tax cash flow
- $8,018/yr
For passive investors: Depreciation is non-cash, so a rental often shows a tax loss while cash-flowing — sheltering income. Rental losses are passive: they offset passive income freely, and up to $25,000/yr can offset ordinary (W-2) income if you actively participate and your MAGI is under $100k (phasing out to $0 by $150k); unused losses carry forward. On sale, claimed depreciation is recaptured at up to 25%, and gains may owe capital-gains tax (a 1031 exchange can defer both). Figures are a year-1 estimate at your 24.0% rate — not tax advice; consult a CPA.
Schools (NCES district)
- District
- Pennsbury SD
- NCES district ID
- 4218840
- Math proficiency
- 46% ▼ -13.00%
- Reading proficiency
- 69% ▼ -8.00%
- Median HH income
- $85,495
- Composite
- 52.3/100
- National rank
- #1594
- State rank
- #67 of 539 in PA
Livability — Levittown
- Score
- 75/100
- State rank
- #470
- US rank
- #4342
Category grades
Schools grade is shown separately in the Schools card above.
Census & demographics
- County
- Bucks County · 506,477 people
- City population
- 33,478
- Metro
- Philadelphia-Camden-Wilmington, PA-NJ-DE-MD
- Population (ZIP)
- 53,885
- Household income
- $133,630
- Rent vs Own
- Severe rent burden
- 1036.0
Population outlook (Bucks County) Hauer SSP2
- Today (2025)
- 630,973 people
- By 2030
- 627,093 · -0.6%
- By 2040
- 609,680 · -3.4%
- By 2050
- 584,225 · -7.4%
- By 2075
- 539,840 · -14.4%
- By 2100
- 483,970 · -23.3%
Race, ethnicity, and origin ACS 2023
- Neighborhood character
- Predominantly White (80%)
- Race & ethnicity
- White 80% Hispanic / Latino 7% Asian 6% Two or more races 5% Black 4%
- Hispanic origin (detail)
- Mexican 2% Puerto Rican 1% Dominican 1%
- Common ancestry
- Romanian 10% Scotch-Irish 2% Italian 2%
- Foreign-born
- 11% · Canada, China, Jamaica
- Languages at home
- 88% English-only · Spanish 5% Other Indo-European 3% Russian/Polish/Slavic 2%
Political lean MEDSL · Bucks
- 2024 margin
- Toss-up / Even · D 49.5% · R 49.5%
- 2008→2024 swing
- -8.7pp toward R · 2008: 8.7pp · 2024: -0.1pp
- All cycles
- 2024: R+0.1 2020: D+4.4 2016: D+0.6 2012: D+1.2 2008: D+8.7
Not yet ingested
- Civics
- —
Market trends
- HPI YoY
- ▼ -435.62%
- Current HPI
- 281.8167
- Rent YoY
- ▲ 3.12%
- Metro
- Philadelphia-Camden-Wilmington, PA-NJ-DE-MD
- State GDP YoY
- ▲ 1.68%
- F500 in state
- 34
Industry mix (Fortune 500 HQ in PA)
| Industry | F500 HQs | Revenue |
|---|---|---|
| Healthcare | 2 | $309B |
|
||
| Insurance | 2 | $27B |
|
||
| Telecommunications / Media | 1 | $124B |
|
||
| Industrial Distribution | 1 | $22B |
|
||
| Financial Services | 1 | $20B |
|
||
| Chemicals / Materials | 1 | $18B |
|
||
Price history
1 event — show timeline
- 2026-03-29 Listed $148,500 BRIGHT MLS
Property tax history
+1.1%/yrLatest (2021): $779 · +0.0% YoY. Source: county tax records.
Cash-flow waterfall
monthlySold comps — $/sqft
last 12 mo · ≤1 miLoading sold comps…