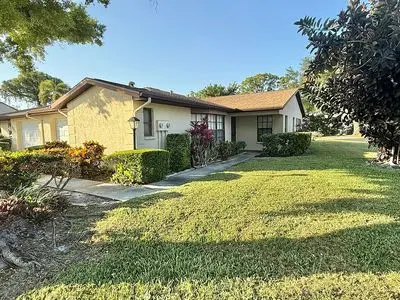
3112 Vivienda Blvd · Bayshore Gardens, FL
Flood risk 1/10 · Minimal
- FEMA flood zone
- X (unshaded)
- Chance of flooding over 30 yrs
- 0.0%
- Est. flood insurance / yr
- $507 – $1,088
Fire risk 1/10 · Minimal
- Est. fire insurance / yr
- $947 – $1,759
Heat risk 10/10 · Severe
- Hot days now (above 106°F)
- 7 days/yr
- Hot days in 30 yrs
- 30 days/yr
Wind risk 10/10 · Severe
- Chance of severe wind over 30 yrs
- 99.0%
Air-quality risk 2/10 · Minimal
- Unhealthy air days now
- 1 days/yr
- Unhealthy air days in 30 yrs
- 2 days/yr
Risk factors via First Street. Map © Google.
Why this score? — see what drove the D+ grade
The composite is a weighted blend of 9 inputs, each scored 0–100. Each bar is that input's sub-score; the figure is the points it added to the 100-point composite (weight × sub-score).
- Cash flow +18.9/30.0
- ARV discount +7.5/15.0
- DSCR +5.9/10.0
- Schools +4.4/10.0
- Livability +4.1/5.0
- 1% rule +4.0/10.0
- Condition / age +2.5/5.0
- Rent growth +1.1/5.0
- Appreciation +0.0/10.0
$199,500
🖨 Deal sheet (PDF) 📄 Offer letter ✓ Due diligence
Listing remarks
Maintenance-Free 55+ community corner villa offering 2 bedroom, 2 bath + sun room + Garage with open concept living space. Bring your custom designer finishes to restore the beauty to this home with great bones! Split bedroom floor plan with walk-in closets. Attached 1 car garage plus dual parking pad. Community Pool! Active 55+ community Vivienda II. HOA includes landscaping, roof, paint, cable TV, internet and more! Close to Detweiler& apos; s, IMG Academy, Golf courses! Easy access to Bradenton/Anna Maria Island Beaches and SRQ airport. Buyers agents welcome. Do NOT need a listing agent, No soliciting.
Key facts
- Attached garage
- Sun room
- Walk-in closets
Tags
Neighborhood map
What this means for you Summary
Snapshot
- This is a 2-bed/2.0-bath condo listed at $200k.
Deal economics
- At list price, monthly cash flow is $203 ($2k/yr) — positive.
- The deal already cash-flows at list — no discount required.
- To meet the 1% rule (rent ≥ 1% of price), the offer needs to be $179k (10.1% below list).
- Recommended offer: $179k (10.1% below list) — sets the bar for 1% rule.
- Cap rate 7.5% vs local median 4.7% in Bayshore Gardens — top-decile yield for the area; either an underpriced asset or a hidden risk that comps aren't pricing in. Stress-test before assuming the spread holds.
Location & tenants
- Location reads 82/100 on livability (#72 in FL, #1,180 nationally) — a professional / high-income tenant draw. Strengths: cost of living A+, housing A+, health & safety A+; Watch: crime C-, commute C-, schools F.
- Manatee (suburban): math 54% / reading 50% proficiency, ranked #26 of 73 in FL (top 36%) — acceptable for families but not a draw, mixed tenant base, ~2y average lease.
- Market conditions: Rents falling (-5.5%/yr); 361 active listings in the ZIP; 40 comparable units currently listed for rent nearby; rentals at typical pace (median 17d on market — plan ~3-4 weeks tenant-placement turnaround); 7,472 units permitted in Manatee County in 2024 (1,782 in 5+ unit buildings).
- At $1,793/mo this rent would consume 48% of the median local household income ($45k/yr) (locally 1474% of renters already pay >50% of income on rent) — very limited rent-growth headroom before tenants either downsize or default.
Forward outlook
- Local home prices are declining (-3.0%/yr); year-one equity from $1k of loan paydown is wiped out by about $6k of value loss. Plan a longer hold.
- Manatee County population projected at +43% by 2050 — long-run rental-demand tailwind backs the buy-and-hold thesis.
Negotiation context
- It's been on market 37 days — a 3% lower offer ($194k) is reasonable based on typical stale-listing flexibility.
- Current owner paid $75k; list at $200k implies a 166% gain — meaningful room to come down on a strong offer.
Risks & watch-outs
- Climate carrying-cost: severe wind risk, 99% chance of damaging wind over 30y; extreme-heat days projected 7→30/yr by 2055 (HVAC capex compounding) — expect insurance premiums to compound above CPI over the hold.
Questions for the listing agent
- It's been on market 37 days. Have you received any prior offers? Is the seller open to a 10% concession, seller financing, or rate buy-down credit?
- Any open or pending special assessments — roof, HVAC, plumbing, elevator, façade? What's the per-unit balance and payoff schedule, and is the seller paying it off at close or rolling it to the buyer?
- Is there a deadline driving the sale (1031 exchange, divorce, estate, relocation)? That informs how much negotiation room exists.
- Schools are F-rated, which usually means shorter tenancies and higher turnover. Who's the typical renter profile here, and what's been the actual vacancy rate?
- The area grade is low — what's the realistic commute time and amenity access for the typical tenant pool here? Any planned neighborhood developments (good or bad) we should know about?
- What's the average days-on-market for RENTAL listings here right now (not sales)? A rising rental-DOM trend means longer vacancies and softer asking-rent achievability than the comps imply.
- What's the recent tenant-quality profile in this submarket — average credit score on applications, eviction rate, late-payment / NSF rate, and stable-employment percentage? A property-management company in the area should have these aggregated.
- How much new apartment / multifamily construction is in the pipeline within 1–3 miles? Heavy new supply (>2% of stock underway) typically softens rents 12–24 months out; light construction supports rent growth.
Investment metrics
- 1% rule
- 0.90% ✗
- Cap rate
- 7.51%
- Cash-on-cash
- 4.36%
- DSCR
- 1.19
- GRM
- 9.3
CMA / ARV
No comps found within radius.
Projected returns pro-forma
-3.0% appreciation · 0.0% rent growth · sell at horizon
- IRR
- -12.6%
- Equity multiple
- 0.56×
- Total profit
- $-24,732
- Equity at exit
- $29,746
- IRR
- -8.3%
- Equity multiple
- 0.54×
- Total profit
- $-25,502
- Equity at exit
- $17,249
Cash invested: $55,860 (down + closing). Projections, not guarantees.
Landlord ↔ Tenant lean methodology
- Overall (STATE)
- 87 Strongly Landlord-Friendly
- State Florida
- 87 Strongly Landlord-Friendly · R+3
- County
- — inherits STATE
- City
- — inherits STATE
ZIP-level market 34207
- Rents YoY
- -5.5%
- Active inventory
- 361
- Price-to-rent
- 9.3×
Monthly cashflow live
- Estimated rent
- $1,793 high interval (Pro) →
- Mortgage (P&I)
- −$1,046
- Tax from tax record
- −$84 /mo · $1,010/yr
- Insurance
- −$83
- HOA
- −$0
- Vacancy / Maint / Mgmt
- −$377
- Net cashflow
- $203
Break-even live
Sensitivity live
| Price | -10% $316 | -5% $259 | +0% $203 | +5% $146 | +10% $90 |
|---|---|---|---|---|---|
| Rent | -10% $61 | -5% $132 | +0% $203 | +5% $274 | +10% $345 |
| Rate | -1.0pp $303 | -0.5pp $254 | base $203 | +0.5pp $151 | +1.0pp $99 |
UW: 25.0% down · 7.5% · 30yr · 1.5% tax · 5.0% vac · 8.0% maint · 8.0% mgmt
Financing live
Cash to close
- Down payment
- $49,875
- Closing costs
- $5,985
- Reserves months
- —
- Total cash needed
- —
Loan-product check · same deal, 3 products live
Conventional
25% down · 7.5% · 30yr
- Down + closing
- —
- Monthly P&I
- —
- Monthly cashflow
- —
- DSCR
- —
- Eligible?
- —
Personal DTI + credit; lowest rate.
DSCR
20% down · 8.5% · 30yr
- Down + closing
- —
- Monthly P&I
- —
- Monthly cashflow
- —
- DSCR
- —
- Eligible?
- —
No personal income docs; deal must DSCR.
Hard money
10% down · 12.0% · 12mo
- Down + closing
- —
- Monthly P&I
- —
- Monthly cashflow
- —
- DSCR
- —
- Eligible?
- —
Short-term bridge; refi at stabilization.
Rent comps 40 comps
| Address | Beds | Baths | Sqft | Rent | $/sqft | DOM | Units | Dist |
|---|---|---|---|---|---|---|---|---|
| 6033 34th St W Bradenton, FL | 2.0 | 2.0 | 942 | $1,550 | $1.64 | 4d | 3 | 0.12mi |
| 6033 34th St W Bradenton, FL | 2.0 | 2.0 | 942 | $1,625 | $1.73 | 4d | 2 | 0.12mi |
| 6033 34th St W Bradenton, FL | 2.0 | 2.0 | 996 | $1,500 | $1.51 | 25d | 2 | 0.12mi |
| 6050 34th St W Bradenton, FL | 1.0–2.0 | 1.0 | 734 | $1,610 | $2.19 | 3d | 19 | 0.17mi |
| 6101 34th St W Bradenton, FL | 2.0–3.0 | 2.0 | 1444 | $1,890 | $1.31 | 4d | 2 | 0.19mi |
| 3427 59th Ave W Bradenton, FL | 2.0 | 2.5 | 1330 | $2,150 | $1.62 | 17d | 1 | 0.28mi |
| 2713 60th Avenue Dr W Bradenton, FL | 2.0 | 2.0 | 1076 | $2,000 | $1.86 | 25d | 1 | 0.28mi |
| 3851 59th Ave W Unit 3851 Bradenton, FL | 2.0 | 2.0 | 912 | $1,500 | $1.64 | 25d | 1 | 0.31mi |
| 3843 59th Ave W Bradenton, FL | 2.0 | 2.0 | 912 | $1,200 | $1.32 | 25d | 1 | 0.31mi |
| 3848 59th Ave W Bradenton, FL | 2.0 | 2.0 | 912 | $1,395 | $1.53 | 25d | 1 | 0.34mi |
| 3533 59th Ave W Unit 3533 Bradenton, FL | 2.0 | 2.0 | 912 | $1,500 | $1.64 | 17d | 1 | 0.36mi |
| 5903 43rd St W Unit 5903 Bradenton, FL | 2.0 | 2.0 | 1178 | $2,950 | $2.50 | 25d | 1 | 0.36mi |
| 3773 59th Ave W Bradenton, FL | 2.0 | 2.0 | 912 | $1,595 | $1.75 | 25d | 1 | 0.37mi |
| 3545 59th Ave W #3545 Bradenton, FL | 3.0 | 2.0 | 1037 | $1,600 | $1.54 | 17d | 1 | 0.37mi |
| 3775 59th Ave W Unit 3775 Bradenton, FL | 2.0 | 2.0 | 912 | $3,500 | $3.84 | 25d | 1 | 0.38mi |
| 3527 59th Ave W Unit 3527 Bradenton, FL | 2.0 | 2.0 | 912 | $1,400 | $1.54 | 25d | 1 | 0.38mi |
| 3739 59th Ave W Unit 3739 Bradenton, FL | 2.0 | 2.0 | 912 | $1,575 | $1.73 | 17d | 1 | 0.40mi |
| 3774 59th Ave W Unit 3774 Bradenton, FL | 2.0 | 2.0 | 912 | $1,350 | $1.48 | 25d | 1 | 0.41mi |
| 3411 57th Avenue Dr W Bradenton, FL | 3.0 | 2.0 | 1326 | $2,100 | $1.58 | 25d | 1 | 0.43mi |
| 3646 59th Ave W Unit 3646 Bradenton, FL | 2.0 | 2.0 | 912 | $1,400 | $1.54 | 4d | 1 | 0.43mi |
| 5996 Hibiscus Dr #6 Bradenton, FL | 2.0 | 1.0 | 865 | $1,550 | $1.79 | 17d | 1 | 0.50mi |
| 3605 57th Avenue Dr W Bradenton, FL | 2.0 | 2.0 | 1454 | $2,100 | $1.44 | 4d | 1 | 0.51mi |
| 2423 60th Ave W Unit K29 Bradenton, FL | 2.0 | 2.0 | 1026 | $1,495 | $1.46 | 25d | 1 | 0.54mi |
| 6114 43rd St W Unit 407E Bradenton, FL | 2.0 | 2.0 | 1178 | $2,000 | $1.70 | 15d | 1 | 0.57mi |
| 2415 Holyoke Ave Bradenton, FL | 3.0 | 2.0 | 1134 | $2,599 | $2.29 | 25d | 1 | 0.57mi |
| 6043 Coral Way Bradenton, FL | 2.0 | 1.0 | 865 | $1,700 | $1.97 | 17d | 1 | 0.58mi |
| 3304 McDill Rd Bradenton, FL | 2.0 | 1.0 | 1044 | $1,695 | $1.62 | 13d | 1 | 0.59mi |
| 6116 43rd St W Unit 401D Bradenton, FL | 2.0 | 2.0 | 1178 | $2,500 | $2.12 | 25d | 1 | 0.60mi |
| 5906 Garden Ln Unit A22 Bradenton, FL | 2.0 | 2.0 | 840 | $1,200 | $1.43 | 4d | 1 | 0.61mi |
| 3506 54th Dr W Bradenton, FL | 1.0–2.0 | 1.0–2.0 | 953 | $2,800 | $2.94 | 4d | 2 | 0.64mi |
| 4119 61st Avenue Ter W #404 Bradenton, FL | 2.0 | 2.0 | 1178 | $1,500 | $1.27 | 25d | 1 | 0.64mi |
| 4119 61st Avenue Ter W #407 Bradenton, FL | 2.0 | 2.0 | 1178 | $1,695 | $1.44 | 4d | 1 | 0.64mi |
| 4119 61st Avenue Ter W #303 Bradenton, FL | 2.0 | 2.0 | 1178 | $1,800 | $1.53 | 25d | 1 | 0.64mi |
| 4119 61st Avenue Ter W Bradenton, FL | 2.0 | 2.0 | 1178 | $1,595 | $1.35 | 4d | 1 | 0.64mi |
| 3401 54th Dr W Bradenton, FL | 2.0–3.0 | 2.0–3.0 | 1293 | $3,300 | $2.55 | 4d | 3 | 0.64mi |
| 6147 43rd St W Bradenton, FL | 2.0 | 2.0 | 1116 | $3,200 | $2.87 | 25d | 1 | 0.66mi |
| 3702 54th Dr W Bradenton, FL | 2.0–3.0 | 2.0–3.0 | 1327 | $3,300 | $2.49 | 4d | 2 | 0.66mi |
| 6468 Seagull Dr #316 Bradenton, FL | 2.0 | 2.0 | 1314 | $3,900 | $2.97 | 25d | 1 | 0.67mi |
| 3604 54th Dr W Bradenton, FL | 2.0 | 2.0 | 1114 | $4,050 | $3.64 | 4d | 3 | 0.67mi |
| 2408 Colgate Ave Bradenton, FL | 3.0 | 2.0 | 1482 | $5,500 | $3.71 | 25d | 1 | 0.68mi |
HOA detail condo
- Monthly dues
- $0 · $0/yr
- Likely covers
- internetcablelandscapingpool
- Assessments
- None detected in remarks — confirm with the listing agent.
Listing history 19 events
-
2026-06-18days on market $199,500 Active 37 DOM
-
2026-06-17days on market $199,500 Active 36 DOM
-
2026-06-16days on market $199,500 Active 35 DOM
-
2026-06-16price $199,500 Active 34 DOM
-
2026-06-15days on market $199,900 Active 34 DOM
-
2026-06-13days on market $199,900 Active 32 DOM
-
2026-06-13days on market $199,900 Active 31 DOM
-
2026-06-10days on market $199,900 Active 29 DOM
-
2026-06-09days on market $199,900 Active 28 DOM
-
2026-06-08days on market $199,900 Active 27 DOM
-
2026-06-08days on market $199,900 Active 26 DOM
-
2026-06-03days on market $199,900 Active 22 DOM
-
2026-06-02days on market $199,900 Active 21 DOM
-
2026-06-01days on market $199,900 Active 20 DOM
-
2026-05-31days on market $199,900 Active 19 DOM
-
2026-05-12$199,900 Active
-
1990-11-20soldstatus $74,900
-
1988-12-09soldstatus $59,900
-
1988-11-01soldstatus $58,100
ⓘ Source: listings_history table (triggers on properties + properties_extension) + one-shot
backfill from property_details.listing_events for pre-trigger history.
Tax reassessment forecast FL · Resets to sale price
- Current annual tax
- $1,010 · $84/mo
- Projected year-2 tax
- $1,656 · $138/mo
- Expected delta
- +$646/yr (+$54/mo · 64.0%)
ⓘ Screening estimate from a state-policy table — verify with the county assessor before closing.
Climate risk First Street
- Flood 1/10 Low FEMA zone X (unshaded) · 0% chance over 30 yrs
- Wildfire 1/10 Low
- Heat 10/10 Extreme 7 d/yr ≥106°F today · 30 d/yr by 30 yrs out
- Wind 10/10 Extreme 99% chance of damaging wind over 30 yrs
- Air quality 2/10 Low 1 unhealthy d/yr today · 2 by 30 yrs out
Nearby sold comps map
Loading sold comps map…
Walkable amenities ~0.75 mi
Loading nearby amenities…
Taxation est. · year 1
- Rental income
- $21,515
- − Mortgage interest
- −$11,175
- − Property taxes
- −$1,010
- − Insurance
- −$998
- − Repairs & maintenance
- −$1,721
- − Management
- −$1,721
- − Depreciation
- −$5,804
- Taxable loss
- −$913
- Est. tax savings @ 24.0%
- +$219
- After-tax cash flow
- $2,654/yr
For passive investors: Depreciation is non-cash, so a rental often shows a tax loss while cash-flowing — sheltering income. Rental losses are passive: they offset passive income freely, and up to $25,000/yr can offset ordinary (W-2) income if you actively participate and your MAGI is under $100k (phasing out to $0 by $150k); unused losses carry forward. On sale, claimed depreciation is recaptured at up to 25%, and gains may owe capital-gains tax (a 1031 exchange can defer both). Figures are a year-1 estimate at your 24.0% rate — not tax advice; consult a CPA.
Schools (NCES district)
- District
- Manatee
- NCES district ID
- 1201230
- Math proficiency
- 54% ▼ -6.00%
- Reading proficiency
- 50% ▼ -2.00%
- Median HH income
- $49,607
- Composite
- 44.43/100
- National rank
- #2806
- State rank
- #26 of 73 in FL
Livability — Bayshore Gardens
- Score
- 82/100
- State rank
- #72
- US rank
- #1180
Category grades
Schools grade is shown separately in the Schools card above.
Census & demographics
- Census place
- Bayshore Gardens, FL
- County
- Manatee County · 416,364 people
- City population
- 33,840
- Metro
- North Port-Sarasota-Bradenton, FL
- Population (ZIP)
- 34,081
- Household income
- $45,010
- Rent vs Own
- Severe rent burden
- 1474.0
Population outlook (Manatee County) Hauer SSP2
- Today (2025)
- 447,342 people
- By 2030
- 488,911 · +9.3%
- By 2040
- 567,934 · +27.0%
- By 2050
- 637,995 · +42.6%
- By 2075
- 781,970 · +74.8%
- By 2100
- 848,272 · +89.6%
Race, ethnicity, and origin ACS 2023
- Neighborhood character
- Diverse neighborhood (Simpson 0.57)
- Race & ethnicity
- White 58% Hispanic / Latino 29% Two or more races 13% Black 7%
- Hispanic origin (detail)
- Mexican 12% Puerto Rican 4% Cuban 3% Dominican 1%
- Common ancestry
- Lithuanian 3% Romanian 2% Slovak 2%
- Foreign-born
- 16% · Canada, Jamaica
- Languages at home
- 74% English-only · Spanish 22% Other Indo-European 1% French/Haitian/Cajun 1%
Political lean MEDSL · Manatee
- 2024 margin
- Strong R (+23.5) · D 37.9% · R 61.4%
- 2008→2024 swing
- -16.5pp toward R · 2008: -7.0pp · 2024: -23.5pp
- All cycles
- 2024: R+23.5 2020: R+16.1 2016: R+17.1 2012: R+12.5 2008: R+7.0
Not yet ingested
- Civics
- —
Market trends
- HPI YoY
- ▼ -305.32%
- Current HPI
- 369.9899
- Rent YoY
- ▼ -5.50%
- Metro
- North Port-Sarasota-Bradenton, FL
- State GDP YoY
- ▲ 3.28%
- F500 in state
- 36
Industry mix (Fortune 500 HQ in FL)
| Industry | F500 HQs | Revenue |
|---|---|---|
| Industrial Technology | 2 | $29B |
|
||
| Insurance | 2 | $17B |
|
||
| Retail | 1 | $60B |
|
||
| Technology Distribution | 1 | $58B |
|
||
| Homebuilding | 1 | $35B |
|
||
| Technology Manufacturing | 1 | $35B |
|
||
Price history
+244.1% since first listed4 events — show timeline
- 2026-05-12 Listed $199,900 FSBO.com
- 1990-11-20 Sold (Public Records) $74,900 Public Records
- 1988-12-09 Sold (Public Records) $59,900 Public Records
- 1988-11-01 Sold (Public Records) $58,100 Public Records
Property tax history
+2.9%/yrLatest (2025): $1,010 · +5.1% YoY. Source: county tax records.
Cash-flow waterfall
monthlySold comps — $/sqft
last 12 mo · ≤1 miLoading sold comps…