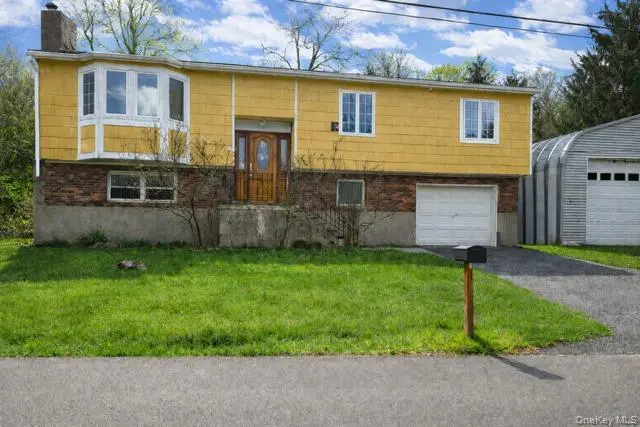
9 Wykagyl Ct · Lake Carmel, NY
Flood risk 9/10 · Severe
- FEMA flood zone
- X (unshaded)
- Chance of flooding over 30 yrs
- 0.99%
- Est. flood insurance / yr
- $473 – $860
Fire risk 3/10 · Minor
- Est. fire insurance / yr
- $691 – $1,283
Heat risk 4/10 · Minor
- Hot days now (above 96°F)
- 7 days/yr
- Hot days in 30 yrs
- 15 days/yr
Wind risk 6/10 · Moderate
- Chance of severe wind over 30 yrs
- 27.0%
Air-quality risk 3/10 · Minor
- Unhealthy air days now
- 2 days/yr
- Unhealthy air days in 30 yrs
- 3 days/yr
Risk factors via First Street. Map © Google.
Why this score? — see what drove the B grade
The composite is a weighted blend of 9 inputs, each scored 0–100. Each bar is that input's sub-score; the figure is the points it added to the 100-point composite (weight × sub-score).
- Cash flow +26.6/30.0
- ARV discount +15.0/15.0
- DSCR +9.1/10.0
- 1% rule +7.1/10.0
- Schools +5.0/10.0
- Livability +3.3/5.0
- Rent growth +2.5/5.0
- Condition / age +2.5/5.0
- Appreciation +0.0/10.0
$350,000
🖨 Deal sheet 📄 Offer letter ✓ Due diligence
Listing remarks
Opportunity awaits near Lake Carmel! This spacious 4-bedroom, 2-bath home offers a versatile layout with a formal dining room, living room, and separate lower-level family room, along with an in-ground pool and detached oversized garage. In need of rehabilitation, this property is ideal for an end user ready to create their dream home or an investor/contractor looking for their next project. With generous space, strong potential, and a desirable setting near Lake Carmel, this is a chance to bring fresh vision and value to a property with great upside. Cash purchase or 203k loan required. Photos are digitally enhanced and staged for marketing purposes.
Key facts
- Versatile layout
- Formal dining room
- In ground pool
Tags
Property features AI
Exterior
- Parking: Attached garage; Detached garage; 2 garage spaces; No carport
- Utilities: Public sewer; Trash collection (public)
- Home design: Single-family residence; Living area reported from public records
- Construction: Construction materials: Other; Foundation: Other
- Exterior features: Not waterfront; Construction materials: Other; Foundation: Other
Interior
- Kitchen: Dishwasher; Oven; Range; Refrigerator
- Bedrooms: Rooms total: 5 (includes bedrooms and living spaces)
- Bathrooms: 2 full bathrooms
- Heating & cooling: Hot water heating; Central air conditioning
- Interior features: First-floor bedroom; First-floor full bath; Formal dining room; Full basement; Full attic
- Laundry & utility: Washer; Dryer
Neighborhood map
What this means for you Summary
Snapshot
- This is a 4-bed/2.0-bath single-family listed at $350k.
Deal economics
- At list price, monthly cash flow is $883 ($11k/yr) — positive.
- The deal already cash-flows at list — no discount required.
- Meets the 1% rule at list price ($4k rent vs $350k).
- Cap rate 9.5% vs local median 2.3% in Lake Carmel — top-decile yield for the area; either an underpriced asset or a hidden risk that comps aren't pricing in. Stress-test before assuming the spread holds.
Location & tenants
- Location reads 66/100 on livability (#650 in NY) — a middle-class / working-renter tenant base. Strengths: employment A+, housing A+; Watch: amenities F, commute F, cost of living F.
- Carmel Central School District (suburban): math 46% / reading 63% proficiency, ranked #258 of 590 in NY (top 44%) — acceptable for families but not a draw, mixed tenant base, ~2y average lease; only 17% free/reduced lunch — higher-income household profile.
- Zoned schools: Kent Elementary School (math 37% / reading 67%, grade C-, #988 of 2,108 statewide, top 49%, 394 students, 29% FRL); George Fischer Middle School (math 21% / reading 56%, grade F, #437 of 729 statewide, top 60%, 1,130 students, 38% FRL); Carmel High School (math 97% / reading 87%, grade A+, #171 of 1,100 statewide, top 18%, 1,365 students, 36% FRL) — zoned schools average 34% FRL vs 17% district-wide (18 pts higher); higher-poverty schools than district average — tighter screening recommended.
- Market conditions: 227 active listings in the ZIP; 1 comparable units currently listed for rent nearby; 142 units permitted in Putnam County in 2024 (75 in 5+ unit buildings).
Forward outlook
- Local home prices are declining (-3.0%/yr); year-one equity from $2k of loan paydown is wiped out by about $10k of value loss. Plan a longer hold.
- Putnam County population projected to shrink 3% by 2050 — rents likely to lag national; underwrite the cash flow, not the appreciation.
- At projected returns (-3.0% appreciation + 3.0% rent growth), your $98k cash investment doubles in ~10 years — after that, you're playing with house money.
Negotiation context
- Only 8 days on market — expect competitive offers; lowballing is unlikely to land.
Risks & watch-outs
- Watch-outs: flood insurance adds $56/mo.
- Climate carrying-cost: severe flood risk; major wind risk, 27% chance of damaging wind over 30y — expect insurance premiums to compound above CPI over the hold.
Questions for the listing agent
- Built in 1974 — when were the roof, HVAC, electrical panel, plumbing, and water heater last replaced?
- What's the actual annual flood-insurance premium (NFIP or private), and is the property in a SFHA with mandatory coverage?
- Is there a deadline driving the sale (1031 exchange, divorce, estate, relocation)? That informs how much negotiation room exists.
- Schools are D-rated, which usually means shorter tenancies and higher turnover. Who's the typical renter profile here, and what's been the actual vacancy rate?
- What's the average days-on-market for RENTAL listings here right now (not sales)? A rising rental-DOM trend means longer vacancies and softer asking-rent achievability than the comps imply.
- What's the recent tenant-quality profile in this submarket — average credit score on applications, eviction rate, late-payment / NSF rate, and stable-employment percentage? A property-management company in the area should have these aggregated.
- How much new for-sale + rental construction is in the pipeline within 1–3 miles? Heavy new supply typically softens prices + rents 12–24 months out; constrained supply supports both.
Investment metrics
- 1% rule
- 1.21% ✓
- Cap rate
- 9.51%
- Cash-on-cash
- 11.49%
- DSCR
- 1.51
- GRM
- 6.9
CMA / ARV
- ARV (median comp)
- $585,055
- List price
- $350,000
- Delta
- -40.18%
- Verdict
- UNDERPRICED
- Comps
- 20 within 1.0 mi
Show comp detail 12 sales within ~0.75 mi
| Address | Dist | Beds/Ba | Sqft | Sold | Price | $/sf | Match |
|---|---|---|---|---|---|---|---|
| 45 Worthington Dr W | 0.26mi | 3/1.5 (-1) | 1,993 (-1%) | 9mo | $462,000 | $232 | 72 |
| 39 Worthington Dr W | 0.23mi | 4/1.0 | 1,800 (-10%) | 2mo | $455,000 | $253 | 67 |
| 10 Byram Rd | 0.23mi | 3/5.0 (-1) | 2,100 (+5%) | 4mo | $630,000 | $300 | 62 |
| 24 Baldwin Rd | 0.31mi | 3/2.0 (-1) | 2,200 (+10%) | 13mo | $590,000 | $268 | 54 |
| 15 Harvard Dr | 0.57mi | 3/2.5 (-1) | 2,118 (+6%) | 8mo | $510,000 | $241 | 50 |
| 35 William St | 0.56mi | 3/1.5 (-1) | 2,016 (+0%) | 20mo | $504,000 | $250 | 50 |
| 12 Ontario Rd | 0.65mi | 3/2.0 (-1) | 2,084 (+4%) | 11mo | $470,000 | $226 | 49 |
| 129 W Lakeshore Dr | 0.68mi | 3/2.0 (-1) | 2,100 (+5%) | 9mo | $643,000 | $306 | 48 |
| 21 Oneonta Rd | 0.72mi | 3/2.0 (-1) | 1,920 (-4%) | 9mo | $525,000 | $273 | 47 |
| 1 Roslyn Rd | 0.49mi | 3/2.0 (-1) | 1,721 (-14%) | 8mo | $455,000 | $264 | 42 |
| 135 Cottage Rd | 0.55mi | 3/2.0 (-1) | 1,748 (-13%) | 8mo | $435,000 | $249 | 41 |
| 10 Placid Dr | 0.43mi | 3/2.0 (-1) | 1,754 (-13%) | 19mo | $412,700 | $235 | 38 |
Match score weights: distance 35% · size 25% · config 20% · recency 20%. Top-matched comps best support the ARV.
Projected returns pro-forma
-3.0% appreciation · 3.0% rent growth · sell at horizon
- IRR
- -0.1%
- Equity multiple
- 1.00×
- Total profit
- $-366
- Equity at exit
- $52,186
- IRR
- 9.6%
- Equity multiple
- 1.74×
- Total profit
- $72,512
- Equity at exit
- $30,262
Cash invested: $98,000 (down + closing). Projections, not guarantees.
Landlord ↔ Tenant lean methodology
- Overall (STATE)
- 15 Strongly Tenant-Friendly
- State New York
- 15 Strongly Tenant-Friendly · D+10
- County
- — inherits STATE
- City
- — inherits STATE
ZIP-level market 10512
- Home prices YoY
- -25.5%
- Active inventory
- 227
- Price-to-rent
- 6.9×
Monthly cashflow live
- Estimated rent
- $4,250 medium interval (Pro) →
- Mortgage (P&I)
- −$1,835
- Tax est. 1.5%
- −$438 /mo · $5,250/yr
- Insurance
- −$146
- Flood insurance flood zone
- −$56 /mo · $666/yr
- HOA
- −$0
- Vacancy / Maint / Mgmt
- −$892
- Net cashflow
- $883
Break-even live
UW: 25.0% down · 7.5% · 30yr · 1.5% tax · 5.0% vac · 8.0% maint · 8.0% mgmt
Financing live
Cash to close
- Down payment
- $87,500
- Closing costs
- $10,500
- Reserves months
- —
- Total cash needed
- —
Loan-product check · same deal, 3 products live
Conventional
25% down · 7.5% · 30yr
- Down + closing
- —
- Monthly P&I
- —
- Monthly cashflow
- —
- DSCR
- —
- Eligible?
- —
Personal DTI + credit; lowest rate.
DSCR
20% down · 8.5% · 30yr
- Down + closing
- —
- Monthly P&I
- —
- Monthly cashflow
- —
- DSCR
- —
- Eligible?
- —
No personal income docs; deal must DSCR.
Hard money
10% down · 12.0% · 12mo
- Down + closing
- —
- Monthly P&I
- —
- Monthly cashflow
- —
- DSCR
- —
- Eligible?
- —
Short-term bridge; refi at stabilization.
Rent comps 1 comps
| Address | Beds | Baths | Sqft | Rent | $/sqft | DOM | Units | Dist |
|---|---|---|---|---|---|---|---|---|
| 10 Vernon Dr Carmel, NY | 3.0 | 2.0 | 2074 | $4,250 | $2.05 | 43d | 1 | 0.98mi |
Listing history 1 events
-
2026-05-05$350,000 Active
ⓘ Source: listings_history table (triggers on properties + properties_extension) + one-shot
backfill from property_details.listing_events for pre-trigger history.
Climate risk First Street
- Flood 9/10 Extreme FEMA zone X (unshaded) · 99% chance over 30 yrs
- Wildfire 3/10 Moderate
- Heat 4/10 Moderate 7 d/yr ≥96°F today · 15 d/yr by 30 yrs out
- Wind 6/10 Major 27% chance of damaging wind over 30 yrs
- Air quality 3/10 Moderate 2 unhealthy d/yr today · 3 by 30 yrs out
Nearby sold comps map
Loading sold comps map…
Walkable amenities ~0.75 mi
Loading nearby amenities…
Taxation est. · year 1
- Rental income
- $51,000
- − Mortgage interest
- −$19,605
- − Property taxes
- −$5,250
- − Insurance
- −$2,416
- − Repairs & maintenance
- −$4,080
- − Management
- −$4,080
- − Depreciation
- −$10,182
- Taxable income
- $5,386
- Est. tax owed @ 24.0%
- −$1,293
- After-tax cash flow
- $9,306/yr
For passive investors: Depreciation is non-cash, so a rental often shows a tax loss while cash-flowing — sheltering income. Rental losses are passive: they offset passive income freely, and up to $25,000/yr can offset ordinary (W-2) income if you actively participate and your MAGI is under $100k (phasing out to $0 by $150k); unused losses carry forward. On sale, claimed depreciation is recaptured at up to 25%, and gains may owe capital-gains tax (a 1031 exchange can defer both). Figures are a year-1 estimate at your 24.0% rate — not tax advice; consult a CPA.
Schools (NCES district)
- District
- Carmel Central School District
- NCES district ID
- 3606570
- Math proficiency
- 46% ▼ -15.00%
- Reading proficiency
- 63% ▲ 11.00%
- Median HH income
- $87,665
- Composite
- 50.05/100
- National rank
- #1914
- State rank
- #258 of 590 in NY
Livability — Lake Carmel
- Score
- 66/100
- State rank
- #650
- US rank
- #12139
Category grades
Schools grade is shown separately in the Schools card above.
Census & demographics
- Census place
- Lake Carmel, NY
- Population (ZIP)
- 24,238
Population outlook (Putnam County) Hauer SSP2
- Today (2025)
- 99,705 people
- By 2030
- 99,650 · -0.1%
- By 2040
- 98,641 · -1.1%
- By 2050
- 96,348 · -3.4%
- By 2075
- 94,412 · -5.3%
- By 2100
- 88,728 · -11.0%
Race, ethnicity, and origin ACS 2023
- Neighborhood character
- Predominantly White (73%)
- Race & ethnicity
- White 73% Hispanic / Latino 18% Two or more races 9% Black 4% Asian 2%
- Hispanic origin (detail)
- Puerto Rican 6% Dominican 3%
- Common ancestry
- Romanian 4% Italian 2% Lithuanian 1%
- Foreign-born
- 14% · Canada, China, Jamaica
- Languages at home
- 80% English-only · Spanish 11% Other Indo-European 4% Russian/Polish/Slavic 2%
Political lean MEDSL · Putnam
- 2024 margin
- R (+13.7) · D 43.2% · R 56.8%
- 2008→2024 swing
- -6.2pp toward R · 2008: -7.5pp · 2024: -13.7pp
- All cycles
- 2024: R+13.7 2020: R+7.9 2016: R+17.8 2012: R+11.2 2008: R+7.5
Not yet ingested
- Civics
- —
Market trends
- HPI YoY
- ▼ -88.73%
- Current HPI
- 258.8452
- Rent YoY
- —
- Metro
- —
- State GDP YoY
- ▲ 2.60%
- F500 in state
- 92
Industry mix (Fortune 500 HQ in NY)
| Industry | F500 HQs | Revenue |
|---|---|---|
| Financial Services | 10 | $950B |
|
||
| Consumer Goods | 9 | $162B |
|
||
| Insurance | 4 | $225B |
|
||
| Telecommunications | 2 | $144B |
|
||
| Pharmaceuticals | 2 | $112B |
|
||
| Media / Entertainment | 2 | $69B |
|
||
Price history
2 events — show timeline
- 2026-05-27 Pending — OneKey® MLS as Distributed by MLS Grid
- 2026-05-05 Listed $350,000 OneKey® MLS as Distributed by MLS Grid
Property tax history
+9.5%/yrLatest (2025): $19,040 · +37.0% YoY. Source: county tax records.
Cash-flow waterfall
monthlySold comps — $/sqft
last 12 mo · ≤1 miLoading sold comps…