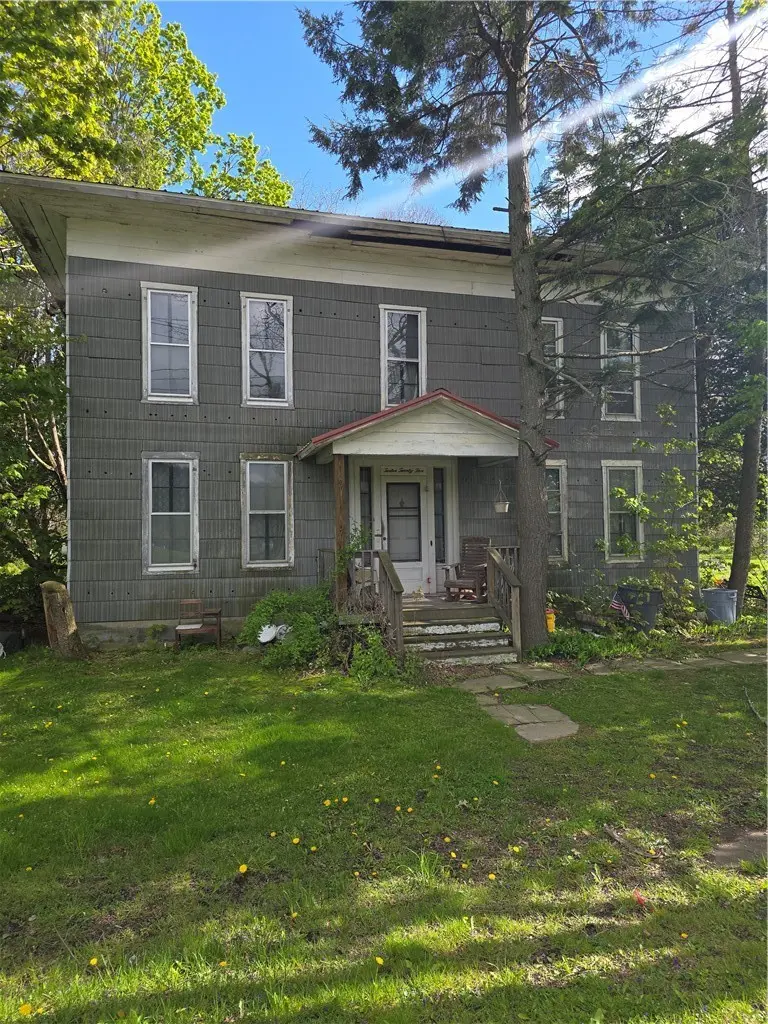
1225 Pennsylvania Ave · Southport, NY
Flood risk 8/10 · Major
- FEMA flood zone
- X (shaded)
- Chance of flooding over 30 yrs
- 0.99%
- Est. flood insurance / yr
- $473 – $860
Fire risk 2/10 · Minimal
- Est. fire insurance / yr
- $691 – $1,283
Heat risk 3/10 · Minor
- Hot days now (above 94°F)
- 7 days/yr
- Hot days in 30 yrs
- 17 days/yr
Wind risk 2/10 · Minimal
- Chance of severe wind over 30 yrs
- 1.0%
Air-quality risk 1/10 · Minimal
- Unhealthy air days now
- 0 days/yr
- Unhealthy air days in 30 yrs
- 0 days/yr
Risk factors via First Street. Map © Google.
Why this score? — see what drove the B+ grade
The composite is a weighted blend of 9 inputs, each scored 0–100. Each bar is that input's sub-score; the figure is the points it added to the 100-point composite (weight × sub-score).
- Cash flow +30.0/30.0
- 1% rule +10.0/10.0
- DSCR +10.0/10.0
- Appreciation +10.0/10.0
- ARV discount +7.5/15.0
- Livability +3.2/5.0
- Rent growth +2.5/5.0
- Condition / age +2.5/5.0
- Schools +2.4/10.0
$40,000
🖨 Deal sheet (PDF) 📄 Offer letter ✓ Due diligence
Listing remarks
This historic 1826-built home offers 1,872 sq. ft. of potential on a spacious 0.49-acre lot. Vacant for 10 years, this property is a "blank canvas" restoration project for a savvy investor or contractor. Located in a quiet neighborhood near Broadway Elementary, it features a detached garage and a large, flat yard. Property is being sold strictly AS-IS. Please be advised: the property is currently subject to ongoing foreclosure proceedings, making this a time-sensitive opportunity. This listing is a novation of contract from a third party with the seller's full consent. All inspections are for informational purposes only; no utilities will be turned on. Cash only. Bring your vision
Key facts
- Spacious lot
- Large flat yard
- Historic home
Tags
Property features AI
Exterior
- Parking: No garage
- Utilities: Public water connected; Sewer connected
- Home design: Two-story existing residence
- Construction: Stone foundation with pillar/post/pier supports; Construction details referenced in remarks
- Exterior features: Dirt driveway; Rectangular lot measuring approximately 144 x 147
Interior
- Kitchen: Water heater (listed under appliances); Additional kitchen details noted in remarks
- Bedrooms: One bedroom on the main level
- Flooring: Hardwood; Varies by room
- Bathrooms: One full bathroom
- Heating & cooling: Heating described in remarks
- Interior features: Hardwood and varied flooring; Bedroom on main level; Walk-out basement access; Additional interior features noted in remarks
- Laundry & utility: Washer/dryer not specified (see remarks)
Neighborhood map
What this means for you Summary
Snapshot
- This is a 3-bed/1.0-bath single-family listed at $40k.
Deal economics
- At list price, monthly cash flow is $735 ($9k/yr) — positive.
- The deal already cash-flows at list — no discount required.
- Meets the 1% rule at list price ($1k rent vs $40k).
- Recommended offer: $39k (3.0% below list) — sets the bar for market timing.
- Cap rate 30.0% vs local median 6.5% in Southport — top-decile yield for the area; either an underpriced asset or a hidden risk that comps aren't pricing in. Stress-test before assuming the spread holds.
Location & tenants
- Location reads 65/100 on livability (#690 in NY) — a middle-class / working-renter tenant base. Strengths: cost of living A+, housing A; Watch: schools D+, employment D, health & safety D.
- Elmira City School District (urban): math 23% / reading 35% proficiency, ranked #580 of 590 in NY (top 98%) — low school quality limits family demand, transient renter base, plan for 1-2y turnover.
- Market conditions: 25 active listings in the ZIP; 1 comparable units currently listed for rent nearby; 91 units permitted in Chemung County in 2024 (63 in 5+ unit buildings).
Forward outlook
- In year one you build about $4k of equity ($277 loan paydown + $4k appreciation (10.0% local appreciation)).
- Chemung County population projected at -17% by 2050 — secular population decline; favor cash flow + early exit over multi-decade hold.
- At projected returns (10.0% appreciation + 3.0% rent growth), your $11k cash investment doubles in ~1 year — after that, you're playing with house money.
- By year 7, paydown + projected appreciation supports a ~$31k cash-out refi (75% LTV) — recoverable capital for the next deal without selling this one.
Negotiation context
- It's been on market 41 days — a 3% lower offer ($39k) is reasonable based on typical stale-listing flexibility.
Risks & watch-outs
- Watch-outs: flood insurance adds $56/mo; built in 1826 — expect roof / HVAC / electrical / plumbing capex.
- Climate carrying-cost: severe flood risk — expect insurance premiums to compound above CPI over the hold.
Questions for the listing agent
- It's been on market 41 days. Have you received any prior offers? Is the seller open to a 3% concession, seller financing, or rate buy-down credit?
- Built in 1826 — when were the roof, HVAC, electrical panel, plumbing, and water heater last replaced?
- What's the actual annual flood-insurance premium (NFIP or private), and is the property in a SFHA with mandatory coverage?
- Is there a deadline driving the sale (1031 exchange, divorce, estate, relocation)? That informs how much negotiation room exists.
- Schools are D-rated, which usually means shorter tenancies and higher turnover. Who's the typical renter profile here, and what's been the actual vacancy rate?
- Crime grade is D in this area — have there been break-ins, vandalism, or insurance claims at this property in the last 3 years? What carrier currently insures it and at what premium?
- What's the average days-on-market for RENTAL listings here right now (not sales)? A rising rental-DOM trend means longer vacancies and softer asking-rent achievability than the comps imply.
- What's the recent tenant-quality profile in this submarket — average credit score on applications, eviction rate, late-payment / NSF rate, and stable-employment percentage? A property-management company in the area should have these aggregated.
- How much new for-sale + rental construction is in the pipeline within 1–3 miles? Heavy new supply typically softens prices + rents 12–24 months out; constrained supply supports both.
Investment metrics
- 1% rule
- 3.38% ✓
- Cap rate
- 30.00%
- Cash-on-cash
- 84.65%
- DSCR
- 4.77
- GRM
- 2.5
CMA / ARV
- ARV (median comp)
- $241,689
- List price
- $40,000
- Delta
- -83.45%
- Verdict
- UNDERPRICED
- Comps
- 20 within 1.0 mi
Show comp detail 4 sales within ~0.75 mi
| Address | Dist | Beds/Ba | Sqft | Sold | Price | $/sf | Match |
|---|---|---|---|---|---|---|---|
| 1257 Pennsylvania Ave | 0.29mi | 3/1.0 | 1,980 (+6%) | 8mo | $220,000 | $111 | 70 |
| 1003 Sycamore Cir | 0.64mi | 3/1.0 | 1,740 (-7%) | 2mo | $180,900 | $104 | 57 |
| 34 Crestview Dr W | 0.42mi | 4/1.5 (+1) | 1,640 (-12%) | 8mo | $160,000 | $98 | 46 |
| 1113 Country Ln | 0.59mi | 3/2.0 | 1,774 (-5%) | 23mo | $231,000 | $130 | 40 |
Match score weights: distance 35% · size 25% · config 20% · recency 20%. Top-matched comps best support the ARV.
Projected returns pro-forma
10.0% appreciation · 3.0% rent growth · sell at horizon
- IRR
- 88.8%
- Equity multiple
- 7.13×
- Total profit
- $68,622
- Equity at exit
- $36,035
- IRR
- 83.5%
- Equity multiple
- 15.77×
- Total profit
- $165,399
- Equity at exit
- $77,711
Cash invested: $11,200 (down + closing). Projections, not guarantees.
Landlord ↔ Tenant lean methodology
- Overall (STATE)
- 15 Strongly Tenant-Friendly
- State New York
- 15 Strongly Tenant-Friendly · D+10
- County
- — inherits STATE
- City
- — inherits STATE
ZIP-level market 14871
- Home prices YoY
- 9.9%
- Active inventory
- 25
- Price-to-rent
- 2.5×
Monthly cashflow live
- Estimated rent
- $1,350 medium interval (Pro) →
- Mortgage (P&I)
- −$210
- Tax est. 1.5%
- −$50 /mo · $600/yr
- Insurance
- −$17
- Flood insurance flood zone
- −$56 /mo · $666/yr
- HOA
- −$0
- Vacancy / Maint / Mgmt
- −$284
- Net cashflow
- $735
Break-even live
Sensitivity live
| Price | -10% $762 | -5% $748 | +0% $735 | +5% $721 | +10% $707 |
|---|---|---|---|---|---|
| Rent | -10% $628 | -5% $681 | +0% $735 | +5% $788 | +10% $841 |
| Rate | -1.0pp $755 | -0.5pp $745 | base $735 | +0.5pp $724 | +1.0pp $714 |
UW: 25.0% down · 7.5% · 30yr · 1.5% tax · 5.0% vac · 8.0% maint · 8.0% mgmt
Financing live
Cash to close
- Down payment
- $10,000
- Closing costs
- $1,200
- Reserves months
- —
- Total cash needed
- —
Loan-product check · same deal, 3 products live
Conventional
25% down · 7.5% · 30yr
- Down + closing
- —
- Monthly P&I
- —
- Monthly cashflow
- —
- DSCR
- —
- Eligible?
- —
Personal DTI + credit; lowest rate.
DSCR
20% down · 8.5% · 30yr
- Down + closing
- —
- Monthly P&I
- —
- Monthly cashflow
- —
- DSCR
- —
- Eligible?
- —
No personal income docs; deal must DSCR.
Hard money
10% down · 12.0% · 12mo
- Down + closing
- —
- Monthly P&I
- —
- Monthly cashflow
- —
- DSCR
- —
- Eligible?
- —
Short-term bridge; refi at stabilization.
Rent comps 1 comps
| Address | Beds | Baths | Sqft | Rent | $/sqft | DOM | Units | Dist |
|---|---|---|---|---|---|---|---|---|
| 550 Spruce St Unit 303 Elmira, NY | 2.0 | 2.0 | 1350 | $1,350 | $1.00 | 44d | 1 | 1.15mi |
Listing history 18 events
-
2026-06-21days on market $40,000 Active 41 DOM
-
2026-06-19days on market $40,000 Active 39 DOM
-
2026-06-18days on market $40,000 Active 38 DOM
-
2026-06-17days on market $40,000 Active 37 DOM
-
2026-06-16days on market $40,000 Active 36 DOM
-
2026-06-15days on market $40,000 Active 35 DOM
-
2026-06-14days on market $40,000 Active 33 DOM
-
2026-06-12days on market $40,000 Active 32 DOM
-
2026-06-09days on market $40,000 Active 29 DOM
-
2026-06-08days on market $40,000 Active 28 DOM
-
2026-06-07days on market $40,000 Active 27 DOM
-
2026-06-05days on market $40,000 Active 24 DOM
-
2026-06-03days on market $40,000 Active 23 DOM
-
2026-06-02days on market $40,000 Active 22 DOM
-
2026-06-01days on market $40,000 Active 21 DOM
-
2026-05-31days on market $40,000 Active 20 DOM
-
2026-05-30days on market $40,000 Active 19 DOM
-
2026-05-11$40,000 Active 730-char remark
ⓘ Source: listings_history table (triggers on properties + properties_extension) + one-shot
backfill from property_details.listing_events for pre-trigger history.
Climate risk First Street
- Flood 8/10 Severe FEMA zone X (shaded) · 99% chance over 30 yrs
- Wildfire 2/10 Low
- Heat 3/10 Moderate 7 d/yr ≥94°F today · 17 d/yr by 30 yrs out
- Wind 2/10 Low 100% chance of damaging wind over 30 yrs
- Air quality 1/10 Low 0 unhealthy d/yr today · 0 by 30 yrs out
Nearby sold comps map
Loading sold comps map…
Walkable amenities ~0.75 mi
Loading nearby amenities…
Taxation est. · year 1
- Rental income
- $16,200
- − Mortgage interest
- −$2,241
- − Property taxes
- −$600
- − Insurance
- −$866
- − Repairs & maintenance
- −$1,296
- − Management
- −$1,296
- − Depreciation
- −$1,164
- Taxable income
- $8,737
- Est. tax owed @ 24.0%
- −$2,097
- After-tax cash flow
- $6,717/yr
For passive investors: Depreciation is non-cash, so a rental often shows a tax loss while cash-flowing — sheltering income. Rental losses are passive: they offset passive income freely, and up to $25,000/yr can offset ordinary (W-2) income if you actively participate and your MAGI is under $100k (phasing out to $0 by $150k); unused losses carry forward. On sale, claimed depreciation is recaptured at up to 25%, and gains may owe capital-gains tax (a 1031 exchange can defer both). Figures are a year-1 estimate at your 24.0% rate — not tax advice; consult a CPA.
Schools (NCES district)
- District
- Elmira City School District
- NCES district ID
- 3610560
- Math proficiency
- 23% ▼ -7.00%
- Reading proficiency
- 35% ▲ 7.00%
- Median HH income
- $40,180
- Composite
- 24.39/100
- National rank
- #7688
- State rank
- #580 of 590 in NY
Livability — Southport
- Score
- 65/100
- State rank
- #690
- US rank
- #13026
Category grades
Schools grade is shown separately in the Schools card above.
Census & demographics
- Census place
- Southport, NY
- Population (ZIP)
- 4,497
Population outlook (Chemung County) Hauer SSP2
- Today (2025)
- 82,931 people
- By 2030
- 80,356 · -3.1%
- By 2040
- 74,745 · -9.9%
- By 2050
- 69,012 · -16.8%
- By 2075
- 55,689 · -32.8%
- By 2100
- 41,428 · -50.0%
Race, ethnicity, and origin ACS 2023
- Neighborhood character
- Predominantly White (98%)
- Race & ethnicity
- White 98% Two or more races 2%
- Common ancestry
- Romanian 7% Italian 2% Iranian 2%
- Foreign-born
- 1% · Canada
Political lean MEDSL · Chemung
- 2024 margin
- R (+16.8) · D 41.6% · R 58.4%
- 2008→2024 swing
- -15.6pp toward R · 2008: -1.2pp · 2024: -16.8pp
- All cycles
- 2024: R+16.8 2020: R+13.4 2016: R+20.0 2012: R+2.9 2008: R+1.2
Not yet ingested
- Civics
- —
Market trends
- HPI YoY
- ▲ 23.69%
- Current HPI
- 262.1655
- Rent YoY
- —
- Metro
- —
- State GDP YoY
- ▲ 2.60%
- F500 in state
- 92
Industry mix (Fortune 500 HQ in NY)
| Industry | F500 HQs | Revenue |
|---|---|---|
| Financial Services | 10 | $950B |
|
||
| Consumer Goods | 9 | $162B |
|
||
| Insurance | 4 | $225B |
|
||
| Telecommunications | 2 | $144B |
|
||
| Pharmaceuticals | 2 | $112B |
|
||
| Media / Entertainment | 2 | $69B |
|
||
Price history
1 event — show timeline
- 2026-05-11 Listed $40,000 UNYREIS
Property tax history
+12.6%/yrLatest (2025): $2,354 · -1.5% YoY. Source: county tax records.
Cash-flow waterfall
monthlySold comps — $/sqft
last 12 mo · ≤1 miLoading sold comps…