 Triplex
2051 Lake Shr · Los Angeles, CA
Flood risk 1/10 · Minimal
- FEMA flood zone
- X (unshaded)
- Chance of flooding over 30 yrs
- 0.0%
- Est. flood insurance / yr
- $507 – $1,088
Fire risk 1/10 · Minimal
- Est. fire insurance / yr
- $659 – $1,223
Heat risk 5/10 · Moderate
- Hot days now (above 94°F)
- 6 days/yr
- Hot days in 30 yrs
- 19 days/yr
Wind risk 1/10 · Minimal
- Chance of severe wind over 30 yrs
- —
Air-quality risk 5/10 · Moderate
- Unhealthy air days now
- 8 days/yr
- Unhealthy air days in 30 yrs
- 8 days/yr
Risk factors via First Street. Map © Google.
Why this score? — see what drove the C grade
The composite is a weighted blend of 9 inputs, each scored 0–100. Each bar is that input's sub-score; the figure is the points it added to the 100-point composite (weight × sub-score).
- Cash flow +24.4/30.0
- DSCR +7.9/10.0
- ARV discount +7.5/15.0
- 1% rule +5.1/10.0
- Schools +3.6/10.0
- Livability +3.4/5.0
- Rent growth +2.8/5.0
- Condition / age +2.5/5.0
- Appreciation +0.0/10.0
$1,150,000
🖨 Deal sheet 📄 Offer letter ✓ Due diligence
Multi-family units
County records classify this as Multi-Family (2-4 Unit). Listing-text estimate: 3 units. confirmed
Listing remarks
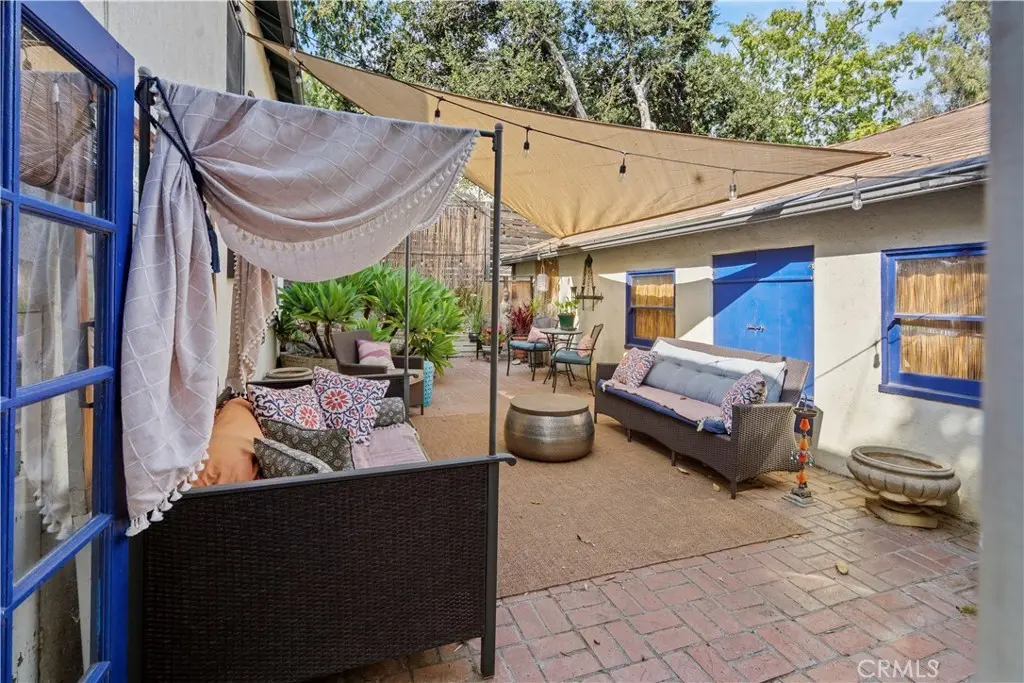
Tucked into the lush, storied hillsides of North Elysian Heights, this one-of-a-kind 1940s triplex is so much more than an investment property — it's an entire world unto itself. Three separate addresses (2051, 2053 & 2053½) sit nestled among mature trees, cascading bougainvillea, and layered gardens that give the compound the feel of a private botanical sanctuary in the middle of Los Angeles. A Property That Tells a Story From the moment you step through the gated entry off Lake Shore Ave, the character is undeniable. A beautifully planted walkway lined with agave, tropical foliage, potted succulents, and white river rock leads you past the front building — a clas
Key facts
- Gated entry
- 6,471 sq ft lot
- 3 garage spots
Tags
Property features AI
Finance
- Financial info: Gross scheduled income: $76,008; Gross income: $76,008; Net operating income: $52,879; Total operating expenses: $23,129; Expense examples: Insurance $3,625; Water/Sewer $1,500; Trash $15,075; Maintenance $356; New taxes $14,375; Units currently leased: 3; Unit rents shown: $1,614; $1,920; $2,800
- HOA & community: Property is subject to rent control
Exterior
- Parking: Three garage spaces (garage front entry); Assigned parking; Three uncovered parking spaces; Total of six parking spaces
- Utilities: Public sewer; District/public water; Three separate electric meters; Three separate gas meters; One separate water meter
- Home design: Single-story building; No common walls between units
- Construction: Year built per assessor; Three separate buildings on the parcel
- Exterior features: No pool; Street lighting; Sidewalks; Foothills neighborhood setting; Lot characterized as 2–5 units per acre
Interior
- Kitchen: Kitchens included in each unit
- Bedrooms: Three separate 1-bedroom units (each unit listed as 1 bedroom)
- Bathrooms: Each unit has 1 full bathroom
- Interior features: Ground-level entry
- Laundry & utility: Washer hookup; Gas dryer hookup; Shared or on-site laundry available (Has Laundry)
Neighborhood map
What this means for you Summary
Snapshot
- This is a 3 × 3-bed/3.0-bath units multifamily listed at $1.15M.
Deal economics
- At list price, monthly cash flow is $2k ($28k/yr) — positive. Per door: $779/mo.
- The deal already cash-flows at list — no discount required.
- Meets the 1% rule at list price ($12k rent vs $1.15M).
- Cap rate 8.7% vs local median 2.1% in Los Angeles — top-decile yield for the area; either an underpriced asset or a hidden risk that comps aren't pricing in. Stress-test before assuming the spread holds.
Location & tenants
- Location reads 68/100 on livability (#273 in CA) — a middle-class / working-renter tenant base. Strengths: amenities A+, commute A+, employment B; Watch: health & safety C-, schools D+, crime F.
- Los Angeles Unified (urban): math 29% / reading 54% proficiency, ranked #223 of 517 in CA (top 43%) — families likely to look elsewhere, expect single-tenant / working-renter base with shorter leases; 67% free/reduced lunch — lower-income household profile, screen leases tightly.
- Market conditions: Rents rising (+1.0%/yr); 102 active listings in the ZIP; 40 comparable units currently listed for rent nearby; rentals at typical pace (median 15d on market — plan ~3-4 weeks tenant-placement turnaround); high-income renter base; 19,697 units permitted in Los Angeles County in 2024 (9,426 in 5+ unit buildings).
- At $11,664/mo this rent would consume 123% of the median local household income ($114k/yr) (locally 1726% of renters already pay >50% of income on rent) — very limited rent-growth headroom before tenants either downsize or default.
Forward outlook
- Local home prices are declining (-3.0%/yr); year-one equity from $8k of loan paydown is wiped out by about $34k of value loss. Plan a longer hold.
- Los Angeles County population projected at +9% by 2050 — modest demand growth; plan on rents tracking national, not racing it.
Negotiation context
- Only 10 days on market — expect competitive offers; lowballing is unlikely to land.
Risks & watch-outs
- Watch-outs: built in 1940 — expect roof / HVAC / electrical / plumbing capex.
- Climate carrying-cost: extreme-heat days projected 6→19/yr by 2055 (HVAC capex compounding) — expect insurance premiums to compound above CPI over the hold.
Questions for the listing agent
- Can we see the unit-by-unit rent roll, current vacancy, and any below-market leases? What's the average tenancy length?
- What capital expenditures (roof, boiler, parking lot, exteriors) have been made in the last 5 years, and what's planned in the next 2?
- Built in 1940 — when were the roof, HVAC, electrical panel, plumbing, and water heater last replaced?
- Is there a deadline driving the sale (1031 exchange, divorce, estate, relocation)? That informs how much negotiation room exists.
- Schools are D-rated, which usually means shorter tenancies and higher turnover. Who's the typical renter profile here, and what's been the actual vacancy rate?
- Crime grade is F in this area — have there been break-ins, vandalism, or insurance claims at this property in the last 3 years? What carrier currently insures it and at what premium?
- What's the average days-on-market for RENTAL listings here right now (not sales)? A rising rental-DOM trend means longer vacancies and softer asking-rent achievability than the comps imply.
- What's the recent tenant-quality profile in this submarket — average credit score on applications, eviction rate, late-payment / NSF rate, and stable-employment percentage? A property-management company in the area should have these aggregated.
- How much new apartment / multifamily construction is in the pipeline within 1–3 miles? Heavy new supply (>2% of stock underway) typically softens rents 12–24 months out; light construction supports rent growth.
Investment metrics
- 1% rule
- 1.01% ✓
- Cap rate
- 8.73%
- Cash-on-cash
- 8.71%
- DSCR
- 1.39
- GRM
- 8.2
CMA / ARV
No comps found within radius.
Projected returns pro-forma
-3.0% appreciation · 1.02% rent growth · sell at horizon
- IRR
- -5.2%
- Equity multiple
- 0.81×
- Total profit
- $-60,689
- Equity at exit
- $171,469
- IRR
- 2.2%
- Equity multiple
- 1.15×
- Total profit
- $47,101
- Equity at exit
- $99,431
Cash invested: $322,000 (down + closing). Projections, not guarantees.
Landlord ↔ Tenant lean methodology
- Overall (CITY)
- 0 Strongly Tenant-Friendly
- State California
- 18 Strongly Tenant-Friendly · D+13
- County
- — inherits STATE
- City Los Angeles
- 0 Strongly Tenant-Friendly · D+22
ZIP-level market 90039
- Rents YoY
- 1.0%
- Active inventory
- 102
- Price-to-rent
- 24.6×
Monthly cashflow live
- Estimated rent
- $11,664 high interval (Pro) →
- Mortgage (P&I)
- −$6,031
- Tax from tax record
- −$366 /mo · $4,396/yr
- Insurance
- −$479
- HOA
- −$0
- Vacancy / Maint / Mgmt
- −$2,449
- Net cashflow
- $2,338
Break-even live
3-unit breakdown (identical units grouped — click to expand)
| Units | Beds | Baths | Est. rent |
|---|---|---|---|
| 3× units | 3 | 3 | $11,664 |
| #1 | 3 | 3 | $3,888 |
| #2 | 3 | 3 | $3,888 |
| #3 | 3 | 3 | $3,888 |
| Total (3 units) | $11,664 | ||
UW: 25.0% down · 7.5% · 30yr · 1.5% tax · 5.0% vac · 8.0% maint · 8.0% mgmt
Financing live
Cash to close
- Down payment
- $287,500
- Closing costs
- $34,500
- Reserves months
- —
- Total cash needed
- —
Loan-product check · same deal, 3 products live
Conventional
25% down · 7.5% · 30yr
- Down + closing
- —
- Monthly P&I
- —
- Monthly cashflow
- —
- DSCR
- —
- Eligible?
- —
Personal DTI + credit; lowest rate.
DSCR
20% down · 8.5% · 30yr
- Down + closing
- —
- Monthly P&I
- —
- Monthly cashflow
- —
- DSCR
- —
- Eligible?
- —
No personal income docs; deal must DSCR.
Hard money
10% down · 12.0% · 12mo
- Down + closing
- —
- Monthly P&I
- —
- Monthly cashflow
- —
- DSCR
- —
- Eligible?
- —
Short-term bridge; refi at stabilization.
Rent comps 40 comps
| Address | Beds | Baths | Sqft | Rent | $/sqft | DOM | Units | Dist |
|---|---|---|---|---|---|---|---|---|
| 2049 Lake Shore Ave Los Angeles, CA | 1.0 | 1.0 | 580 | $3,400 | $5.86 | 10d | 1 | 0.03mi |
| 2147 Baxter St Los Angeles, CA | 1.0 | 1.0 | 700 | $2,150 | $3.07 | 4d | 1 | 0.17mi |
| 2147 Baxter St Unit 9 Los Angeles, CA | 1.0 | 1.0 | 700 | $2,150 | $3.07 | 12d | 1 | 0.17mi |
| 2202 Fair Oak View Ter Unit 2204 Los Angeles, CA | 2.0 | 1.0 | 718 | $3,400 | $4.74 | 24d | 1 | 0.25mi |
| 2257 Ewing St Los Angeles, CA | 2.0 | 1.0 | 670 | $2,250 | $3.36 | 43d | 1 | 0.37mi |
| 2127 Glendale Blvd Los Angeles, CA | — | 1.0 | 430 | $2,200 | $5.12 | 43d | 1 | 0.38mi |
| 2127 Glendale Blvd Los Angeles, CA | — | 1.0 | 430 | $2,075 | $4.83 | 7d | 1 | 0.38mi |
| 2275 Ewing St Los Angeles, CA | 1.0 | 1.0 | 600 | $2,895 | $4.83 | 5d | 1 | 0.40mi |
| 1750 Glendale Blvd Los Angeles, CA | 2.0 | 1.0–2.0 | 792 | $2,995 | $3.78 | 3d | 1 | 0.41mi |
| 2276 Ewing St Los Angeles, CA | 1.0 | 1.0 | 600 | $3,200 | $5.33 | 18d | 1 | 0.42mi |
| 1801 Morton Ave Los Angeles, CA | 1.0–2.0 | 1.0 | 692 | $2,650 | $3.83 | 1d | 4 | 0.56mi |
| 1650 Echo Park Ave Los Angeles, CA | — | 1.0 | 450 | $2,050 | $4.56 | 7d | 1 | 0.57mi |
| 2339 Glendale Blvd Unit 6 Los Angeles, CA | 2.0 | 1.0 | 740 | $2,500 | $3.38 | 43d | 1 | 0.61mi |
| 2564 Corralitas Dr Los Angeles, CA | 1.0 | 1.0 | 624 | $2,350 | $3.77 | 14d | 1 | 0.65mi |
| 2566 1/8 Corralitas Dr Los Angeles, CA | 1.0 | 1.0 | 520 | $2,299 | $4.42 | 10d | 1 | 0.66mi |
| 1551 Echo Park Ave Los Angeles, CA | 1.0 | 1.0 | 580 | $2,656 | $4.58 | 15d | 3 | 0.67mi |
| 2643 Pirtle St Unit 2645 2 Los Angeles, CA | 1.0 | 1.0 | 480 | $2,195 | $4.57 | 43d | 1 | 0.69mi |
| 1828 Silver Lake Blvd Los Angeles, CA | 1.0 | 1.0 | 700 | $3,600 | $5.14 | 43d | 1 | 0.70mi |
| 1605 Grafton St Los Angeles, CA | — | 1.0 | 422 | $2,510 | $5.94 | 20d | 5 | 0.70mi |
| 1816 Silver Lake Blvd Los Angeles, CA | 1.0 | 1.0 | 600 | $2,895 | $4.83 | 43d | 1 | 0.71mi |
| 2441 Silver Lake Blvd Los Angeles, CA | 1.0 | 1.0 | 740 | $2,475 | $3.34 | 24d | 1 | 0.75mi |
| 1443 N Alvarado St Los Angeles, CA | — | 1.0 | 550 | $1,795 | $3.26 | 13d | 1 | 0.76mi |
| 1443 N Alvarado St Los Angeles, CA | — | 1.0 | 550 | $1,775 | $3.23 | 43d | 1 | 0.76mi |
| 1858 Westerly Ter Unit 1849 Los Angeles, CA | — | 1.0 | 531 | $2,500 | $4.71 | 2d | 1 | 0.78mi |
| 1445 Echo Park Ave Unit 1447 Los Angeles, CA | 1.0 | 1.0 | 650 | $2,400 | $3.69 | 5d | 1 | 0.83mi |
| 1330 Liberty St Apt 2 Los Angeles, CA | 1.0 | 1.0 | 700 | $1,791 | $2.56 | 20d | 1 | 0.89mi |
| 1330 Liberty St Unit 4 Los Angeles, CA | 1.0 | 1.0 | 700 | $1,995 | $2.85 | 5d | 1 | 0.89mi |
| 1416 1/2 Echo Park Ave Los Angeles, CA | 1.0 | 1.0 | 700 | $2,395 | $3.42 | 43d | 1 | 0.89mi |
| 1317 Allesandro St Unit 10 Los Angeles, CA | — | 1.0 | 450 | $1,920 | $4.27 | 13d | 1 | 0.93mi |
| 1317 Allesandro St Unit 11 Los Angeles, CA | 1.0 | 1.0 | 650 | $2,287 | $3.52 | 13d | 1 | 0.93mi |
| 1511 1/2 Silver Lake Blvd Los Angeles, CA | 2.0 | 2.0 | 682 | $3,595 | $5.27 | 7d | 1 | 0.98mi |
| 1501 Sunset Blvd Unit R2 Los Angeles, CA | — | 1.0 | 421 | $2,026 | $4.81 | 13d | 1 | 1.02mi |
| 2002 Sunset Blvd Unit 301 Los Angeles, CA | 1.0 | 1.0 | 400 | $1,800 | $4.50 | 20d | 1 | 1.04mi |
| 2002 W Sunset Blvd Los Angeles, CA | 1.0 | 1.0 | 372 | $1,800 | $4.84 | 16d | 2 | 1.04mi |
| 1915 Park Ave Los Angeles, CA | 2.0 | 1.0–2.0 | 743 | $3,888 | $5.23 | 5d | 9 | 1.05mi |
| 2022 W Sunset Blvd Los Angeles, CA | 1.0 | 1.0 | 700 | $2,400 | $3.43 | 16d | 1 | 1.06mi |
| 1039 N Bonnie Brae St Unit 30 Los Angeles, CA | 1.0 | 1.0 | 350 | $1,850 | $5.29 | 43d | 1 | 1.07mi |
| 1039 N Bonnie Brae St Los Angeles, CA | 1.0 | 1.0 | 262 | $1,850 | $7.05 | 2d | 3 | 1.07mi |
| 1461 Sunset Blvd Unit 306 Los Angeles, CA | — | 1.0 | 400 | $2,050 | $5.12 | 24d | 1 | 1.07mi |
| 1042 N Bonnie Brae St Los Angeles, CA | 1.0 | 1.0 | 500 | $2,350 | $4.70 | 43d | 1 | 1.07mi |
Listing history 7 events
-
2026-06-18days on market $1,150,000 Active 10 DOM
-
2026-06-17days on market $1,150,000 Active 9 DOM
-
2026-06-16days on market $1,150,000 Active 8 DOM
-
2026-06-15days on market $1,150,000 Active 7 DOM
-
2026-06-13days on market $1,150,000 Active 5 DOM
-
2026-06-09remarks 676-char remark
-
2026-06-09$1,150,000 Active 1 DOM
ⓘ Source: listings_history table (triggers on properties + properties_extension) + one-shot
backfill from property_details.listing_events for pre-trigger history.
Tax reassessment forecast CA · Resets to sale price
- Current annual tax
- $4,396 · $366/mo
- Projected year-2 tax
- $8,740 · $728/mo
- Expected delta
- +$4,344/yr (+$362/mo · 98.8%)
ⓘ Screening estimate from a state-policy table — verify with the county assessor before closing.
Climate risk First Street
- Flood 1/10 Low FEMA zone X (unshaded) · 0% chance over 30 yrs
- Wildfire 1/10 Low
- Heat 5/10 Major 6 d/yr ≥94°F today · 19 d/yr by 30 yrs out
- Wind 1/10 Low
- Air quality 5/10 Major 8 unhealthy d/yr today · 8 by 30 yrs out
Nearby sold comps map
Loading sold comps map…
Walkable amenities ~0.75 mi
Loading nearby amenities…
Taxation est. · year 1
- Rental income
- $139,968
- − Mortgage interest
- −$64,418
- − Property taxes
- −$4,396
- − Insurance
- −$5,750
- − Repairs & maintenance
- −$11,197
- − Management
- −$11,197
- − Depreciation
- −$33,455
- Taxable income
- $9,555
- Est. tax owed @ 24.0%
- −$2,293
- After-tax cash flow
- $25,767/yr
For passive investors: Depreciation is non-cash, so a rental often shows a tax loss while cash-flowing — sheltering income. Rental losses are passive: they offset passive income freely, and up to $25,000/yr can offset ordinary (W-2) income if you actively participate and your MAGI is under $100k (phasing out to $0 by $150k); unused losses carry forward. On sale, claimed depreciation is recaptured at up to 25%, and gains may owe capital-gains tax (a 1031 exchange can defer both). Figures are a year-1 estimate at your 24.0% rate — not tax advice; consult a CPA.
Schools (NCES district)
- District
- Los Angeles Unified
- NCES district ID
- 0622710
- Math proficiency
- 29% ▼ -4.00%
- Reading proficiency
- 54% ▲ 10.00%
- Median HH income
- $50,403
- Composite
- 35.67/100
- National rank
- #4875
- State rank
- #223 of 517 in CA
Livability — Los Angeles
- Score
- 68/100
- State rank
- #273
- US rank
- #9237
Category grades
Schools grade is shown separately in the Schools card above.
Census & demographics
- Census place
- Los Angeles, CA
- County
- Los Angeles County · 9,444,647 people
- City population
- 3,838,149
- Metro
- Los Angeles-Long Beach-Anaheim, CA
- Population (ZIP)
- 28,884
- Household income
- $113,818
- Rent vs Own
- Severe rent burden
- 1726.0
Population outlook (Los Angeles County) Hauer SSP2
- Today (2025)
- 10,940,515 people
- By 2030
- 11,256,481 · +2.9%
- By 2040
- 11,729,929 · +7.2%
- By 2050
- 11,948,407 · +9.2%
- By 2075
- 11,818,114 · +8.0%
- By 2100
- 10,842,928 · -0.9%
Race, ethnicity, and origin ACS 2023
- Neighborhood character
- Diverse neighborhood (Simpson 0.69)
- Race & ethnicity
- White 42% Hispanic / Latino 31% Asian 19% Two or more races 14% Black 2%
- Hispanic origin (detail)
- Mexican 17%
- Common ancestry
- Romanian 2% Italian 2% Scotch-Irish 2%
- Foreign-born
- 30% · Canada, China, South Korea
- Languages at home
- 59% English-only · Spanish 25% Tagalog/Filipino 8% Other Indo-European 2%
Political lean MEDSL · Los Angeles
- 2024 margin
- Solid D (+32.9) · D 64.8% · R 31.9% · Other 3.3%
- 2008→2024 swing
- -7.4pp toward R · 2008: 40.4pp · 2024: 32.9pp
- All cycles
- 2024: D+32.9 2020: D+44.2 2016: D+48.0 2012: D+40.0 2008: D+40.4
Not yet ingested
- Civics
- —
Market trends
- HPI YoY
- ▼ -987.09%
- Current HPI
- 469.7964
- Rent YoY
- ▲ 1.02%
- Metro
- Los Angeles-Long Beach-Anaheim, CA
- State GDP YoY
- ▲ 3.21%
- F500 in state
- 116
Industry mix (Fortune 500 HQ in CA)
| Industry | F500 HQs | Revenue |
|---|---|---|
| Technology | 27 | $1,492B |
|
||
| Financial Services | 3 | $174B |
|
||
| Retail | 3 | $44B |
|
||
| Insurance | 3 | $26B |
|
||
| Media / Entertainment | 2 | $115B |
|
||
| Pharmaceuticals / Biotech | 2 | $62B |
|
||
Price history
1 event — show timeline
- 2026-06-08 Listed $1,150,000 CRMLS
Property tax history
+10.7%/yrLatest (2025): $4,396 · +1.6% YoY. Source: county tax records.
Cash-flow waterfall
monthlySold comps — $/sqft
last 12 mo · ≤1 miLoading sold comps…