1657 Harper St · Rocky Mount, NC
Flood risk 1/10 · Minimal
- FEMA flood zone
- X (unshaded)
- Chance of flooding over 30 yrs
- 0.0%
- Est. flood insurance / yr
- $507 – $1,088
Fire risk 4/10 · Minor
- Est. fire insurance / yr
- $906 – $1,684
Heat risk 7/10 · Major
- Hot days now (above 109°F)
- 7 days/yr
- Hot days in 30 yrs
- 16 days/yr
Wind risk 6/10 · Moderate
- Chance of severe wind over 30 yrs
- 63.0%
Air-quality risk 2/10 · Minimal
- Unhealthy air days now
- 0 days/yr
- Unhealthy air days in 30 yrs
- 1 days/yr
Risk factors via First Street. Map © Google.
Why this score? — see what drove the D+ grade
The composite is a weighted blend of 9 inputs, each scored 0–100. Each bar is that input's sub-score; the figure is the points it added to the 100-point composite (weight × sub-score).
- Cash flow +23.8/30.0
- DSCR +7.7/10.0
- 1% rule +5.0/10.0
- Livability +3.5/5.0
- Rent growth +2.5/5.0
- Condition / age +2.5/5.0
- Schools +2.0/10.0
- ARV discount +0.0/15.0
- Appreciation +0.0/10.0
$140,000
🖨 Deal sheet (PDF) 📄 Offer letter ✓ Due diligence
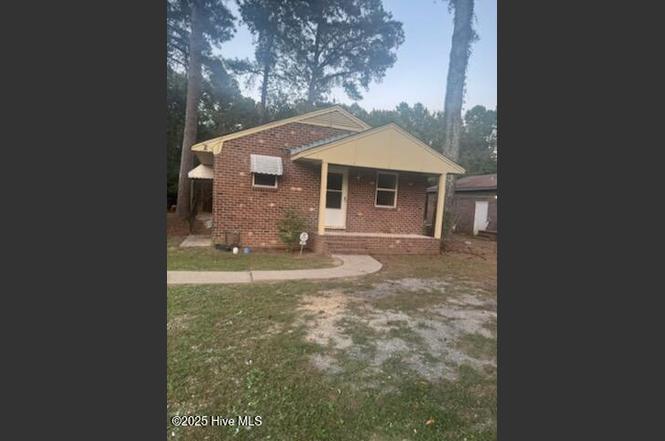
Listing remarks
Nice Brick home for a family, 3 Bedroom, 1 Bath. Living Room, Kitchen and dining room. Nice Yard. Owner giving 10,000 Heat & Air Allowance, some updates
Key facts
- Yard
- Kitchen
- Living room
Tags
Property features AI
Finance
- Other: Zoning: R6; Road frontage on city street and state road; Lot dimensions approximately 50 x 133 (0.15 acres)
Exterior
- Parking: On-street parking available; On-site parking available
- Utilities: Public water; Sewer connected; Water connected
- Home design: Single-family residence; One level; Residential property
- Construction: Concrete and brick construction; Brick/mortar foundation; Built with traditional construction materials
- Exterior features: No patio or porch; No fencing; Shingle roof
Interior
- Kitchen: Kitchen-located laundry (see Laundry & utility)
- Bedrooms: 5 total rooms
- Flooring: Wood floors
- Bathrooms: 1 full bathroom
- Heating & cooling: Has heating; Space heater; No central cooling
- Interior features: Ceiling fan(s)
- Laundry & utility: Laundry located in the kitchen
Neighborhood map
What this means for you Summary
Snapshot
- This is a 3-bed/1.0-bath single-family listed at $140k.
Deal economics
- At list price, monthly cash flow is $269 ($3k/yr) — positive.
- The deal already cash-flows at list — no discount required.
- Meets the 1% rule at list price ($1k rent vs $140k).
- Recommended offer: $123k (12.0% below list) — sets the bar for market timing.
- Cap rate 8.6% vs local median 4.5% in Rocky Mount — top-decile yield for the area; either an underpriced asset or a hidden risk that comps aren't pricing in. Stress-test before assuming the spread holds.
Location & tenants
- Location reads 70/100 on livability (#134 in NC) — a middle-class / working-renter tenant base. Strengths: cost of living A+, housing A+, health & safety A+; Watch: crime F, amenities F, employment F.
- Edgecombe County Public Schools (rural): math 21% / reading 27% proficiency, ranked #163 of 178 in NC (top 92%) — low school quality limits family demand, transient renter base, plan for 1-2y turnover; 74% free/reduced lunch — lower-income household profile, screen leases tightly.
- Zoned schools: G W Bulluck Elementary (math 19% / reading 27%, grade F, #1,168 of 1,410 statewide, top 83%, 609 students, 100% FRL); West Edgecombe Middle (math 22% / reading 30%, grade F, #385 of 475 statewide, top 81%, 314 students, 99% FRL); Southwest Edgecombe High (math 42% / reading 37%, grade F, #393 of 535 statewide, top 75%, 802 students, 100% FRL) — zoned schools average 99% FRL vs 74% district-wide (26 pts higher); higher-poverty schools than district average — tighter screening recommended.
- Market conditions: 134 active listings in the ZIP; lower-income renter base — watch delinquency; 50 units permitted in Edgecombe County in 2024 (5 in 5+ unit buildings).
- This rent runs 37% of the median local income ($45k/yr) — at the standard rent-burdened threshold; future hikes will face affordability resistance.
Forward outlook
- Local home prices are declining (-3.0%/yr); year-one equity from $968 of loan paydown is wiped out by about $4k of value loss. Plan a longer hold.
- Edgecombe County population projected at -34% by 2050 — secular population decline; favor cash flow + early exit over multi-decade hold.
Negotiation context
- It's been on market 297 days — a 12% lower offer ($123k) is reasonable based on typical stale-listing flexibility.
Risks & watch-outs
- Climate carrying-cost: major wind risk, 63% chance of damaging wind over 30y; extreme-heat days projected 7→16/yr by 2055 (HVAC capex compounding) — expect insurance premiums to compound above CPI over the hold.
Questions for the listing agent
- It's been on market 297 days. Have you received any prior offers? Is the seller open to a 12% concession, seller financing, or rate buy-down credit?
- Built in 1977 — when were the roof, HVAC, electrical panel, plumbing, and water heater last replaced?
- Why hasn't it sold? Are there any deal-killer items the seller is aware of (foundation, flood, title, zoning, code violations)?
- Is there a deadline driving the sale (1031 exchange, divorce, estate, relocation)? That informs how much negotiation room exists.
- Schools are F-rated, which usually means shorter tenancies and higher turnover. Who's the typical renter profile here, and what's been the actual vacancy rate?
- Crime grade is F in this area — have there been break-ins, vandalism, or insurance claims at this property in the last 3 years? What carrier currently insures it and at what premium?
- The area grade is low — what's the realistic commute time and amenity access for the typical tenant pool here? Any planned neighborhood developments (good or bad) we should know about?
- What's the average days-on-market for RENTAL listings here right now (not sales)? A rising rental-DOM trend means longer vacancies and softer asking-rent achievability than the comps imply.
- What's the recent tenant-quality profile in this submarket — average credit score on applications, eviction rate, late-payment / NSF rate, and stable-employment percentage? A property-management company in the area should have these aggregated.
- How much new for-sale + rental construction is in the pipeline within 1–3 miles? Heavy new supply typically softens prices + rents 12–24 months out; constrained supply supports both.
Investment metrics
- 1% rule
- 1.00% ✓
- Cap rate
- 8.60%
- Cash-on-cash
- 8.22%
- DSCR
- 1.37
- GRM
- 8.3
CMA / ARV
- ARV (on-the-fly)
- $93,450
- Comps found
- 11
Show comp detail 11 sales within ~0.75 mi
| Address | Dist | Beds/Ba | Sqft | Sold | Price | $/sf | Match |
|---|---|---|---|---|---|---|---|
| 1558 Harper St | 0.13mi | 3/1.0 | 1,080 (+3%) | 11mo | $95,000 | $88 | 79 |
| 129 Lucas Cir | 0.37mi | 3/1.5 | 1,050 (0%) | 14mo | $101,500 | $97 | 70 |
| 817 Corbett Dr | 0.67mi | 3/1.0 | 1,075 (+2%) | 2mo | $90,000 | $84 | 63 |
| 1624 Fountain St | 0.30mi | 2/1.0 (-1) | 1,040 (-1%) | 20mo | $75,000 | $72 | 63 |
| 1312 Beckman St | 0.41mi | 3/1.5 | 1,020 (-3%) | 23mo | $133,500 | $131 | 55 |
| 1604 Robert Ave | 0.49mi | 3/1.0 | 962 (-8%) | 12mo | $149,900 | $156 | 53 |
| 1548 Fountain St | 0.36mi | 2/1.5 (-1) | 936 (-11%) | 9mo | $33,792 | $36 | 51 |
| 1004 Leggett Rd | 0.61mi | 3/2.0 | 1,060 (+1%) | 18mo | $150,000 | $142 | 51 |
| 1709 Whitfield Ave | 0.46mi | 3/1.5 | 1,178 (+12%) | 11mo | $115,000 | $98 | 47 |
| 1548 Charter Dr | 0.45mi | 2/1.0 (-1) | 945 (-10%) | 24mo | $75,000 | $79 | 37 |
| 908 Shepard Dr | 0.69mi | 3/1.0 | 1,160 (+10%) | 20mo | $103,000 | $89 | 34 |
Match score weights: distance 35% · size 25% · config 20% · recency 20%. Top-matched comps best support the ARV.
Projected returns pro-forma
-3.0% appreciation · 3.0% rent growth · sell at horizon
- IRR
- -3.8%
- Equity multiple
- 0.86×
- Total profit
- $-5,633
- Equity at exit
- $20,874
- IRR
- 5.8%
- Equity multiple
- 1.43×
- Total profit
- $16,892
- Equity at exit
- $12,105
Cash invested: $39,200 (down + closing). Projections, not guarantees.
Landlord ↔ Tenant lean methodology
- Overall (STATE)
- 85 Strongly Landlord-Friendly
- State North Carolina
- 85 Strongly Landlord-Friendly · R+3
- County
- — inherits STATE
- City
- — inherits STATE
ZIP-level market 27801
- Home prices YoY
- -5.6%
- Active inventory
- 134
- Price-to-rent
- 8.3×
Monthly cashflow live
- Estimated rent
- $1,402 medium interval (Pro) →
- Mortgage (P&I)
- −$734
- Tax from tax record
- −$46 /mo · $552/yr
- Insurance
- −$58
- HOA
- −$0
- Vacancy / Maint / Mgmt
- −$294
- Net cashflow
- $269
Break-even live
Sensitivity live
| Price | -10% $348 | -5% $308 | +0% $269 | +5% $229 | +10% $189 |
|---|---|---|---|---|---|
| Rent | -10% $158 | -5% $213 | +0% $269 | +5% $324 | +10% $379 |
| Rate | -1.0pp $339 | -0.5pp $304 | base $269 | +0.5pp $232 | +1.0pp $195 |
UW: 25.0% down · 7.5% · 30yr · 1.5% tax · 5.0% vac · 8.0% maint · 8.0% mgmt
Financing live
Cash to close
- Down payment
- $35,000
- Closing costs
- $4,200
- Reserves months
- —
- Total cash needed
- —
Loan-product check · same deal, 3 products live
Conventional
25% down · 7.5% · 30yr
- Down + closing
- —
- Monthly P&I
- —
- Monthly cashflow
- —
- DSCR
- —
- Eligible?
- —
Personal DTI + credit; lowest rate.
DSCR
20% down · 8.5% · 30yr
- Down + closing
- —
- Monthly P&I
- —
- Monthly cashflow
- —
- DSCR
- —
- Eligible?
- —
No personal income docs; deal must DSCR.
Hard money
10% down · 12.0% · 12mo
- Down + closing
- —
- Monthly P&I
- —
- Monthly cashflow
- —
- DSCR
- —
- Eligible?
- —
Short-term bridge; refi at stabilization.
Listing history 18 events
-
2026-06-22days on market $140,000 Active 297 DOM
-
2026-06-19days on market $140,000 Active 295 DOM
-
2026-06-18days on market $140,000 Active 294 DOM
-
2026-06-17days on market $140,000 Active 293 DOM
-
2026-06-16days on market $140,000 Active 292 DOM
-
2026-06-15days on market $140,000 Active 291 DOM
-
2026-06-14days on market $140,000 Active 289 DOM
-
2026-06-13days on market $140,000 Active 288 DOM
-
2026-06-10days on market $140,000 Active 286 DOM
-
2026-06-09days on market $140,000 Active 285 DOM
-
2026-06-08days on market $140,000 Active 284 DOM
-
2026-06-07days on market $140,000 Active 283 DOM
-
2026-06-05days on market $140,000 Active 280 DOM
-
2026-06-02days on market $140,000 Active 278 DOM
-
2026-06-01days on market $140,000 Active 277 DOM
-
2026-05-31days on market $140,000 Active 276 DOM
-
2026-05-30days on market $140,000 Active 275 DOM
-
2025-08-28$140,000 Active
ⓘ Source: listings_history table (triggers on properties + properties_extension) + one-shot
backfill from property_details.listing_events for pre-trigger history.
Tax reassessment forecast NC · Resets to sale price
- Current annual tax
- $552 · $46/mo
- Projected year-2 tax
- $1,148 · $96/mo
- Expected delta
- +$596/yr (+$50/mo · 107.9%)
ⓘ Screening estimate from a state-policy table — verify with the county assessor before closing.
Climate risk First Street
- Flood 1/10 Low FEMA zone X (unshaded) · 0% chance over 30 yrs
- Wildfire 4/10 Moderate
- Heat 7/10 Severe 7 d/yr ≥109°F today · 16 d/yr by 30 yrs out
- Wind 6/10 Major 63% chance of damaging wind over 30 yrs
- Air quality 2/10 Low 0 unhealthy d/yr today · 1 by 30 yrs out
Nearby sold comps map
Loading sold comps map…
Walkable amenities ~0.75 mi
Loading nearby amenities…
Taxation est. · year 1
- Rental income
- $16,818
- − Mortgage interest
- −$7,842
- − Property taxes
- −$552
- − Insurance
- −$700
- − Repairs & maintenance
- −$1,345
- − Management
- −$1,345
- − Depreciation
- −$4,073
- Taxable income
- $960
- Est. tax owed @ 24.0%
- −$230
- After-tax cash flow
- $2,994/yr
For passive investors: Depreciation is non-cash, so a rental often shows a tax loss while cash-flowing — sheltering income. Rental losses are passive: they offset passive income freely, and up to $25,000/yr can offset ordinary (W-2) income if you actively participate and your MAGI is under $100k (phasing out to $0 by $150k); unused losses carry forward. On sale, claimed depreciation is recaptured at up to 25%, and gains may owe capital-gains tax (a 1031 exchange can defer both). Figures are a year-1 estimate at your 24.0% rate — not tax advice; consult a CPA.
Schools (NCES district)
- District
- Edgecombe County Public Schools
- NCES district ID
- 3701320
- Math proficiency
- 21% ▼ -2.00%
- Reading proficiency
- 27% ▲ 2.00%
- Median HH income
- $35,711
- Composite
- 19.85/100
- National rank
- #8696
- State rank
- #163 of 178 in NC
Livability — Rocky Mount
- Score
- 70/100
- State rank
- #134
- US rank
- #7692
Category grades
Schools grade is shown separately in the Schools card above.
Census & demographics
- Census place
- Rocky Mount, NC
- County
- Edgecombe County · 37,913 people
- City population
- 70,300
- Metro
- Rocky Mount, NC
- Population (ZIP)
- 19,532
- Household income
- $44,884
- Rent vs Own
- Severe rent burden
- 900.0
Population outlook (Edgecombe County) Hauer SSP2
- Today (2025)
- 47,800 people
- By 2030
- 44,396 · -7.1%
- By 2040
- 37,562 · -21.4%
- By 2050
- 31,495 · -34.1%
- By 2075
- 20,943 · -56.2%
- By 2100
- 13,674 · -71.4%
Race, ethnicity, and origin ACS 2023
- Neighborhood character
- Predominantly Black (70%)
- Race & ethnicity
- Black 70% White 24% Two or more races 3% Hispanic / Latino 1%
- Common ancestry
- Romanian 1%
- Foreign-born
- 1% · Canada
- Languages at home
- 97% English-only · Spanish 2%
Political lean MEDSL · Edgecombe
- 2024 margin
- Strong D (+22.7) · D 61.0% · R 38.3%
- 2008→2024 swing
- -11.8pp toward R · 2008: 34.5pp · 2024: 22.7pp
- All cycles
- 2024: D+22.7 2020: D+27.0 2016: D+32.2 2012: D+36.4 2008: D+34.5
Not yet ingested
- Civics
- —
Market trends
- HPI YoY
- ▼ -17.65%
- Current HPI
- 296.3428
- Rent YoY
- —
- Metro
- Rocky Mount, NC
- State GDP YoY
- ▲ 3.28%
- F500 in state
- 26
Industry mix (Fortune 500 HQ in NC)
| Industry | F500 HQs | Revenue |
|---|---|---|
| Financial Services | 2 | $213B |
|
||
| Retail | 2 | $95B |
|
||
| Industrial Conglomerate | 1 | $38B |
|
||
| Metals / Steel | 1 | $35B |
|
||
| Utilities | 1 | $30B |
|
||
| Industrial Machinery | 1 | $19B |
|
||
Price history
1 event — show timeline
- 2025-08-28 Listed $140,000 Hive MLS
Property tax history
+2.1%/yrLatest (2025): $552 · +0.0% YoY. Source: county tax records.
Cash-flow waterfall
monthlySold comps — $/sqft
last 12 mo · ≤1 miLoading sold comps…