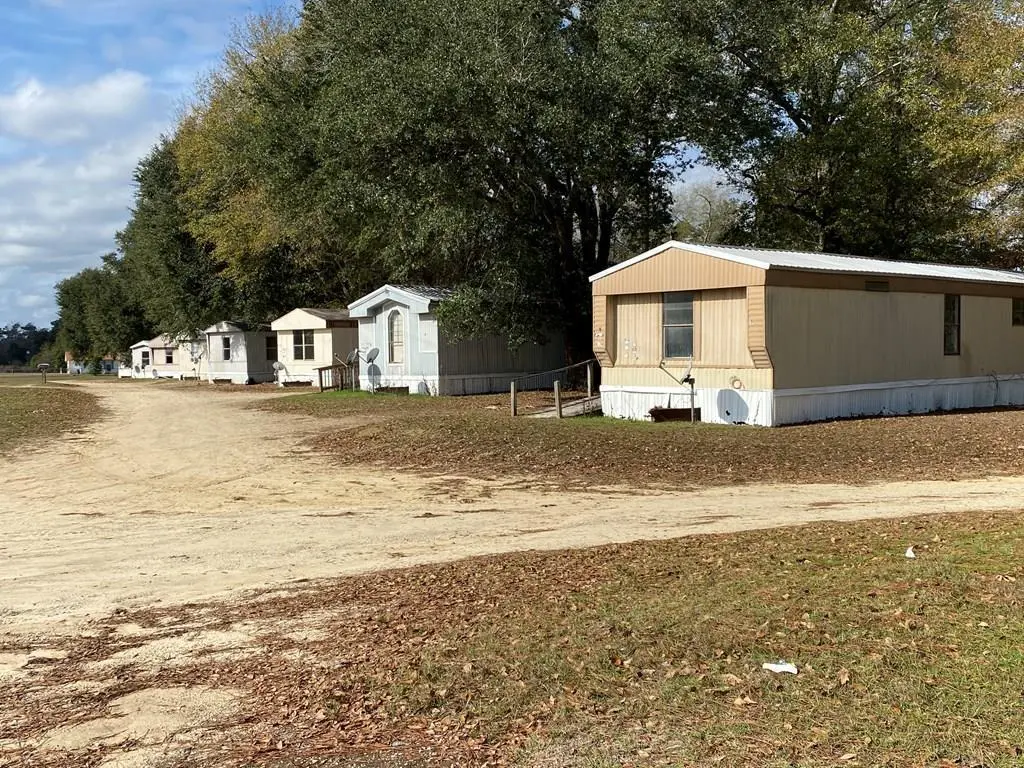
 27-Plex
228 E Grow St #28 · Colquitt, GA
Flood risk 4/10 · Minor
- FEMA flood zone
- A
- Chance of flooding over 30 yrs
- 0.22%
- Est. flood insurance / yr
- $1,009 – $1,996
Fire risk 3/10 · Minor
- Est. fire insurance / yr
- $963 – $1,789
Heat risk 8/10 · Major
- Hot days now (above 109°F)
- 7 days/yr
- Hot days in 30 yrs
- 20 days/yr
Wind risk 8/10 · Major
- Chance of severe wind over 30 yrs
- 99.0%
Air-quality risk 5/10 · Moderate
- Unhealthy air days now
- 7 days/yr
- Unhealthy air days in 30 yrs
- 8 days/yr
Risk factors via First Street. Map © Google.
Why this score? — see what drove the C- grade
The composite is a weighted blend of 9 inputs, each scored 0–100. Each bar is that input's sub-score; the figure is the points it added to the 100-point composite (weight × sub-score).
- Cash flow +15.0/30.0
- Appreciation +8.3/10.0
- ARV discount +7.5/15.0
- 1% rule +5.0/10.0
- DSCR +5.0/10.0
- Livability +3.4/5.0
- Rent growth +2.5/5.0
- Condition / age +2.5/5.0
- Schools +2.0/10.0
$499,900
🖨 Deal sheet 📄 Offer letter ✓ Due diligence
Multi-family units
County records classify this as Multi-Family (2-4 Unit). Listing-text estimate: 27 units. estimate disagrees with records
Listing remarks
VALUE ADD OPPORTUNITY!! $18,500/unit! - 27 unit mobile home park located in Colquitt, GA on county water and sewer. The park is currently 22.2% occupied, with only one additional vacant unit considered rent ready. This is not being presented as a stabilized asset, but rather as a repositioning opportunity with significant upside through renovations, lease up, and operational improvements. Several of the vacant units need varying levels of rehab including flooring, paint, appliances, and general deferred maintenance. The positive side is that the infrastructure is already in place, the park has scale with 27 total units(all park owned), and there is a clear path to increasing occupancy and r
Key facts
- 5.24 acre lot
- Listed 21 days
Property features AI
Exterior
- Home design: Residential income property (investment); Single-story
- Construction: Vinyl siding
- Exterior features: Approximately 5.24 acres; Zoned Commercial NEC
Interior
- Heating & cooling: Wall/window unit cooling
- Interior features: Wall/window air conditioning units
Neighborhood map
What this means for you Summary
Snapshot
- This is a 27 × 9-bed/6.0-bath units multifamily listed at $500k.
Deal economics
- At list price, monthly cash flow is $18k ($213k/yr) — positive. Per door: $657/mo.
- The deal already cash-flows at list — no discount required.
- Meets the 1% rule at list price ($27k rent vs $500k).
- Recommended offer: $492k (1.5% below list) — sets the bar for market timing.
Location & tenants
- Location reads 68/100 on livability (#136 in GA) — a middle-class / working-renter tenant base. Strengths: cost of living A+, health & safety A+, crime A; Watch: schools F, amenities F, commute F.
- Miller County (rural): math 23% / reading 26% proficiency, ranked #131 of 174 in GA (top 75%) — low school quality limits family demand, transient renter base, plan for 1-2y turnover; 65% free/reduced lunch — lower-income household profile, screen leases tightly.
- Market conditions: 17 active listings in the ZIP; 2 units permitted in Miller County in 2024 (0 in 5+ unit buildings).
Forward outlook
- In year one you build about $36k of equity ($3k loan paydown + $33k appreciation (6.6% local appreciation)).
- Miller County population projected at -21% by 2050 — secular population decline; favor cash flow + early exit over multi-decade hold.
- At projected returns (6.6% appreciation + 3.0% rent growth), your $140k cash investment doubles in ~1 year — after that, you're playing with house money.
- By year 2, paydown + projected appreciation supports a ~$58k cash-out refi (75% LTV) — recoverable capital for the next deal without selling this one.
Negotiation context
- It's been on market 21 days — a 2% lower offer ($492k) is reasonable based on typical stale-listing flexibility.
Risks & watch-outs
- Watch-outs: flood insurance adds $125/mo.
- Climate carrying-cost: in FEMA flood zone A (mandatory federal flood insurance); severe wind risk, 99% chance of damaging wind over 30y; extreme-heat days projected 7→20/yr by 2055 (HVAC capex compounding) — expect insurance premiums to compound above CPI over the hold.
Questions for the listing agent
- Can we see the unit-by-unit rent roll, current vacancy, and any below-market leases? What's the average tenancy length?
- What capital expenditures (roof, boiler, parking lot, exteriors) have been made in the last 5 years, and what's planned in the next 2?
- What's the actual annual flood-insurance premium (NFIP or private), and is the property in a SFHA with mandatory coverage?
- Is there a deadline driving the sale (1031 exchange, divorce, estate, relocation)? That informs how much negotiation room exists.
- Schools are F-rated, which usually means shorter tenancies and higher turnover. Who's the typical renter profile here, and what's been the actual vacancy rate?
- What's the average days-on-market for RENTAL listings here right now (not sales)? A rising rental-DOM trend means longer vacancies and softer asking-rent achievability than the comps imply.
- What's the recent tenant-quality profile in this submarket — average credit score on applications, eviction rate, late-payment / NSF rate, and stable-employment percentage? A property-management company in the area should have these aggregated.
- How much new apartment / multifamily construction is in the pipeline within 1–3 miles? Heavy new supply (>2% of stock underway) typically softens rents 12–24 months out; light construction supports rent growth.
Investment metrics
- 1% rule
- 5.40% ✓
- Cap rate
- 49.20%
- Cash-on-cash
- 153.23%
- DSCR
- 7.82
- GRM
- 1.5
CMA / ARV
No comps found within radius.
Projected returns pro-forma
6.58% appreciation · 3.0% rent growth · sell at horizon
- IRR
- —
- Equity multiple
- 10.23×
- Total profit
- $1,292,561
- Equity at exit
- $332,696
- IRR
- —
- Equity multiple
- 21.82×
- Total profit
- $2,913,879
- Equity at exit
- $619,922
Cash invested: $139,972 (down + closing). Projections, not guarantees.
Landlord ↔ Tenant lean methodology
- Overall (STATE)
- 90 Strongly Landlord-Friendly
- State Georgia
- 90 Strongly Landlord-Friendly · R+3
- County
- — inherits STATE
- City
- — inherits STATE
ZIP-level market 39837
- Home prices YoY
- 2.7%
- Active inventory
- 17
- Price-to-rent
- 41.7×
Monthly cashflow live
- Estimated rent
- $26,998 medium interval (Pro) →
- Mortgage (P&I)
- −$2,622
- Tax est. 1.5%
- −$625 /mo · $7,498/yr
- Insurance
- −$208
- Flood insurance flood zone
- −$125 /mo · $1,502/yr
- HOA
- −$0
- Vacancy / Maint / Mgmt
- −$5,670
- Net cashflow
- $17,749
Break-even live
27-unit breakdown (identical units grouped — click to expand)
| Units | Beds | Baths | Est. rent |
|---|---|---|---|
| 27× units | 9 | 6 | $27,000 |
| #1 | 9 | 6 | $1,000 |
| #2 | 9 | 6 | $1,000 |
| #3 | 9 | 6 | $1,000 |
| #4 | 9 | 6 | $1,000 |
| #5 | 9 | 6 | $1,000 |
| #6 | 9 | 6 | $1,000 |
| #7 | 9 | 6 | $1,000 |
| #8 | 9 | 6 | $1,000 |
| #9 | 9 | 6 | $1,000 |
| #10 | 9 | 6 | $1,000 |
| #11 | 9 | 6 | $1,000 |
| #12 | 9 | 6 | $1,000 |
| #13 | 9 | 6 | $1,000 |
| #14 | 9 | 6 | $1,000 |
| #15 | 9 | 6 | $1,000 |
| #16 | 9 | 6 | $1,000 |
| #17 | 9 | 6 | $1,000 |
| #18 | 9 | 6 | $1,000 |
| #19 | 9 | 6 | $1,000 |
| #20 | 9 | 6 | $1,000 |
| #21 | 9 | 6 | $1,000 |
| #22 | 9 | 6 | $1,000 |
| #23 | 9 | 6 | $1,000 |
| #24 | 9 | 6 | $1,000 |
| #25 | 9 | 6 | $1,000 |
| #26 | 9 | 6 | $1,000 |
| #27 | 9 | 6 | $1,000 |
| Total (27 units) | $26,998 | ||
UW: 25.0% down · 7.5% · 30yr · 1.5% tax · 5.0% vac · 8.0% maint · 8.0% mgmt
Financing live
Cash to close
- Down payment
- $124,975
- Closing costs
- $14,997
- Reserves months
- —
- Total cash needed
- —
Loan-product check · same deal, 3 products live
Conventional
25% down · 7.5% · 30yr
- Down + closing
- —
- Monthly P&I
- —
- Monthly cashflow
- —
- DSCR
- —
- Eligible?
- —
Personal DTI + credit; lowest rate.
DSCR
20% down · 8.5% · 30yr
- Down + closing
- —
- Monthly P&I
- —
- Monthly cashflow
- —
- DSCR
- —
- Eligible?
- —
No personal income docs; deal must DSCR.
Hard money
10% down · 12.0% · 12mo
- Down + closing
- —
- Monthly P&I
- —
- Monthly cashflow
- —
- DSCR
- —
- Eligible?
- —
Short-term bridge; refi at stabilization.
Listing history 16 events
-
2026-06-18days on market $499,900 Active 21 DOM
-
2026-06-17days on market $499,900 Active 20 DOM
-
2026-06-16days on market $499,900 Active 19 DOM
-
2026-06-15days on market $499,900 Active 18 DOM
-
2026-06-13days on market $499,900 Active 16 DOM
-
2026-06-12days on market $499,900 Active 15 DOM
-
2026-06-09days on market $499,900 Active 12 DOM
-
2026-06-08days on market $499,900 Active 11 DOM
-
2026-06-07days on market $499,900 Active 10 DOM
-
2026-06-07days on market $499,900 Active 9 DOM
-
2026-06-04days on market $499,900 Active 6 DOM
-
2026-06-02days on market $499,900 Active 5 DOM
-
2026-06-01days on market $499,900 Active 4 DOM
-
2026-05-31days on market $499,900 Active 3 DOM
-
2026-05-31days on market $499,900 Active 2 DOM
-
2026-05-28$499,900 Active
ⓘ Source: listings_history table (triggers on properties + properties_extension) + one-shot
backfill from property_details.listing_events for pre-trigger history.
Climate risk First Street
- Flood 4/10 Moderate FEMA zone A · 22% chance over 30 yrs
- Wildfire 3/10 Moderate
- Heat 8/10 Severe 7 d/yr ≥109°F today · 20 d/yr by 30 yrs out
- Wind 8/10 Severe 99% chance of damaging wind over 30 yrs
- Air quality 5/10 Major 7 unhealthy d/yr today · 8 by 30 yrs out
Nearby sold comps map
Loading sold comps map…
Walkable amenities ~0.75 mi
Loading nearby amenities…
Taxation est. · year 1
- Rental income
- $323,976
- − Mortgage interest
- −$28,002
- − Property taxes
- −$7,498
- − Insurance
- −$4,002
- − Repairs & maintenance
- −$25,918
- − Management
- −$25,918
- − Depreciation
- −$14,543
- Taxable income
- $218,095
- Est. tax owed @ 24.0%
- −$52,343
- After-tax cash flow
- $160,639/yr
For passive investors: Depreciation is non-cash, so a rental often shows a tax loss while cash-flowing — sheltering income. Rental losses are passive: they offset passive income freely, and up to $25,000/yr can offset ordinary (W-2) income if you actively participate and your MAGI is under $100k (phasing out to $0 by $150k); unused losses carry forward. On sale, claimed depreciation is recaptured at up to 25%, and gains may owe capital-gains tax (a 1031 exchange can defer both). Figures are a year-1 estimate at your 24.0% rate — not tax advice; consult a CPA.
Schools (NCES district)
- District
- Miller County
- NCES district ID
- 1303660
- Math proficiency
- 23% ▼ -8.00%
- Reading proficiency
- 26% ▼ -7.00%
- Median HH income
- $35,319
- Composite
- 20.24/100
- National rank
- #8625
- State rank
- #131 of 174 in GA
Livability — Colquitt
- Score
- 68/100
- State rank
- #136
- US rank
- #9304
Category grades
Schools grade is shown separately in the Schools card above.
Census & demographics
- Census place
- Colquitt, GA
- Population (ZIP)
- 5,994
Population outlook (Miller County) Hauer SSP2
- Today (2025)
- 5,401 people
- By 2030
- 5,146 · -4.7%
- By 2040
- 4,675 · -13.4%
- By 2050
- 4,282 · -20.7%
- By 2075
- 3,577 · -33.8%
- By 2100
- 3,087 · -42.8%
Race, ethnicity, and origin ACS 2023
- Neighborhood character
- Majority White (64%)
- Race & ethnicity
- White 64% Black 29% Two or more races 4% Hispanic / Latino 3%
- Common ancestry
- Lithuanian 1% Romanian 1% Italian 1%
- Foreign-born
- 2% · Canada
- Languages at home
- 96% English-only · Spanish 2% French/Haitian/Cajun 1%
Political lean MEDSL · Miller
- 2024 margin
- Solid R (+50.5) · D 24.6% · R 75.1%
- 2008→2024 swing
- -11.0pp toward R · 2008: -39.5pp · 2024: -50.5pp
- All cycles
- 2024: R+50.5 2020: R+46.5 2016: R+49.8 2012: R+38.1 2008: R+39.5
Not yet ingested
- Civics
- —
Market trends
- HPI YoY
- ▲ 6.58%
- Current HPI
- 246.936
- Rent YoY
- —
- Metro
- —
- State GDP YoY
- ▲ 2.66%
- F500 in state
- 28
Industry mix (Fortune 500 HQ in GA)
| Industry | F500 HQs | Revenue |
|---|---|---|
| Paper / Packaging | 2 | $29B |
|
||
| Retail | 1 | $160B |
|
||
| Transportation / Logistics | 1 | $91B |
|
||
| Airlines | 1 | $62B |
|
||
| Consumer Goods | 1 | $47B |
|
||
| Utilities | 1 | $25B |
|
||
Price history
1 event — show timeline
- 2026-05-28 Listed $499,900 SGMLS
Cash-flow waterfall
monthlySold comps — $/sqft
last 12 mo · ≤1 miLoading sold comps…