 7-Plex
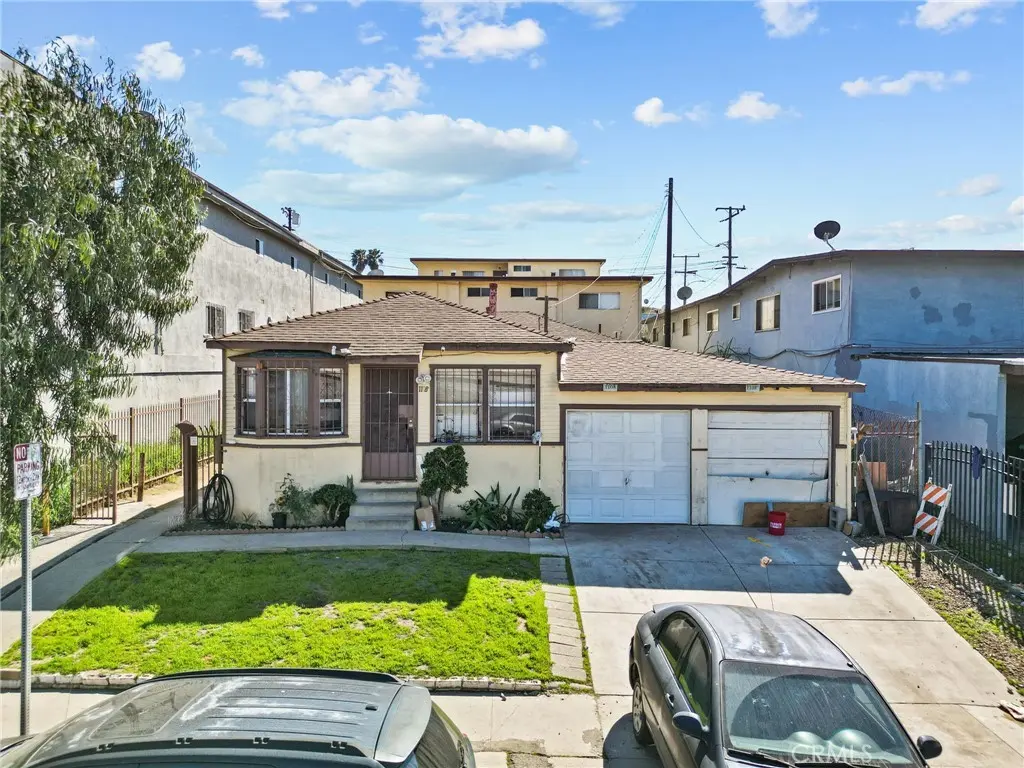
1108 W 117th · West Athens, CA
Flood risk 1/10 · Minimal
- FEMA flood zone
- X (unshaded)
- Chance of flooding over 30 yrs
- 0.0%
- Est. flood insurance / yr
- $507 – $1,088
Fire risk 1/10 · Minimal
- Est. fire insurance / yr
- $659 – $1,223
Heat risk 4/10 · Minor
- Hot days now (above 87°F)
- 6 days/yr
- Hot days in 30 yrs
- 18 days/yr
Wind risk 1/10 · Minimal
- Chance of severe wind over 30 yrs
- —
Air-quality risk 5/10 · Moderate
- Unhealthy air days now
- 7 days/yr
- Unhealthy air days in 30 yrs
- 7 days/yr
Risk factors via First Street. Map © Google.
Why this score? — see what drove the B grade
The composite is a weighted blend of 9 inputs, each scored 0–100. Each bar is that input's sub-score; the figure is the points it added to the 100-point composite (weight × sub-score).
- Cash flow +30.0/30.0
- ARV discount +12.8/15.0
- 1% rule +10.0/10.0
- DSCR +10.0/10.0
- Schools +3.6/10.0
- Livability +3.0/5.0
- Condition / age +2.5/5.0
- Rent growth +1.9/5.0
- Appreciation +0.0/10.0
$1,050,000
🖨 Deal sheet 📄 Offer letter ✓ Due diligence
Multi-family units
County records classify this as Multi-Family (5+ Unit). Listing-text estimate: 7 units. confirmed
5+ unit building — per-unit beds/baths from public records are typically unavailable; the breakdown below (if shown) is an estimate from the listing text.
Listing remarks MLS
1108 W 117th St presents a 7-unit multifamily investment opportunity in the Metro Southwest Los Angeles submarket. The property consists of six 2-bedroom/1-bath units and one 1-bedroom/1-bath unit, offering a desirable unit mix that supports consistent tenant demand. The building is fully occupied, providing stable in-place income with clear long-term upside potential. Current rents total approximately $9,216 per month, producing a trailing twelve-month NOI of approximately $70,285.54. The property offers an approximately 6.69% in-place cap rate, with additional long-term upside. Conveniently located with access to major transportation corridors, employment centers, shopping, and neighborhood amenities, the property benefits from strong rental demand in the surrounding area.
Key facts
- 8,462 sq ft lot
- 7 garage spots
- Built 1947
Neighborhood map
What this means for you Summary
Snapshot
- This is a 7 × 13-bed/7.0-bath units multifamily listed at $1.05M.
Deal economics
- At list price, monthly cash flow is $6k ($77k/yr) — positive. Per door: $915/mo.
- The deal already cash-flows at list — no discount required.
- Meets the 1% rule at list price ($17k rent vs $1.05M).
- Recommended offer: $956k (9.0% below list) — sets the bar for market timing.
Location & tenants
- Location reads 59/100 on livability (#645 in CA) — a working-class tenant base; expect higher turnover. Strengths: schools A+, commute A+; Watch: crime D, amenities F, cost of living F.
- Los Angeles Unified (urban): math 29% / reading 54% proficiency, ranked #223 of 517 in CA (top 43%) — families likely to look elsewhere, expect single-tenant / working-renter base with shorter leases; 67% free/reduced lunch — lower-income household profile, screen leases tightly.
- Market conditions: Rents soft (-2.5%/yr); 172 active listings in the ZIP; 40 comparable units currently listed for rent nearby; rentals at typical pace (median 25d on market — plan ~3-4 weeks tenant-placement turnaround); 45% of comp listings sitting > 30 days — soft ceiling on asking rent; 19,697 units permitted in Los Angeles County in 2024 (9,426 in 5+ unit buildings).
- At $17,100/mo this rent would consume 385% of the median local household income ($53k/yr) (locally 7490% of renters already pay >50% of income on rent) — very limited rent-growth headroom before tenants either downsize or default.
Forward outlook
- Local home prices are declining (-3.0%/yr); year-one equity from $7k of loan paydown is wiped out by about $32k of value loss. Plan a longer hold.
- Los Angeles County population projected at +9% by 2050 — modest demand growth; plan on rents tracking national, not racing it.
- At projected returns (-3.0% appreciation + 0.0% rent growth), your $294k cash investment doubles in ~6 years — after that, you're playing with house money.
Negotiation context
- It's been on market 97 days — a 9% lower offer ($956k) is reasonable based on typical stale-listing flexibility.
- 4 sale attempts since 20y ago with the ask held roughly flat each time — persistent listings suggest the price (not the market) is what's stuck; bring a comps-based counter.
- Current owner paid $580k; list at $1.05M implies a 81% gain — meaningful room to come down on a strong offer.
Risks & watch-outs
- Watch-outs: built in 1947 — expect roof / HVAC / electrical / plumbing capex.
Questions for the listing agent
- It's been on market 97 days. Have you received any prior offers? Is the seller open to a 9% concession, seller financing, or rate buy-down credit?
- Can we see the unit-by-unit rent roll, current vacancy, and any below-market leases? What's the average tenancy length?
- What capital expenditures (roof, boiler, parking lot, exteriors) have been made in the last 5 years, and what's planned in the next 2?
- Built in 1947 — when were the roof, HVAC, electrical panel, plumbing, and water heater last replaced?
- Why hasn't it sold? Are there any deal-killer items the seller is aware of (foundation, flood, title, zoning, code violations)?
- Is there a deadline driving the sale (1031 exchange, divorce, estate, relocation)? That informs how much negotiation room exists.
- Schools are A-rated — typically a magnet for longer-tenancy family renters. What's the average tenant stay here, and is there a school-zone premium baked into asking?
- Crime grade is D in this area — have there been break-ins, vandalism, or insurance claims at this property in the last 3 years? What carrier currently insures it and at what premium?
- What's the average days-on-market for RENTAL listings here right now (not sales)? A rising rental-DOM trend means longer vacancies and softer asking-rent achievability than the comps imply.
- What's the recent tenant-quality profile in this submarket — average credit score on applications, eviction rate, late-payment / NSF rate, and stable-employment percentage? A property-management company in the area should have these aggregated.
- How much new apartment / multifamily construction is in the pipeline within 1–3 miles? Heavy new supply (>2% of stock underway) typically softens rents 12–24 months out; light construction supports rent growth.
Investment metrics
- 1% rule
- 1.63% ✓
- Cap rate
- 13.62%
- Cash-on-cash
- 26.15%
- DSCR
- 2.16
- GRM
- 5.1
CMA / ARV
- ARV (median comp)
- $1,189,595
- List price
- $1,050,000
- Delta
- -11.73%
- Verdict
- UNDERPRICED
- Comps
- 20 within 1.0 mi
Projected returns pro-forma
-3.0% appreciation · 0.0% rent growth · sell at horizon
- IRR
- 16.5%
- Equity multiple
- 1.64×
- Total profit
- $187,986
- Equity at exit
- $156,558
- IRR
- 22.8%
- Equity multiple
- 2.69×
- Total profit
- $496,158
- Equity at exit
- $90,785
Cash invested: $294,000 (down + closing). Projections, not guarantees.
Landlord ↔ Tenant lean methodology
- Overall (STATE)
- 18 Strongly Tenant-Friendly
- State California
- 18 Strongly Tenant-Friendly · D+13
- County
- — inherits STATE
- City
- — inherits STATE
ZIP-level market 90044
- Rents YoY
- -2.5%
- Active inventory
- 172
- Price-to-rent
- 35.8×
Monthly cashflow live
- Estimated rent
- $17,100 medium interval (Pro) →
- Mortgage (P&I)
- −$5,506
- Tax from tax record
- −$1,158 /mo · $13,895/yr
- Insurance
- −$438
- HOA
- −$0
- Vacancy / Maint / Mgmt
- −$3,591
- Net cashflow
- $6,407
Break-even live
7-unit breakdown (identical units grouped — click to expand)
| Units | Beds | Baths | Est. rent |
|---|---|---|---|
| 7× units | 13 | 7 | $17,101 |
| #1 | 13 | 7 | $2,443 |
| #2 | 13 | 7 | $2,443 |
| #3 | 13 | 7 | $2,443 |
| #4 | 13 | 7 | $2,443 |
| #5 | 13 | 7 | $2,443 |
| #6 | 13 | 7 | $2,443 |
| #7 | 13 | 7 | $2,443 |
| Total (7 units) | $17,100 | ||
UW: 25.0% down · 7.5% · 30yr · 1.5% tax · 5.0% vac · 8.0% maint · 8.0% mgmt
Financing live
Cash to close
- Down payment
- $262,500
- Closing costs
- $31,500
- Reserves months
- —
- Total cash needed
- —
Loan-product check · same deal, 3 products live
Conventional
25% down · 7.5% · 30yr
- Down + closing
- —
- Monthly P&I
- —
- Monthly cashflow
- —
- DSCR
- —
- Eligible?
- —
Personal DTI + credit; lowest rate.
DSCR
20% down · 8.5% · 30yr
- Down + closing
- —
- Monthly P&I
- —
- Monthly cashflow
- —
- DSCR
- —
- Eligible?
- —
No personal income docs; deal must DSCR.
Hard money
10% down · 12.0% · 12mo
- Down + closing
- —
- Monthly P&I
- —
- Monthly cashflow
- —
- DSCR
- —
- Eligible?
- —
Short-term bridge; refi at stabilization.
Rent comps 40 comps
| Address | Beds | Baths | Sqft | Rent | $/sqft | DOM | Units | Dist |
|---|---|---|---|---|---|---|---|---|
| 1060 W 117th St Los Angeles, CA | 1.0 | 1.0 | 650 | $1,900 | $2.92 | 17d | 1 | 0.07mi |
| 1140 W 120th St Unit 8 Los Angeles, CA | 2.0 | 1.0 | 585 | $1,800 | $3.08 | 18d | 1 | 0.32mi |
| 11134 S New Hampshire Ave Los Angeles, CA | 1.0 | 1.0 | 750 | $1,625 | $2.17 | 43d | 1 | 0.41mi |
| 11134 S New Hampshire Ave Unit 10 Los Angeles, CA | 1.0 | 1.0 | 750 | $1,625 | $2.17 | 24d | 1 | 0.41mi |
| 1377 W 112th St Unit 8 Los Angeles, CA | 1.0 | 1.0 | 650 | $1,900 | $2.92 | 43d | 1 | 0.45mi |
| 1125 1/2 W 111th St Los Angeles, CA | 1.0 | 1.0 | 625 | $1,650 | $2.64 | 24d | 1 | 0.47mi |
| 11106 S Normandie Ave Los Angeles, CA | 2.0 | 1.0 | 692 | $2,061 | $2.98 | 43d | 1 | 0.52mi |
| 11100 Normandie Ave Unit 3/4 Los Angeles, CA | 2.0 | 1.0 | 750 | $2,100 | $2.80 | 24d | 1 | 0.54mi |
| 1336 W 109th Pl Unit 1/4 Los Angeles, CA | 1.0 | 1.0 | 500 | $1,600 | $3.20 | 43d | 1 | 0.63mi |
| 1336 W 109th St Los Angeles, CA | 2.0 | 1.0 | 580 | $2,200 | $3.79 | 43d | 1 | 0.67mi |
| 1212 W 107th St Unit 22 Los Angeles, CA | 1.0 | 1.0 | 675 | $1,595 | $2.36 | 43d | 1 | 0.73mi |
| 538 W 111th Pl Los Angeles, CA | 1.0 | 1.0 | 420 | $2,199 | $5.24 | 24d | 1 | 0.74mi |
| 10623 S Budlong Ave Los Angeles, CA | 2.0 | 1.0 | 700 | $2,095 | $2.99 | 3d | 2 | 0.79mi |
| 1735 W 120th St Los Angeles, CA | 1.0 | 1.0 | 470 | $1,695 | $3.61 | 7d | 1 | 0.79mi |
| 1735 W 120th St Unit 1731-8 Los Angeles, CA | 1.0 | 1.0 | 470 | $1,695 | $3.61 | 3d | 1 | 0.79mi |
| 1317 W 107th St Los Angeles, CA | 1.0 | 1.0 | 512 | $1,695 | $3.31 | 43d | 1 | 0.79mi |
| 1745 W 120th St Los Angeles, CA | 1.0 | 1.0 | 470 | $1,695 | $3.61 | 10d | 1 | 0.81mi |
| 1153 W 106th St Unit 04 Los Angeles, CA | 1.0 | 1.0 | 550 | $1,800 | $3.27 | 43d | 1 | 0.84mi |
| 10514 1/4 S Vermont Ave Los Angeles, CA | 1.0 | 1.0 | 650 | $1,695 | $2.61 | 7d | 1 | 0.87mi |
| 745 W 106th St Los Angeles, CA | 1.0 | 1.0 | 403 | $2,200 | $5.46 | 5d | 1 | 0.91mi |
| 12633 S Figueroa St Los Angeles, CA | 1.0 | 1.0 | 700 | $1,495 | $2.14 | 1d | 1 | 0.97mi |
| 550 W 106th St Unit 550 Los Angeles, CA | 1.0 | 1.0 | 572 | $1,650 | $2.88 | 4d | 1 | 1.01mi |
| 1543 W 105th St Unit C Los Angeles, CA | 1.0 | 1.0 | 635 | $1,850 | $2.91 | 43d | 1 | 1.04mi |
| 227 W Imperial Hwy Unit B Los Angeles, CA | 1.0 | 1.0 | 500 | $2,289 | $4.58 | 43d | 1 | 1.05mi |
| 1731 W 107th St Unit 1733 01 Los Angeles, CA | 1.0 | 1.0 | 622 | $2,000 | $3.22 | 43d | 1 | 1.08mi |
| 10520 S Figueroa St Los Angeles, CA | — | 1.0 | 450 | $1,398 | $3.11 | 3d | 1 | 1.12mi |
| 145 W 118th Pl Los Angeles, CA | 1.0 | 1.0 | 600 | $1,600 | $2.67 | 11d | 1 | 1.13mi |
| 136 W Imperial Hwy Los Angeles, CA | — | 1.0 | 465 | $2,100 | $4.52 | 24d | 1 | 1.15mi |
| 142 W 111th Pl Unit 142 Los Angeles, CA | 2.0 | 1.0 | 730 | $2,350 | $3.22 | 2d | 1 | 1.19mi |
| 817 W 101st St Los Angeles, CA | 2.0 | 1.0 | 638 | $2,100 | $3.29 | 43d | 1 | 1.20mi |
| 11813 Main St Unit 11815 Los Angeles, CA | — | 1.0 | 375 | $1,350 | $3.60 | 4d | 1 | 1.20mi |
| 1535 W 102nd St Unit 06 Los Angeles, CA | 2.0 | 1.0 | 625 | $1,895 | $3.03 | 43d | 1 | 1.23mi |
| 1834 W El Segundo Blvd Gardena, CA | 1.0 | 1.0 | 708 | $1,765 | $2.49 | 43d | 1 | 1.25mi |
| 12423 Main St Los Angeles, CA | 2.0 | 1.0 | 546 | $2,395 | $4.39 | 24d | 1 | 1.33mi |
| 212 E Imperial Hwy Los Angeles, CA | 1.0 | 1.0 | 500 | $1,640 | $3.28 | 43d | 1 | 1.38mi |
| 10914 Main St Unit 202 Los Angeles, CA | 2.0 | 1.0 | 570 | $2,595 | $4.55 | 19d | 1 | 1.38mi |
| 218 E Imperial Hwy Los Angeles, CA | 1.0 | 1.0 | 500 | $1,640 | $3.28 | 43d | 1 | 1.39mi |
| 1317 W 97th St Unit 1 Los Angeles, CA | 1.0 | 1.0 | 750 | $1,750 | $2.33 | 16d | 1 | 1.39mi |
| 2110 W El Segundo Blvd Unit 3 Gardena, CA | 1.0 | 1.0 | 690 | $1,695 | $2.46 | 44d | 1 | 1.45mi |
| 10338 S Wilton Pl Unit A Los Angeles, CA | 1.0 | 1.0 | 650 | $2,350 | $3.62 | 43d | 1 | 1.47mi |
Listing history 21 events
-
2026-06-18days on market $1,050,000 Active 97 DOM
-
2026-06-17days on market $1,050,000 Active 96 DOM
-
2026-06-16days on market $1,050,000 Active 95 DOM
-
2026-06-15days on market $1,050,000 Active 94 DOM
-
2026-06-13days on market $1,050,000 Active 92 DOM
-
2026-06-09days on market $1,050,000 Active 88 DOM
-
2026-06-08days on market $1,050,000 Active 87 DOM
-
2026-06-07days on market $1,050,000 Active 86 DOM
-
2026-06-04days on market $1,050,000 Active 83 DOM
-
2026-06-03days on market $1,050,000 Active 82 DOM
-
2026-06-02days on market $1,050,000 Active 81 DOM
-
2026-06-01days on market $1,050,000 Active 80 DOM
-
2026-05-31days on market $1,050,000 Active 79 DOM
-
2026-04-27status Active 785-char remark
Show marketing remark (785 chars)
1108 W 117th St presents a 7-unit multifamily investment opportunity in the Metro Southwest Los Angeles submarket. The property consists of six 2-bedroom/1-bath units and one 1-bedroom/1-bath unit, offering a desirable unit mix that supports consistent tenant demand. The building is fully occupied, providing stable in-place income with clear long-term upside potential. Current rents total approximately $9,216 per month, producing a trailing twelve-month NOI of approximately $70,285.54. The property offers an approximately 6.69% in-place cap rate, with additional long-term upside. Conveniently located with access to major transportation corridors, employment centers, shopping, and neighborhood amenities, the property benefits from strong rental demand in the surrounding area.
-
2026-04-17historical Active Under Contract 785-char remark
Show marketing remark (785 chars)
1108 W 117th St presents a 7-unit multifamily investment opportunity in the Metro Southwest Los Angeles submarket. The property consists of six 2-bedroom/1-bath units and one 1-bedroom/1-bath unit, offering a desirable unit mix that supports consistent tenant demand. The building is fully occupied, providing stable in-place income with clear long-term upside potential. Current rents total approximately $9,216 per month, producing a trailing twelve-month NOI of approximately $70,285.54. The property offers an approximately 6.69% in-place cap rate, with additional long-term upside. Conveniently located with access to major transportation corridors, employment centers, shopping, and neighborhood amenities, the property benefits from strong rental demand in the surrounding area.
-
2026-04-06status Active 785-char remark
Show marketing remark (785 chars)
1108 W 117th St presents a 7-unit multifamily investment opportunity in the Metro Southwest Los Angeles submarket. The property consists of six 2-bedroom/1-bath units and one 1-bedroom/1-bath unit, offering a desirable unit mix that supports consistent tenant demand. The building is fully occupied, providing stable in-place income with clear long-term upside potential. Current rents total approximately $9,216 per month, producing a trailing twelve-month NOI of approximately $70,285.54. The property offers an approximately 6.69% in-place cap rate, with additional long-term upside. Conveniently located with access to major transportation corridors, employment centers, shopping, and neighborhood amenities, the property benefits from strong rental demand in the surrounding area.
-
2026-03-18historical Active Under Contract 785-char remark
Show marketing remark (785 chars)
1108 W 117th St presents a 7-unit multifamily investment opportunity in the Metro Southwest Los Angeles submarket. The property consists of six 2-bedroom/1-bath units and one 1-bedroom/1-bath unit, offering a desirable unit mix that supports consistent tenant demand. The building is fully occupied, providing stable in-place income with clear long-term upside potential. Current rents total approximately $9,216 per month, producing a trailing twelve-month NOI of approximately $70,285.54. The property offers an approximately 6.69% in-place cap rate, with additional long-term upside. Conveniently located with access to major transportation corridors, employment centers, shopping, and neighborhood amenities, the property benefits from strong rental demand in the surrounding area.
-
2026-03-13$1,050,000 Active 785-char remark
Show marketing remark (785 chars)
1108 W 117th St presents a 7-unit multifamily investment opportunity in the Metro Southwest Los Angeles submarket. The property consists of six 2-bedroom/1-bath units and one 1-bedroom/1-bath unit, offering a desirable unit mix that supports consistent tenant demand. The building is fully occupied, providing stable in-place income with clear long-term upside potential. Current rents total approximately $9,216 per month, producing a trailing twelve-month NOI of approximately $70,285.54. The property offers an approximately 6.69% in-place cap rate, with additional long-term upside. Conveniently located with access to major transportation corridors, employment centers, shopping, and neighborhood amenities, the property benefits from strong rental demand in the surrounding area.
-
2006-11-20historical
-
2006-10-31soldstatus $580,000
-
2006-07-14
ⓘ Source: listings_history table (triggers on properties + properties_extension) + one-shot
backfill from property_details.listing_events for pre-trigger history.
Tax reassessment forecast CA · Resets to sale price
- Current annual tax
- $13,895 · $1,158/mo
- Projected year-2 tax
- $13,895 · $1,158/mo
- Expected delta
- $0/yr ($0/mo · 0.0%)
ⓘ Screening estimate from a state-policy table — verify with the county assessor before closing.
Climate risk First Street
- Flood 1/10 Low FEMA zone X (unshaded) · 0% chance over 30 yrs
- Wildfire 1/10 Low
- Heat 4/10 Moderate 6 d/yr ≥87°F today · 18 d/yr by 30 yrs out
- Wind 1/10 Low
- Air quality 5/10 Major 7 unhealthy d/yr today · 7 by 30 yrs out
Nearby sold comps map
Loading sold comps map…
Walkable amenities ~0.75 mi
Loading nearby amenities…
Taxation est. · year 1
- Rental income
- $205,200
- − Mortgage interest
- −$58,816
- − Property taxes
- −$13,895
- − Insurance
- −$5,250
- − Repairs & maintenance
- −$16,416
- − Management
- −$16,416
- − Depreciation
- −$30,545
- Taxable income
- $63,861
- Est. tax owed @ 24.0%
- −$15,327
- After-tax cash flow
- $61,560/yr
For passive investors: Depreciation is non-cash, so a rental often shows a tax loss while cash-flowing — sheltering income. Rental losses are passive: they offset passive income freely, and up to $25,000/yr can offset ordinary (W-2) income if you actively participate and your MAGI is under $100k (phasing out to $0 by $150k); unused losses carry forward. On sale, claimed depreciation is recaptured at up to 25%, and gains may owe capital-gains tax (a 1031 exchange can defer both). Figures are a year-1 estimate at your 24.0% rate — not tax advice; consult a CPA.
Schools (NCES district)
- District
- Los Angeles Unified
- NCES district ID
- 0622710
- Math proficiency
- 29% ▼ -4.00%
- Reading proficiency
- 54% ▲ 10.00%
- Median HH income
- $50,403
- Composite
- 35.67/100
- National rank
- #4875
- State rank
- #223 of 517 in CA
Livability — West Athens
- Score
- 59/100
- State rank
- #645
- US rank
- #20146
Category grades
Schools grade is shown separately in the Schools card above.
Census & demographics
- Census place
- West Athens, CA
- County
- Los Angeles County · 9,444,647 people
- Metro
- Los Angeles-Long Beach-Anaheim, CA
- Population (ZIP)
- 94,830
- Household income
- $53,302
- Rent vs Own
- Severe rent burden
- 7490.0
Population outlook (Los Angeles County) Hauer SSP2
- Today (2025)
- 10,940,515 people
- By 2030
- 11,256,481 · +2.9%
- By 2040
- 11,729,929 · +7.2%
- By 2050
- 11,948,407 · +9.2%
- By 2075
- 11,818,114 · +8.0%
- By 2100
- 10,842,928 · -0.9%
Race, ethnicity, and origin ACS 2023
- Neighborhood character
- Predominantly Hispanic (67%)
- Race & ethnicity
- Hispanic / Latino 67% Black 29% Two or more races 23% White 1% Native American 1%
- Hispanic origin (detail)
- Mexican 39%
- Foreign-born
- 34% · Canada
- Languages at home
- 37% English-only · Spanish 62%
Political lean MEDSL · Los Angeles
- 2024 margin
- Solid D (+32.9) · D 64.8% · R 31.9% · Other 3.3%
- 2008→2024 swing
- -7.4pp toward R · 2008: 40.4pp · 2024: 32.9pp
- All cycles
- 2024: D+32.9 2020: D+44.2 2016: D+48.0 2012: D+40.0 2008: D+40.4
Not yet ingested
- Civics
- —
Market trends
- HPI YoY
- ▼ -691.99%
- Current HPI
- 467.9845
- Rent YoY
- ▼ -2.50%
- Metro
- Los Angeles-Long Beach-Anaheim, CA
- State GDP YoY
- ▲ 3.21%
- F500 in state
- 116
Industry mix (Fortune 500 HQ in CA)
| Industry | F500 HQs | Revenue |
|---|---|---|
| Technology | 27 | $1,492B |
|
||
| Financial Services | 3 | $174B |
|
||
| Retail | 3 | $44B |
|
||
| Insurance | 3 | $26B |
|
||
| Media / Entertainment | 2 | $115B |
|
||
| Pharmaceuticals / Biotech | 2 | $62B |
|
||
Price history
+81.0% since first listed8 events — show timeline
- 2026-04-27 Relisted — CRMLS
- 2026-04-17 Contingent — CRMLS
- 2026-04-06 Relisted — CRMLS
- 2026-03-18 Contingent — CRMLS
- 2026-03-13 Listed $1,050,000 CRMLS
- 2006-11-20 Delisted — TheMLS
- 2006-10-31 Sold (Public Records) $580,000 Public Records
- 2006-07-14 Listed — TheMLS
Property tax history
+2.2%/yrLatest (2025): $13,895 · +7.6% YoY. Source: county tax records.
Cash-flow waterfall
monthlySold comps — $/sqft
last 12 mo · ≤1 miLoading sold comps…