106 Tartan Ln · Greenwood, SC
Flood risk No data
- FEMA flood zone
- —
- Chance of flooding over 30 yrs
- —
- Est. flood insurance / yr
- —
Fire risk No data
- Est. fire insurance / yr
- —
Heat risk No data
- Hot days now (above threshold)
- —
- Hot days in 30 yrs
- —
Wind risk No data
- Chance of severe wind over 30 yrs
- —
Air-quality risk No data
- Unhealthy air days now
- —
- Unhealthy air days in 30 yrs
- —
Risk factors via First Street. Map © Google.
Why this score? — see what drove the D- grade
The composite is a weighted blend of 9 inputs, each scored 0–100. Each bar is that input's sub-score; the figure is the points it added to the 100-point composite (weight × sub-score).
- Cash flow +12.9/30.0
- ARV discount +6.9/15.0
- Condition / age +4.0/5.0
- 1% rule +3.8/10.0
- DSCR +3.8/10.0
- Livability +3.2/5.0
- Schools +2.9/10.0
- Rent growth +2.5/5.0
- Appreciation +0.0/10.0
$290,400
🖨 Deal sheet (PDF) 📄 Offer letter ✓ Due diligence
Listing remarks
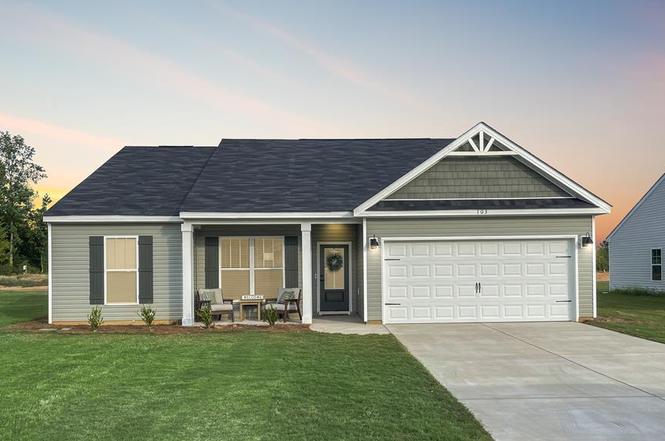
Welcome home to the newest westside community, Sagewood Grove. This lovely home is the Ashford, three bedrooms and two full bathrooms on one SINGLE LEVEL! The cute, covered front porch is the first thing that you will be drawn to. Enter through the foyer which connects to a large living room with an open concept that leads into the eat in kitchen and dining area. The kitchen has a pantry, custom soft close cabinets, granite counter tops, 8 inch stainless under-mount sink, recessed & pendant lighting, and Whirlpool stainless steel dishwasher, smooth top range & built-in microwave. Walk through the French doors into the wonderful study (or playroom, zoom room, office, guest room.
Key facts
- 0.25 acre lot
- 2 garage spots
- Built 2025
Neighborhood map
What this means for you Summary
Snapshot
- This is a 3-bed/2.0-bath single-family listed at $290k. Condition is rated good.
Deal economics
- At list price, monthly cash flow is $-23 ($-276/yr) — negative.
- To cash-flow at today's rent, offer at most $287k (1.1% below list).
- To meet the 1% rule (rent ≥ 1% of price), the offer needs to be $255k (12.3% below list).
- Recommended offer: $255k (12.3% below list) — sets the bar for 1% rule.
- Cap rate 6.2% vs local median 3.6% in Greenwood — top-decile yield for the area; either an underpriced asset or a hidden risk that comps aren't pricing in. Stress-test before assuming the spread holds.
Location & tenants
- Location reads 63/100 on livability (#167 in SC) — a middle-class / working-renter tenant base. Strengths: cost of living A+, health & safety A+, housing A; Watch: amenities D, crime F, commute F.
- Greenwood 50 (town): math 31% / reading 39% proficiency, ranked #43 of 80 in SC (top 54%) — families likely to look elsewhere, expect single-tenant / working-renter base with shorter leases.
- Zoned schools: Dr. Benjamin E. Mays Elementary (math 30% / reading 34%, grade F, #369 of 597 statewide, top 64%, 572 students, 100% FRL); Westview Middle (math 37% / reading 38%, grade F, #90 of 229 statewide, top 42%, 674 students, 100% FRL); Emerald High (math 42% / reading 82%, grade B-, #99 of 196 statewide, top 53%, 812 students, 100% FRL) — zoned schools average 100% FRL vs 59% district-wide (41 pts higher); higher-poverty schools than district average — tighter screening recommended.
- Market conditions: 166 active listings in the ZIP; 4 comparable units currently listed for rent nearby; rentals at typical pace (median 26d on market — plan ~3-4 weeks tenant-placement turnaround); 193 units permitted in Greenwood County in 2024 (0 in 5+ unit buildings).
Forward outlook
- Local home prices are declining (-3.0%/yr); year-one equity from $2k of loan paydown is wiped out by about $9k of value loss. Plan a longer hold.
- Greenwood County population projected to shrink 8% by 2050 — rents likely to lag national; underwrite the cash flow, not the appreciation.
Negotiation context
- Only 1 days on market — expect competitive offers; lowballing is unlikely to land.
Questions for the listing agent
- What do current leases actually rent for vs. the listed asking? Can we see a recent rent roll and the last 12 months of T-12 income?
- What does the HOA fee cover, when was the last increase, and are there any pending special assessments or reserve-fund shortfalls?
- Is there a deadline driving the sale (1031 exchange, divorce, estate, relocation)? That informs how much negotiation room exists.
- Schools are F-rated, which usually means shorter tenancies and higher turnover. Who's the typical renter profile here, and what's been the actual vacancy rate?
- Crime grade is F in this area — have there been break-ins, vandalism, or insurance claims at this property in the last 3 years? What carrier currently insures it and at what premium?
- The area grade is low — what's the realistic commute time and amenity access for the typical tenant pool here? Any planned neighborhood developments (good or bad) we should know about?
- What's the average days-on-market for RENTAL listings here right now (not sales)? A rising rental-DOM trend means longer vacancies and softer asking-rent achievability than the comps imply.
- What's the recent tenant-quality profile in this submarket — average credit score on applications, eviction rate, late-payment / NSF rate, and stable-employment percentage? A property-management company in the area should have these aggregated.
- How much new for-sale + rental construction is in the pipeline within 1–3 miles? Heavy new supply typically softens prices + rents 12–24 months out; constrained supply supports both.
Investment metrics
- 1% rule
- 0.88% ✗
- Cap rate
- 6.20%
- Cash-on-cash
- -0.34%
- DSCR
- 0.98
- GRM
- 9.5
CMA / ARV
- ARV (on-the-fly)
- $286,400
- Comps found
- 12
Show comp detail 12 sales within ~0.75 mi
| Address | Dist | Beds/Ba | Sqft | Sold | Price | $/sf | Match |
|---|---|---|---|---|---|---|---|
| 106 Tartan Ln | 0.00mi | 3/2.0 | 1,662 (+4%) | 0mo | $297,740 | $179 | 93 |
| 111 Burberry Cir | 0.05mi | 3/2.0 | 1,662 (+4%) | 0mo | $288,400 | $174 | 91 |
| 222 Burberry Cir | 0.11mi | 3/2.0 | 1,662 (+4%) | 1mo | $307,690 | $185 | 87 |
| 124 Burberry Circle Lot 10 Cir | 0.12mi | 3/2.0 | 1,550 (-3%) | 4mo | $277,300 | $179 | 86 |
| 130 Burberry Cir | 0.11mi | 3/2.0 | 1,650 (+3%) | 5mo | $284,650 | $173 | 86 |
| 204 Burberry Cr Lot 15 Cir | 0.12mi | 3/2.0 | 1,662 (+4%) | 4mo | $297,810 | $179 | 85 |
| 122 Burberry Cir | 0.11mi | 3/2.0 | 1,662 (+4%) | 9mo | $295,690 | $178 | 81 |
| 202 Burberry Cir Lot 14 Cir | 0.11mi | 4/2.0 (+1) | 1,672 (+4%) | 2mo | $293,400 | $175 | 81 |
| 116 Burberry Cir | 0.09mi | 3/2.0 | 1,680 (+5%) | 9mo | $283,900 | $169 | 80 |
| 114 Burberry Circle Lot 7 | 0.17mi | 3/2.0 | 1,550 (-3%) | 9mo | $280,790 | $181 | 79 |
| 131 Westgate Dr | 0.71mi | 3/2.0 | 1,585 (-1%) | 2mo | $261,375 | $165 | 63 |
| 304 Sagewood Rd | 0.41mi | 4/2.5 (+1) | 1,810 (+13%) | 1mo | $340,000 | $188 | 51 |
Match score weights: distance 35% · size 25% · config 20% · recency 20%. Top-matched comps best support the ARV.
Projected returns pro-forma
-3.0% appreciation · 3.0% rent growth · sell at horizon
- IRR
- -16.8%
- Equity multiple
- 0.40×
- Total profit
- $-48,463
- Equity at exit
- $43,300
- IRR
- -8.7%
- Equity multiple
- 0.46×
- Total profit
- $-43,856
- Equity at exit
- $25,108
Cash invested: $81,312 (down + closing). Projections, not guarantees.
Landlord ↔ Tenant lean methodology
- Overall (STATE)
- 90 Strongly Landlord-Friendly
- State South Carolina
- 90 Strongly Landlord-Friendly · R+6
- County
- — inherits STATE
- City
- — inherits STATE
ZIP-level market 29646
- Active inventory
- 166
- Price-to-rent
- 9.5×
Monthly cashflow live
- Estimated rent
- $2,548 medium interval (Pro) →
- Mortgage (P&I)
- −$1,523
- Tax est. 1.5%
- −$363 /mo · $4,356/yr
- Insurance
- −$121
- HOA
- −$29
- Vacancy / Maint / Mgmt
- −$535
- Net cashflow
- $-23
Break-even live
Sensitivity live
| Price | -10% $178 | -5% $77 | +0% $-23 | +5% $-123 | +10% $-224 |
|---|---|---|---|---|---|
| Rent | -10% $-224 | -5% $-124 | +0% $-23 | +5% $78 | +10% $178 |
| Rate | -1.0pp $123 | -0.5pp $51 | base $-23 | +0.5pp $-98 | +1.0pp $-175 |
UW: 25.0% down · 7.5% · 30yr · 1.5% tax · 5.0% vac · 8.0% maint · 8.0% mgmt
Financing live
Cash to close
- Down payment
- $72,600
- Closing costs
- $8,712
- Reserves months
- —
- Total cash needed
- —
Loan-product check · same deal, 3 products live
Conventional
25% down · 7.5% · 30yr
- Down + closing
- —
- Monthly P&I
- —
- Monthly cashflow
- —
- DSCR
- —
- Eligible?
- —
Personal DTI + credit; lowest rate.
DSCR
20% down · 8.5% · 30yr
- Down + closing
- —
- Monthly P&I
- —
- Monthly cashflow
- —
- DSCR
- —
- Eligible?
- —
No personal income docs; deal must DSCR.
Hard money
10% down · 12.0% · 12mo
- Down + closing
- —
- Monthly P&I
- —
- Monthly cashflow
- —
- DSCR
- —
- Eligible?
- —
Short-term bridge; refi at stabilization.
Rent comps 4 comps
| Address | Beds | Baths | Sqft | Rent | $/sqft | DOM | Units | Dist |
|---|---|---|---|---|---|---|---|---|
| 104 Woodhaven Ct Unit 104 Greenwood, SC | 2.0 | 2.0 | 1305 | $2,500 | $1.92 | 25d | 1 | 0.84mi |
| 218 Woodhaven Ct Greenwood, SC | 2.0 | 2.0 | 1218 | $2,600 | $2.13 | 25d | 1 | 0.88mi |
| 218 Woodhaven Ct Unit 218 Greenwood, SC | 2.0 | 2.0 | 1218 | $2,600 | $2.13 | 16d | 1 | 0.88mi |
| 210 Woodhaven Ct Unit 210 Greenwood, SC | 2.0 | 2.0 | 1305 | $2,500 | $1.92 | 25d | 1 | 0.91mi |
HOA detail
- Monthly dues
- $29 · $348/yr
- Likely covers
- pool
Listing history 2 events
-
2026-02-10status Pending
-
2026-02-10$290,400 Active
ⓘ Source: listings_history table (triggers on properties + properties_extension) + one-shot
backfill from property_details.listing_events for pre-trigger history.
Nearby sold comps map
Loading sold comps map…
Walkable amenities ~0.75 mi
Loading nearby amenities…
Taxation est. · year 1
- Rental income
- $30,576
- − Mortgage interest
- −$16,267
- − Property taxes
- −$4,356
- − Insurance
- −$1,452
- − Repairs & maintenance
- −$2,446
- − Management
- −$2,446
- − HOA
- −$348
- − Depreciation
- −$8,448
- Taxable loss
- −$5,187
- Est. tax savings @ 24.0%
- +$1,245
- After-tax cash flow
- $969/yr
For passive investors: Depreciation is non-cash, so a rental often shows a tax loss while cash-flowing — sheltering income. Rental losses are passive: they offset passive income freely, and up to $25,000/yr can offset ordinary (W-2) income if you actively participate and your MAGI is under $100k (phasing out to $0 by $150k); unused losses carry forward. On sale, claimed depreciation is recaptured at up to 25%, and gains may owe capital-gains tax (a 1031 exchange can defer both). Figures are a year-1 estimate at your 24.0% rate — not tax advice; consult a CPA.
Condition & rehab AI · 13 photos
This single-story home in Greenwood, SC is in good condition with a fresh paint job and new roof. It offers a spacious layout with hardwood floors and modern finishes, making it a great investment opportunity.
Value-add opportunities
- Resale Paint exterior trim — Enhances curb appeal and value.
- Rental Clean gutters — Keeps property in good condition and reduces maintenance costs.
Renovation cost estimate screening
Value-add ROI direction
- Resale Paint exterior trim — Enhances curb appeal and value. ↑
- Rental Clean gutters — Keeps property in good condition and reduces maintenance costs. ↑
ⓘ Cost ranges are severity-bucket heuristics (US national rule-of-thumb). Get contractor quotes + a written scope before underwriting a rehab budget.
Schools (NCES district)
- District
- Greenwood 50
- NCES district ID
- 4502340
- Math proficiency
- 31% ▼ -4.00%
- Reading proficiency
- 39% ▲ 2.00%
- Median HH income
- $37,663
- Composite
- 29.14/100
- National rank
- #6585
- State rank
- #43 of 80 in SC
Livability — Greenwood
- Score
- 63/100
- State rank
- #167
- US rank
- #15097
Category grades
Schools grade is shown separately in the Schools card above.
Census & demographics
- City population
- 26,275
- Population (ZIP)
- 28,413
Population outlook (Greenwood County) Hauer SSP2
- Today (2025)
- 69,627 people
- By 2030
- 68,905 · -1.0%
- By 2040
- 66,640 · -4.3%
- By 2050
- 63,768 · -8.4%
- By 2075
- 55,769 · -19.9%
- By 2100
- 47,293 · -32.1%
Race, ethnicity, and origin ACS 2023
- Neighborhood character
- Diverse neighborhood (Simpson 0.61)
- Race & ethnicity
- White 44% Black 43% Hispanic / Latino 10% Two or more races 3%
- Hispanic origin (detail)
- Mexican 9%
- Common ancestry
- Slovak 1% Serbian 1% Lithuanian 1%
- Foreign-born
- 5% · Canada, Dominican Republic
- Languages at home
- 92% English-only · Spanish 7%
Political lean MEDSL · Greenwood
- 2024 margin
- Strong R (+29.0) · D 34.9% · R 63.8% · Other 1.3%
- 2008→2024 swing
- -13.3pp toward R · 2008: -15.7pp · 2024: -29.0pp
- All cycles
- 2024: R+29.0 2020: R+22.8 2016: R+21.8 2012: R+15.4 2008: R+15.7
Not yet ingested
- Civics
- —
Market trends
- HPI YoY
- ▼ -208.03%
- Current HPI
- 153.1055
- Rent YoY
- —
- Metro
- —
- State GDP YoY
- ▲ 4.51%
- F500 in state
- 2
Industry mix (Fortune 500 HQ in SC)
| Industry | F500 HQs | Revenue |
|---|---|---|
| Packaging | 1 | $7B |
|
||
Price history
2 events — show timeline
- 2026-02-10 Pending — GAOR
- 2026-02-10 Listed $290,400 GAOR
Cash-flow waterfall
monthlySold comps — $/sqft
last 12 mo · ≤1 miLoading sold comps…