132 Jasmine Ct · South Mills, NC
Flood risk No data
- FEMA flood zone
- —
- Chance of flooding over 30 yrs
- —
- Est. flood insurance / yr
- —
Fire risk No data
- Est. fire insurance / yr
- —
Heat risk No data
- Hot days now (above threshold)
- —
- Hot days in 30 yrs
- —
Wind risk No data
- Chance of severe wind over 30 yrs
- —
Air-quality risk No data
- Unhealthy air days now
- —
- Unhealthy air days in 30 yrs
- —
Risk factors via First Street. Map © Google.
Why this score? — see what drove the D grade
The composite is a weighted blend of 9 inputs, each scored 0–100. Each bar is that input's sub-score; the figure is the points it added to the 100-point composite (weight × sub-score).
- Cash flow +9.3/30.0
- ARV discount +5.9/15.0
- Schools +5.2/10.0
- Appreciation +4.8/10.0
- Condition / age +4.8/5.0
- 1% rule +3.0/10.0
- Livability +2.9/5.0
- DSCR +2.6/10.0
- Rent growth +2.5/5.0
$411,450
🖨 Deal sheet (PDF) 📄 Offer letter ✓ Due diligence
Listing remarks
CEDAR. SOLD. TBB.
Key facts
- 6,534 sq ft lot
- 2 garage spots
- Built 2026
Neighborhood map
What this means for you Summary
Snapshot
- This is a 4-bed/2.5-bath single-family listed at $411k. Condition is rated excellent.
Deal economics
- At list price, monthly cash flow is $-301 ($-4k/yr) — negative.
- To cash-flow at today's rent, offer at most $368k (10.6% below list).
- To meet the 1% rule (rent ≥ 1% of price), the offer needs to be $330k (19.8% below list).
- Recommended offer: $330k (19.8% below list) — sets the bar for 1% rule.
Location & tenants
- Location reads 57/100 on livability (#612 in NC) — a working-class tenant base; expect higher turnover. Strengths: cost of living A+, crime A, housing A; Watch: amenities F, commute F, employment F.
- Camden County Schools (rural): math 56% / reading 64% proficiency, ranked #29 of 178 in NC (top 16%) — acceptable for families but not a draw, mixed tenant base, ~2y average lease.
- Zoned schools: Grandy Primary (math 87% / reading 72%, grade A, #24 of 1,410 statewide, top 2%, 607 students, 32% FRL); Camden Intermediate (math 50% / reading 61%, grade B-, #76 of 475 statewide, top 16%, 440 students, 24% FRL); Camden County High (math 62% / reading 62%, grade B-, #184 of 535 statewide, top 37%, 464 students, 25% FRL) — zoned schools at 27% FRL track the district average.
- Market conditions: 86 active listings in the ZIP; 1 comparable units currently listed for rent nearby; 105 units permitted in Camden County in 2024 (0 in 5+ unit buildings).
Forward outlook
- In year one you build about $1k of equity ($3k loan paydown + $-2k appreciation (-0.4% local appreciation)).
- Camden County population projected at +5% by 2050 — modest demand growth; plan on rents tracking national, not racing it.
Negotiation context
- Only 0 days on market — expect competitive offers; lowballing is unlikely to land.
Questions for the listing agent
- What do current leases actually rent for vs. the listed asking? Can we see a recent rent roll and the last 12 months of T-12 income?
- What does the HOA fee cover, when was the last increase, and are there any pending special assessments or reserve-fund shortfalls?
- Is there a deadline driving the sale (1031 exchange, divorce, estate, relocation)? That informs how much negotiation room exists.
- Schools are D-rated, which usually means shorter tenancies and higher turnover. Who's the typical renter profile here, and what's been the actual vacancy rate?
- The area grade is low — what's the realistic commute time and amenity access for the typical tenant pool here? Any planned neighborhood developments (good or bad) we should know about?
- What's the average days-on-market for RENTAL listings here right now (not sales)? A rising rental-DOM trend means longer vacancies and softer asking-rent achievability than the comps imply.
- What's the recent tenant-quality profile in this submarket — average credit score on applications, eviction rate, late-payment / NSF rate, and stable-employment percentage? A property-management company in the area should have these aggregated.
- How much new for-sale + rental construction is in the pipeline within 1–3 miles? Heavy new supply typically softens prices + rents 12–24 months out; constrained supply supports both.
Investment metrics
- 1% rule
- 0.80% ✗
- Cap rate
- 5.41%
- Cash-on-cash
- -3.14%
- DSCR
- 0.86
- GRM
- 10.4
CMA / ARV
- ARV (on-the-fly)
- $397,727
- Comps found
- 12
Show comp detail 12 sales within ~0.75 mi
| Address | Dist | Beds/Ba | Sqft | Sold | Price | $/sf | Match |
|---|---|---|---|---|---|---|---|
| 208 Myrtle Ln | 0.24mi | 4/2.5 | 1,903 (0%) | 1mo | $413,125 | $217 | 88 |
| 118 Jasmine Ct | 0.52mi | 4/2.5 | 1,903 (0%) | 1mo | $400,000 | $210 | 75 |
| 108 Jasmine Ct | 0.52mi | 4/2.5 | 1,903 (0%) | 2mo | $394,725 | $207 | 74 |
| 115 Pampas St | 0.52mi | 4/2.5 | 1,903 (0%) | 8mo | $385,980 | $203 | 69 |
| 110 Jasmine Ct | 0.52mi | 4/2.0 | 1,903 (0%) | 6mo | $398,365 | $209 | 69 |
| 127 Pampas St | 0.52mi | 3/2.0 (-1) | 1,904 (+0%) | 5mo | $398,385 | $209 | 64 |
| 131 Pampas St | 0.52mi | 3/2.5 (-1) | 1,940 (+2%) | 5mo | $380,870 | $196 | 63 |
| 205 Myrtle Ln | 0.52mi | 4/2.5 | 1,680 (-12%) | 4mo | $375,875 | $224 | 53 |
| 215 Myrtle Ln | 0.13mi | 5/5.5 (+1) | 2,176 (+14%) | 3mo | $416,990 | $192 | 51 |
| 206 Myrtle Ln | 0.52mi | 4/2.0 | 1,658 (-13%) | 3mo | $377,715 | $228 | 49 |
| 235 Myrtle Ln | 0.52mi | 4/2.5 | 2,176 (+14%) | 6mo | $426,705 | $196 | 47 |
| 204 Spencers Ave | 0.52mi | 5/3.0 (+1) | 2,160 (+14%) | 3mo | $285,000 | $132 | 43 |
Match score weights: distance 35% · size 25% · config 20% · recency 20%. Top-matched comps best support the ARV.
Projected returns pro-forma
-0.39% appreciation · 3.0% rent growth · sell at horizon
- IRR
- -7.4%
- Equity multiple
- 0.66×
- Total profit
- $-38,655
- Equity at exit
- $111,483
- IRR
- -1.1%
- Equity multiple
- 0.89×
- Total profit
- $-12,373
- Equity at exit
- $127,788
Cash invested: $115,206 (down + closing). Projections, not guarantees.
Landlord ↔ Tenant lean methodology
- Overall (STATE)
- 85 Strongly Landlord-Friendly
- State North Carolina
- 85 Strongly Landlord-Friendly · R+3
- County
- — inherits STATE
- City
- — inherits STATE
ZIP-level market 27976
- Home prices YoY
- -0.2%
- Active inventory
- 86
- Price-to-rent
- 10.4×
Monthly cashflow live
- Estimated rent
- $3,300 medium interval (Pro) →
- Mortgage (P&I)
- −$2,158
- Tax est. 1.5%
- −$514 /mo · $6,172/yr
- Insurance
- −$171
- HOA
- −$65
- Vacancy / Maint / Mgmt
- −$693
- Net cashflow
- $-301
Break-even live
Sensitivity live
| Price | -10% $-17 | -5% $-159 | +0% $-301 | +5% $-444 | +10% $-586 |
|---|---|---|---|---|---|
| Rent | -10% $-562 | -5% $-432 | +0% $-301 | +5% $-171 | +10% $-41 |
| Rate | -1.0pp $-94 | -0.5pp $-197 | base $-301 | +0.5pp $-408 | +1.0pp $-517 |
UW: 25.0% down · 7.5% · 30yr · 1.5% tax · 5.0% vac · 8.0% maint · 8.0% mgmt
Financing live
Cash to close
- Down payment
- $102,862
- Closing costs
- $12,344
- Reserves months
- —
- Total cash needed
- —
Loan-product check · same deal, 3 products live
Conventional
25% down · 7.5% · 30yr
- Down + closing
- —
- Monthly P&I
- —
- Monthly cashflow
- —
- DSCR
- —
- Eligible?
- —
Personal DTI + credit; lowest rate.
DSCR
20% down · 8.5% · 30yr
- Down + closing
- —
- Monthly P&I
- —
- Monthly cashflow
- —
- DSCR
- —
- Eligible?
- —
No personal income docs; deal must DSCR.
Hard money
10% down · 12.0% · 12mo
- Down + closing
- —
- Monthly P&I
- —
- Monthly cashflow
- —
- DSCR
- —
- Eligible?
- —
Short-term bridge; refi at stabilization.
Rent comps 1 comps
| Address | Beds | Baths | Sqft | Rent | $/sqft | DOM | Units | Dist |
|---|---|---|---|---|---|---|---|---|
| 125 Pampas ST South Mills, NC | 4.0 | 2.5 | 1903 | $3,300 | $1.73 | 3d | 1 | 0.78mi |
HOA detail
- Monthly dues
- $65 · $780/yr
Listing history 2 events
-
2026-05-05$411,450
-
2026-05-05historical
ⓘ Source: listings_history table (triggers on properties + properties_extension) + one-shot
backfill from property_details.listing_events for pre-trigger history.
Nearby sold comps map
Loading sold comps map…
Walkable amenities ~0.75 mi
Loading nearby amenities…
Taxation est. · year 1
- Rental income
- $39,600
- − Mortgage interest
- −$23,048
- − Property taxes
- −$6,172
- − Insurance
- −$2,057
- − Repairs & maintenance
- −$3,168
- − Management
- −$3,168
- − HOA
- −$780
- − Depreciation
- −$11,969
- Taxable loss
- −$10,762
- Est. tax savings @ 24.0%
- +$2,583
- After-tax cash flow
- $-1,034/yr
For passive investors: Depreciation is non-cash, so a rental often shows a tax loss while cash-flowing — sheltering income. Rental losses are passive: they offset passive income freely, and up to $25,000/yr can offset ordinary (W-2) income if you actively participate and your MAGI is under $100k (phasing out to $0 by $150k); unused losses carry forward. On sale, claimed depreciation is recaptured at up to 25%, and gains may owe capital-gains tax (a 1031 exchange can defer both). Figures are a year-1 estimate at your 24.0% rate — not tax advice; consult a CPA.
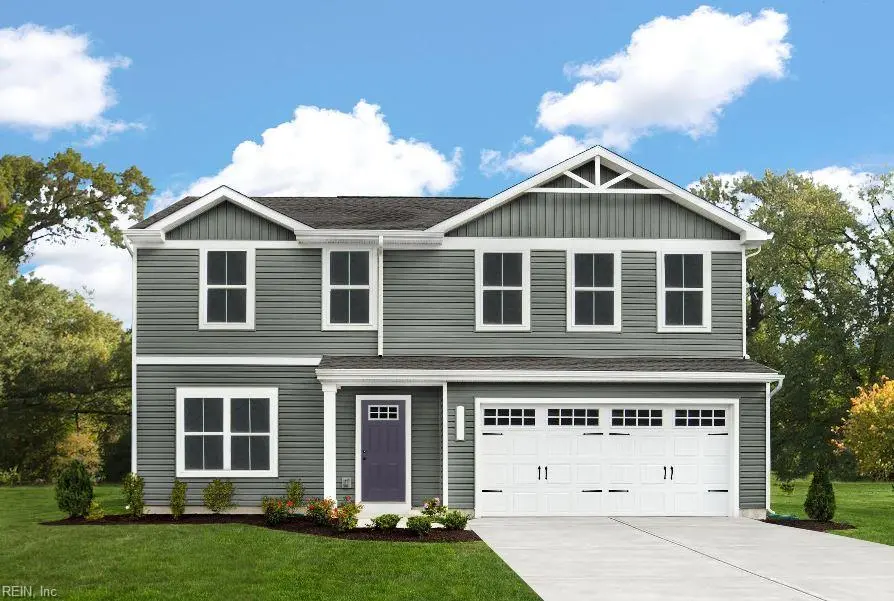
Condition & rehab AI · 1 photo
This home is in excellent condition with no visible repairs needed. It is move-in ready and would benefit from a fresh coat of paint and some landscaping to further enhance its curb appeal.
Value-add opportunities
- Both Painting — Fresh paint can enhance curb appeal and interior aesthetics
- Both Landscaping — Enhances curb appeal and can increase property value
- Both Interior cleaning — A clean interior can attract more buyers and renters
Renovation cost estimate screening
Value-add ROI direction
- Both Painting — Fresh paint can enhance curb appeal and interior aesthetics ↑
- Both Landscaping — Enhances curb appeal and can increase property value ↑
- Both Interior cleaning — A clean interior can attract more buyers and renters ↑
ⓘ Cost ranges are severity-bucket heuristics (US national rule-of-thumb). Get contractor quotes + a written scope before underwriting a rehab budget.
Schools (NCES district)
- District
- Camden County Schools
- NCES district ID
- 3700600
- Math proficiency
- 56% ▲ 8.00%
- Reading proficiency
- 64% ▲ 4.00%
- Median HH income
- $59,622
- Composite
- 51.97/100
- National rank
- #1643
- State rank
- #29 of 178 in NC
Livability — South Mills
- Score
- 57/100
- State rank
- #612
- US rank
- #22229
Category grades
Schools grade is shown separately in the Schools card above.
Census & demographics
- Census place
- South Mills, NC
- Population (ZIP)
- 4,237
Population outlook (Camden County) Hauer SSP2
- Today (2025)
- 10,980 people
- By 2030
- 11,246 · +2.4%
- By 2040
- 11,562 · +5.3%
- By 2050
- 11,572 · +5.4%
- By 2075
- 11,450 · +4.3%
- By 2100
- 10,648 · -3.0%
Race, ethnicity, and origin ACS 2023
- Neighborhood character
- Predominantly White (79%)
- Race & ethnicity
- White 79% Two or more races 8% Black 8% Hispanic / Latino 6%
- Hispanic origin (detail)
- Mexican 2% Puerto Rican 1%
- Common ancestry
- Scotch-Irish 4% Portuguese 3% Romanian 3%
- Languages at home
- 98% English-only · Arabic 1%
Political lean MEDSL · Camden
- 2024 margin
- Solid R (+50.8) · D 24.2% · R 75.0%
- 2008→2024 swing
- -18.8pp toward R · 2008: -32.0pp · 2024: -50.8pp
- All cycles
- 2024: R+50.8 2020: R+46.6 2016: R+45.8 2012: R+34.0 2008: R+32.0
Not yet ingested
- Civics
- —
Market trends
- HPI YoY
- ▼ -0.39%
- Current HPI
- 174.2102
- Rent YoY
- —
- Metro
- —
- State GDP YoY
- ▲ 3.28%
- F500 in state
- 26
Industry mix (Fortune 500 HQ in NC)
| Industry | F500 HQs | Revenue |
|---|---|---|
| Financial Services | 2 | $213B |
|
||
| Retail | 2 | $95B |
|
||
| Industrial Conglomerate | 1 | $38B |
|
||
| Metals / Steel | 1 | $35B |
|
||
| Utilities | 1 | $30B |
|
||
| Industrial Machinery | 1 | $19B |
|
||
Price history
2 events — show timeline
- 2026-05-05 Listing Removed — REINMLS
- 2026-05-05 Listed $411,450 REINMLS
Cash-flow waterfall
monthlySold comps — $/sqft
last 12 mo · ≤1 miLoading sold comps…