 🏷️ Likely Rental
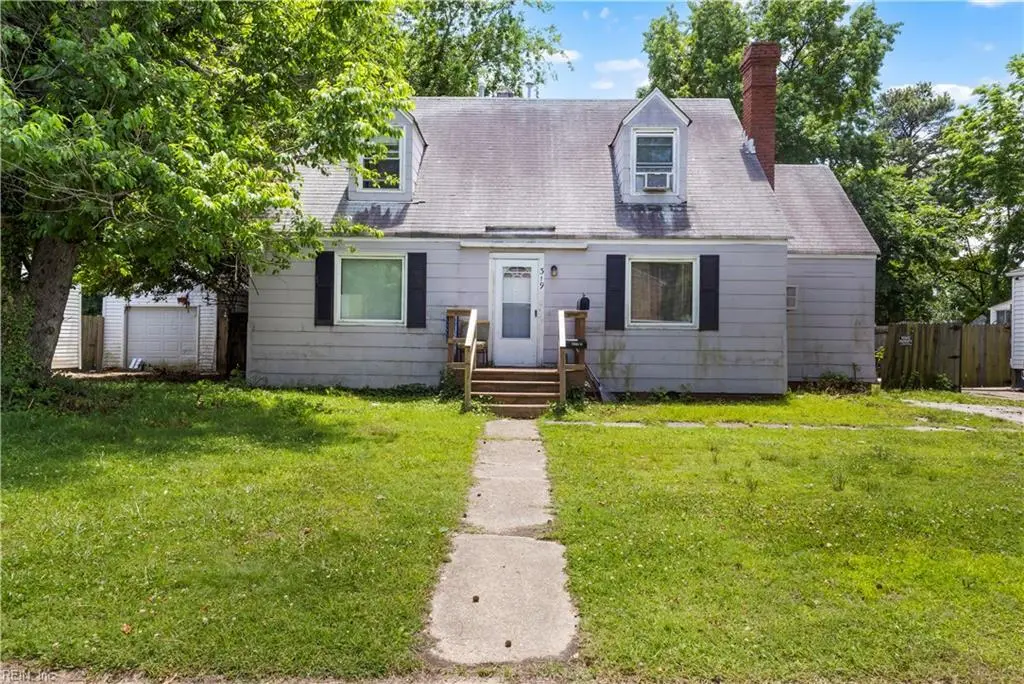
319 Ashlawn Dr · Norfolk, VA
Flood risk 1/10 · Minimal
- FEMA flood zone
- X (unshaded)
- Chance of flooding over 30 yrs
- 0.0%
- Est. flood insurance / yr
- $507 – $1,088
Fire risk 1/10 · Minimal
- Est. fire insurance / yr
- $666 – $1,236
Heat risk 9/10 · Severe
- Hot days now (above 104°F)
- 7 days/yr
- Hot days in 30 yrs
- 16 days/yr
Wind risk 8/10 · Major
- Chance of severe wind over 30 yrs
- 80.0%
Air-quality risk 3/10 · Minor
- Unhealthy air days now
- 2 days/yr
- Unhealthy air days in 30 yrs
- 5 days/yr
Risk factors via First Street. Map © Google.
Why this score? — see what drove the C+ grade
The composite is a weighted blend of 9 inputs, each scored 0–100. Each bar is that input's sub-score; the figure is the points it added to the 100-point composite (weight × sub-score).
- Cash flow +21.3/30.0
- ARV discount +15.0/15.0
- DSCR +6.8/10.0
- 1% rule +5.3/10.0
- Rent growth +5.0/5.0
- Livability +4.2/5.0
- Schools +3.5/10.0
- Condition / age +2.5/5.0
- Appreciation +0.0/10.0
$250,000
🖨 Deal sheet 📄 Offer letter ✓ Due diligence
Multi-family units
County records classify this as Multi-Family (2-4 Unit). Listing-text estimate: 1 unit. estimate disagrees with records
Listing remarks MLS
Turnkey investment opportunity with immediate income potential. This under-over Cape Cod is tenant occupied and offers built-in cash flow from day one. The first-floor unit features 2 bedrooms, 1 bath, and approx. 1,000 sqft. while the upstairs unit offers 1 Bedroom and 1 Bath, creating a strong rental setup for investors looking to expand their portfolio. With existing tenants in place, this property offers the advantage of steady income and reduced vacancy concerns. Whether you are a seasoned investor or looking to start building wealth through real estate, this property checks the boxes for value, functionality, and income production. Don’t miss your chance to add a solid income-producing property to your portfolio. Schedule your showing today and explore the potential this investment has to offer.
Key facts
- Built 1942
- Listed 71 days
Neighborhood map
What this means for you Summary
Snapshot
- This is a 3-bed/2.0-bath multifamily listed at $250k.
Deal economics
- At list price, monthly cash flow is $368 ($4k/yr) — positive.
- The deal already cash-flows at list — no discount required.
- Meets the 1% rule at list price ($3k rent vs $250k).
- Recommended offer: $235k (6.0% below list) — sets the bar for market timing.
- Cap rate 8.1% vs local median 4.0% in Norfolk — top-decile yield for the area; either an underpriced asset or a hidden risk that comps aren't pricing in. Stress-test before assuming the spread holds.
Location & tenants
- Location reads 83/100 on livability (#43 in VA, #1,026 nationally) — a professional / high-income tenant draw. Strengths: amenities A+, commute A+, health & safety A+; Watch: employment C-, crime F.
- Norfolk City Public School District (urban): math 27% / reading 56% proficiency, ranked #118 of 131 in VA (top 90%) — families likely to look elsewhere, expect single-tenant / working-renter base with shorter leases.
- Market conditions: Rents rising fast (+12.1%/yr); 106 active listings in the ZIP; 28 comparable units currently listed for rent nearby; rentals at typical pace (median 24d on market — plan ~3-4 weeks tenant-placement turnaround); 438 units permitted in Norfolk city in 2024 (273 in 5+ unit buildings).
- At $2,575/mo this rent would consume 53% of the median local household income ($59k/yr) (locally 2299% of renters already pay >50% of income on rent) — very limited rent-growth headroom before tenants either downsize or default.
Forward outlook
- Local home prices are declining (-3.0%/yr); year-one equity from $2k of loan paydown is wiped out by about $8k of value loss. Plan a longer hold.
- At projected returns (-3.0% appreciation + 8.0% rent growth), your $70k cash investment doubles in ~9 years — after that, you're playing with house money.
Negotiation context
- It's been on market 71 days — a 6% lower offer ($235k) is reasonable based on typical stale-listing flexibility.
- 6 sale attempts since 11y ago with the ask held roughly flat each time — persistent listings suggest the price (not the market) is what's stuck; bring a comps-based counter.
- Current owner paid $128k; list at $250k implies a 95% gain — meaningful room to come down on a strong offer.
Risks & watch-outs
- Watch-outs: built in 1942 — expect roof / HVAC / electrical / plumbing capex.
- Climate carrying-cost: severe wind risk, 80% chance of damaging wind over 30y; extreme-heat days projected 7→16/yr by 2055 (HVAC capex compounding) — expect insurance premiums to compound above CPI over the hold.
Questions for the listing agent
- It's been on market 71 days. Have you received any prior offers? Is the seller open to a 6% concession, seller financing, or rate buy-down credit?
- Built in 1942 — when were the roof, HVAC, electrical panel, plumbing, and water heater last replaced?
- Why hasn't it sold? Are there any deal-killer items the seller is aware of (foundation, flood, title, zoning, code violations)?
- Is there a deadline driving the sale (1031 exchange, divorce, estate, relocation)? That informs how much negotiation room exists.
- Schools are A-rated — typically a magnet for longer-tenancy family renters. What's the average tenant stay here, and is there a school-zone premium baked into asking?
- Crime grade is F in this area — have there been break-ins, vandalism, or insurance claims at this property in the last 3 years? What carrier currently insures it and at what premium?
- What's the average days-on-market for RENTAL listings here right now (not sales)? A rising rental-DOM trend means longer vacancies and softer asking-rent achievability than the comps imply.
- What's the recent tenant-quality profile in this submarket — average credit score on applications, eviction rate, late-payment / NSF rate, and stable-employment percentage? A property-management company in the area should have these aggregated.
- How much new apartment / multifamily construction is in the pipeline within 1–3 miles? Heavy new supply (>2% of stock underway) typically softens rents 12–24 months out; light construction supports rent growth.
Investment metrics
- 1% rule
- 1.03% ✓
- Cap rate
- 8.06%
- Cash-on-cash
- 6.30%
- DSCR
- 1.28
- GRM
- 8.1
CMA / ARV
- ARV (median comp)
- $318,338
- List price
- $250,000
- Delta
- -21.47%
- Verdict
- UNDERPRICED
- Comps
- 8 within 2.0 mi
Projected returns pro-forma
-3.0% appreciation · 8.0% rent growth · sell at horizon
- IRR
- -1.2%
- Equity multiple
- 0.95×
- Total profit
- $-3,481
- Equity at exit
- $37,276
- IRR
- 13.0%
- Equity multiple
- 2.27×
- Total profit
- $89,069
- Equity at exit
- $21,615
Cash invested: $70,000 (down + closing). Projections, not guarantees.
Landlord ↔ Tenant lean methodology
- Overall (STATE)
- 55 Moderately Landlord-Leaning
- State Virginia
- 55 Moderately Landlord-Leaning · D+2
- County
- — inherits STATE
- City
- — inherits STATE
ZIP-level market 23505
- Home prices YoY
- -19.6%
- Rents YoY
- 12.1%
- Active inventory
- 106
- Price-to-rent
- 15.6×
Monthly cashflow live
- Estimated rent
- $2,575 high interval (Pro) →
- Mortgage (P&I)
- −$1,311
- Tax from tax record
- −$251 /mo · $3,016/yr
- Insurance
- −$104
- HOA
- −$0
- Vacancy / Maint / Mgmt
- −$541
- Net cashflow
- $368
Break-even live
2-unit breakdown (identical units grouped — click to expand)
| Units | Beds | Baths | Est. rent |
|---|---|---|---|
| 1× unit | 2 | 1 | $1,335 |
| 1× unit | 1 | 1 | $1,240 |
| Total (2 units) | $2,575 | ||
UW: 25.0% down · 7.5% · 30yr · 1.5% tax · 5.0% vac · 8.0% maint · 8.0% mgmt
Financing live
Cash to close
- Down payment
- $62,500
- Closing costs
- $7,500
- Reserves months
- —
- Total cash needed
- —
Loan-product check · same deal, 3 products live
Conventional
25% down · 7.5% · 30yr
- Down + closing
- —
- Monthly P&I
- —
- Monthly cashflow
- —
- DSCR
- —
- Eligible?
- —
Personal DTI + credit; lowest rate.
DSCR
20% down · 8.5% · 30yr
- Down + closing
- —
- Monthly P&I
- —
- Monthly cashflow
- —
- DSCR
- —
- Eligible?
- —
No personal income docs; deal must DSCR.
Hard money
10% down · 12.0% · 12mo
- Down + closing
- —
- Monthly P&I
- —
- Monthly cashflow
- —
- DSCR
- —
- Eligible?
- —
Short-term bridge; refi at stabilization.
Rent comps 28 comps
| Address | Beds | Baths | Sqft | Rent | $/sqft | DOM | Units | Dist |
|---|---|---|---|---|---|---|---|---|
| 408 E Little Creek Rd Norfolk, VA | 3.0 | 2.0 | 1224 | $2,200 | $1.80 | 43d | 1 | 0.13mi |
| 8018 W Glen Rd Norfolk, VA | 4.0 | 2.5 | 1700 | $2,650 | $1.56 | 43d | 1 | 0.18mi |
| 405 San Antonio Blvd Norfolk, VA | 4.0 | 2.5 | 2200 | $2,600 | $1.18 | 12d | 1 | 0.27mi |
| 8065 W Glen Rd Norfolk, VA | 4.0 | 2.0 | 1519 | $2,350 | $1.55 | 2d | 1 | 0.33mi |
| 7922 Old Ocean View Rd Norfolk, VA | 1.0–3.0 | 1.0–1.5 | 890 | $1,300 | $1.46 | 1d | 3 | 0.68mi |
| 8107 Old Ocean View Rd Norfolk, VA | 4.0 | 1.0 | 1562 | $2,095 | $1.34 | 17d | 1 | 0.74mi |
| 218 Granby Park Dr Unit B Norfolk, VA | 3.0 | 1.0 | 1330 | $1,795 | $1.35 | 4d | 1 | 0.86mi |
| 218 Granby Park Dr Unit B Norfolk, VA | 3.0 | 1.0 | 1330 | $1,695 | $1.27 | 3d | 1 | 0.86mi |
| 218 Granby Park Dr Unit B Norfolk, VA | 3.0 | 1.0 | 1330 | $1,745 | $1.31 | 12d | 1 | 0.86mi |
| 756 Norman Ave Norfolk, VA | 3.0 | 1.0 | 1500 | $1,875 | $1.25 | 21d | 1 | 0.92mi |
| 314 N Shore Rd Unit A Norfolk, VA | 3.0 | 2.5 | 1600 | $2,000 | $1.25 | 43d | 1 | 0.95mi |
| 7120 Clarion Ln Norfolk, VA | 4.0 | 2.0 | 1506 | $2,300 | $1.53 | 17d | 1 | 0.95mi |
| 8028 Glade Rd Norfolk, VA | 4.0 | 2.5 | 2061 | $2,900 | $1.41 | 43d | 1 | 1.03mi |
| 8507 Chapin St Norfolk, VA | 4.0 | 2.0 | 1550 | $2,400 | $1.55 | 43d | 1 | 1.05mi |
| 946 Avenue H Norfolk, VA | 4.0 | 2.0 | 1980 | $750 | $0.38 | 43d | 1 | 1.07mi |
| 8634 Granby St Norfolk, VA | 3.0 | 2.0 | 1500 | $1,950 | $1.30 | 17d | 1 | 1.13mi |
| 837 Tifton St Norfolk, VA | 3.0 | 2.0 | 1072 | $2,300 | $2.15 | 23d | 1 | 1.14mi |
| 514 Burleigh Ave Norfolk, VA | 4.0 | 2.0 | 1708 | $2,300 | $1.35 | 23d | 1 | 1.18mi |
| 941 Avenue G Unit G Norfolk, VA | 4.0 | 2.5 | 2029 | $2,600 | $1.28 | 3d | 1 | 1.19mi |
| 7730 Ruthven Rd Norfolk, VA | 3.0 | 1.0 | 1056 | $1,750 | $1.66 | 23d | 1 | 1.27mi |
| 8504 Chesapeake Blvd Norfolk, VA | 3.0 | 4.0 | 2053 | $2,800 | $1.36 | 43d | 1 | 1.31mi |
| 7803 Nesbitt Dr Norfolk, VA | 4.0 | 2.0 | 1503 | $2,495 | $1.66 | 17d | 1 | 1.35mi |
| 1214 Frank St Norfolk, VA | 3.0 | 2.0 | 1250 | $2,300 | $1.84 | 12d | 1 | 1.37mi |
| 619 Earl St Norfolk, VA | 4.0 | 2.0 | 1428 | $2,395 | $1.68 | 43d | 1 | 1.40mi |
| 7872 Ogden Ave Norfolk, VA | 1.0–3.0 | 1.0–2.0 | 963 | $1,515 | $1.57 | 43d | 1 | 1.41mi |
| 121 Winshire St Norfolk, VA | 3.0 | 2.0 | 1440 | $2,200 | $1.53 | 43d | 1 | 1.45mi |
| 614 Dune St #2 Norfolk, VA | 2.0 | 1.0 | 1350 | $1,400 | $1.04 | 43d | 1 | 1.45mi |
| 8918 Granby St Norfolk, VA | 3.0 | 2.0 | 1201 | $1,850 | $1.54 | 4d | 1 | 1.47mi |
Listing history 32 events
-
2026-06-18days on market $250,000 Active 71 DOM
-
2026-06-17days on market $250,000 Active 70 DOM
-
2026-06-16days on market $250,000 Active 69 DOM
-
2026-06-15days on market $250,000 Active 68 DOM
-
2026-06-13days on market $250,000 Active 66 DOM
-
2026-06-09days on market $250,000 Active 62 DOM
-
2026-06-08days on market $250,000 Active 61 DOM
-
2026-06-07days on market $250,000 Active 60 DOM
-
2026-06-03days on market $250,000 Active 56 DOM
-
2026-06-02days on market $250,000 Active 55 DOM
-
2026-06-01days on market $250,000 Active 54 DOM
-
2026-05-31days on market $250,000 Active 53 DOM
-
2026-04-08$250,000 Active 818-char remark
Show marketing remark (818 chars)
Turnkey investment opportunity with immediate income potential. This under-over Cape Cod is tenant occupied and offers built-in cash flow from day one. The first-floor unit features 2 bedrooms, 1 bath, and approx. 1,000 sqft. while the upstairs unit offers 1 Bedroom and 1 Bath, creating a strong rental setup for investors looking to expand their portfolio. With existing tenants in place, this property offers the advantage of steady income and reduced vacancy concerns. Whether you are a seasoned investor or looking to start building wealth through real estate, this property checks the boxes for value, functionality, and income production. Don’t miss your chance to add a solid income-producing property to your portfolio. Schedule your showing today and explore the potential this investment has to offer.
-
2025-12-31historical
-
2025-09-29price $260,000
-
2025-09-12price $265,000
-
2025-08-14price $270,000
-
2025-06-26$285,000 Active
-
2017-11-17soldstatus $128,000
-
2017-11-16status Under Contract
-
2017-09-18price $129,000
-
2017-05-18$139,000 Active
-
2016-10-31historical
-
2016-08-12price $135,000
-
2016-06-16$139,900 Active
-
2016-01-24historical
-
2015-09-25price $144,900
-
2015-09-25$151,600 Active
-
2015-08-31historical
-
2015-05-11price $149,900
-
2015-04-16$151,600 Active
-
1978-02-03soldstatus $27,700
ⓘ Source: listings_history table (triggers on properties + properties_extension) + one-shot
backfill from property_details.listing_events for pre-trigger history.
Tax reassessment forecast VA · Resets to sale price
- Current annual tax
- $3,016 · $251/mo
- Projected year-2 tax
- $3,016 · $251/mo
- Expected delta
- $0/yr ($0/mo · 0.0%)
ⓘ Screening estimate from a state-policy table — verify with the county assessor before closing.
Climate risk First Street
- Flood 1/10 Low FEMA zone X (unshaded) · 0% chance over 30 yrs
- Wildfire 1/10 Low
- Heat 9/10 Extreme 7 d/yr ≥104°F today · 16 d/yr by 30 yrs out
- Wind 8/10 Severe 80% chance of damaging wind over 30 yrs
- Air quality 3/10 Moderate 2 unhealthy d/yr today · 5 by 30 yrs out
Nearby sold comps map
Loading sold comps map…
Walkable amenities ~0.75 mi
Loading nearby amenities…
Taxation est. · year 1
- Rental income
- $30,900
- − Mortgage interest
- −$14,004
- − Property taxes
- −$3,016
- − Insurance
- −$1,250
- − Repairs & maintenance
- −$2,472
- − Management
- −$2,472
- − Depreciation
- −$7,273
- Taxable income
- $413
- Est. tax owed @ 24.0%
- −$99
- After-tax cash flow
- $4,313/yr
For passive investors: Depreciation is non-cash, so a rental often shows a tax loss while cash-flowing — sheltering income. Rental losses are passive: they offset passive income freely, and up to $25,000/yr can offset ordinary (W-2) income if you actively participate and your MAGI is under $100k (phasing out to $0 by $150k); unused losses carry forward. On sale, claimed depreciation is recaptured at up to 25%, and gains may owe capital-gains tax (a 1031 exchange can defer both). Figures are a year-1 estimate at your 24.0% rate — not tax advice; consult a CPA.
Schools (NCES district)
- District
- Norfolk City Public School District
- NCES district ID
- 5102670
- Math proficiency
- 27% ▼ -44.00%
- Reading proficiency
- 56% ▼ -10.00%
- Median HH income
- $44,358
- Composite
- 35.08/100
- National rank
- #5026
- State rank
- #118 of 131 in VA
Livability — Norfolk
- Score
- 83/100
- State rank
- #43
- US rank
- #1026
Category grades
Schools grade is shown separately in the Schools card above.
Census & demographics
- Census place
- Norfolk, VA
- County
- Norfolk City · 214,042 people
- City population
- 214,042
- Metro
- Virginia Beach-Norfolk-Newport News, VA-NC
- Population (ZIP)
- 28,247
- Household income
- $58,579
- Rent vs Own
- Severe rent burden
- 2299.0
Population outlook (Norfolk County) Hauer SSP2
- Today (2025)
- 249,032 people
- By 2030
- 252,347 · +1.3%
- By 2040
- 253,644 · +1.9%
- By 2050
- 251,913 · +1.2%
- By 2075
- 245,281 · -1.5%
- By 2100
- 219,548 · -11.8%
Race, ethnicity, and origin ACS 2023
- Neighborhood character
- Diverse neighborhood (Simpson 0.67)
- Race & ethnicity
- White 44% Black 34% Hispanic / Latino 12% Two or more races 8% Asian 4%
- Hispanic origin (detail)
- Mexican 4% Puerto Rican 3%
- Common ancestry
- Romanian 2% Slovak 2% Italian 2%
- Foreign-born
- 9% · Canada, United Kingdom, South Korea
- Languages at home
- 87% English-only · Spanish 6% Tagalog/Filipino 1% French/Haitian/Cajun 1%
Political lean MEDSL · Norfolk
- 2024 margin
- Solid D (+41.5) · D 70.0% · R 28.5% · Other 1.6%
- 2008→2024 swing
- -1.4pp toward R · 2008: 43.0pp · 2024: 41.5pp
- All cycles
- 2024: D+41.5 2020: D+45.6 2016: D+42.0 2012: D+44.0 2008: D+43.0
Not yet ingested
- Civics
- —
Market trends
- HPI YoY
- ▼ -71.86%
- Current HPI
- 294.9807
- Rent YoY
- ▲ 12.08%
- Metro
- Virginia Beach-Norfolk-Newport News, VA-NC
- State GDP YoY
- ▲ 2.40%
- F500 in state
- 50
Industry mix (Fortune 500 HQ in VA)
| Industry | F500 HQs | Revenue |
|---|---|---|
| Aerospace / Defense | 4 | $236B |
|
||
| Technology / Defense | 3 | $32B |
|
||
| Financial Services | 2 | $176B |
|
||
| Utilities | 2 | $27B |
|
||
| Insurance | 2 | $25B |
|
||
| Technology | 2 | $15B |
|
||
Price history
+802.5% since first listed20 events — show timeline
- 2026-04-08 Listed $250,000 REINMLS
- 2025-12-31 Listing Removed — REINMLS
- 2025-09-29 Price Changed $260,000 REINMLS
- 2025-09-12 Price Changed $265,000 REINMLS
- 2025-08-14 Price Changed $270,000 REINMLS
- 2025-06-26 Listed $285,000 REINMLS
- 2017-11-17 Sold (Public Records) $128,000 Public Records
- 2017-11-16 Pending — REINMLS
- 2017-09-18 Price Changed $129,000 REINMLS
- 2017-05-18 Listed $139,000 REINMLS
- 2016-10-31 Listing Removed — REINMLS
- 2016-08-12 Price Changed $135,000 REINMLS
- 2016-06-16 Listed $139,900 REINMLS
- 2016-01-24 Listing Removed — REINMLS
- 2015-09-25 Price Changed $144,900 REINMLS
- 2015-09-25 Listed $151,600 REINMLS
- 2015-08-31 Listing Removed — REINMLS
- 2015-05-11 Price Changed $149,900 REINMLS
- 2015-04-16 Listed $151,600 REINMLS
- 1978-02-03 Sold (Public Records) $27,700 Public Records
Property tax history
+3.9%/yrLatest (2025): $3,016 · +10.5% YoY. Source: county tax records.
Cash-flow waterfall
monthlySold comps — $/sqft
last 12 mo · ≤1 miLoading sold comps…