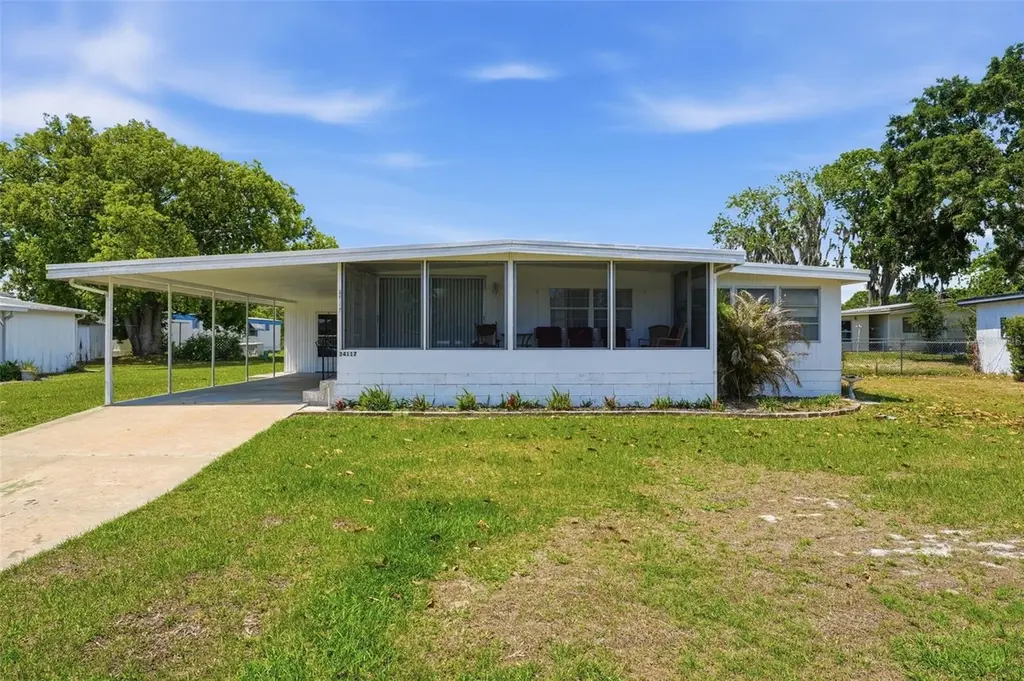
34117 Hodges Rd · Leesburg, FL
Flood risk 1/10 · Minimal
- FEMA flood zone
- X (unshaded)
- Chance of flooding over 30 yrs
- 0.0%
- Est. flood insurance / yr
- $507 – $1,088
Fire risk 4/10 · Minor
- Est. fire insurance / yr
- $947 – $1,759
Heat risk 9/10 · Severe
- Hot days now (above 107°F)
- 7 days/yr
- Hot days in 30 yrs
- 23 days/yr
Wind risk 9/10 · Severe
- Chance of severe wind over 30 yrs
- 99.0%
Air-quality risk 2/10 · Minimal
- Unhealthy air days now
- 1 days/yr
- Unhealthy air days in 30 yrs
- 1 days/yr
Risk factors via First Street. Map © Google.
Why this score? — see what drove the C+ grade
The composite is a weighted blend of 9 inputs, each scored 0–100. Each bar is that input's sub-score; the figure is the points it added to the 100-point composite (weight × sub-score).
- Cash flow +27.5/30.0
- DSCR +9.6/10.0
- ARV discount +7.5/15.0
- 1% rule +7.1/10.0
- Schools +4.2/10.0
- Livability +3.1/5.0
- Rent growth +2.5/5.0
- Condition / age +2.5/5.0
- Appreciation +0.0/10.0
$165,500
🖨 Deal sheet 📄 Offer letter ✓ Due diligence
Listing remarks MLS
Well kept 2 bed / 2 bath 'double wide' ready to move in. Two storage sheds with workshop. Nice screened Florida room / lanai to enjoy the outdoors. This one is 'Price to sell' so come have a look.
Key facts
- Screened front porch
- Quiet neighborhood
- 7,853 sq ft lot
Tags
Property features AI
Finance
- Other: Furnished; Lot approximately 0.18 acre (75 x 107); Zoning: RM; Directions available
- HOA & community: No association
Exterior
- Parking: Covered driveway; 2-space carport
- Utilities: Public water; Septic tank; Cable connected; Electricity connected; Water connected
- Home design: Residential mobile home (double wide); Single-story; East-facing entry
- Construction: Vinyl siding with frame construction; Metal roof; Roof over; Crawlspace foundation; Built/estimated total building area ~1532 sq ft
- Exterior features: Covered, screened front porch; Patio/porch is covered and screened; Private mailbox; Rain gutters; Sliding doors; Paved lot in county
Interior
- Kitchen: Dishwasher; Range; Microwave; Refrigerator; Electric water heater
- Bedrooms: 2 bedrooms
- Flooring: Carpet; Ceramic tile; Vinyl; Wood
- Bathrooms: 2 full bathrooms
- Heating & cooling: Central heating (heat pump); Central air conditioning
- Interior features: Built-in features; Ceiling fans; Window treatments; Florida room
- Laundry & utility: Washer; Dryer; Laundry in garage
Neighborhood map
What this means for you Summary
Snapshot
- This is a 3-bed/2.0-bath manufactured listed at $166k.
Deal economics
- At list price, monthly cash flow is $490 ($6k/yr) — positive.
- The deal already cash-flows at list — no discount required.
- Meets the 1% rule at list price ($2k rent vs $166k).
- Recommended offer: $163k (1.5% below list) — sets the bar for market timing.
- Cap rate 9.8% vs local median 4.5% in Leesburg — top-decile yield for the area; either an underpriced asset or a hidden risk that comps aren't pricing in. Stress-test before assuming the spread holds.
Location & tenants
- Location reads 62/100 on livability (#751 in FL) — a middle-class / working-renter tenant base. Strengths: cost of living A+, housing A+; Watch: crime D, amenities F, commute F.
- Lake (suburban): math 49% / reading 50% proficiency, ranked #37 of 73 in FL (top 51%) — families likely to look elsewhere, expect single-tenant / working-renter base with shorter leases.
- Zoned schools: Treadway Elementary School (math 53% / reading 48%, grade D+, #1,055 of 2,144 statewide, top 50%, 879 students, 66% FRL); Leesburg High School (math 24% / reading 32%, grade F, #464 of 667 statewide, top 70%, 1,641 students, 58% FRL).
- Market conditions: 285 active listings in the ZIP; 1 comparable units currently listed for rent nearby; 4,799 units permitted in Lake County in 2024 (814 in 5+ unit buildings).
- This rent runs 44% of the median local income ($54k/yr) — at the standard rent-burdened threshold; future hikes will face affordability resistance.
Forward outlook
- Local home prices are declining (-3.0%/yr); year-one equity from $1k of loan paydown is wiped out by about $5k of value loss. Plan a longer hold.
- Lake County population projected at +37% by 2050 — long-run rental-demand tailwind backs the buy-and-hold thesis.
- At projected returns (-3.0% appreciation + 3.0% rent growth), your $46k cash investment doubles in ~9 years — after that, you're playing with house money.
Negotiation context
- It's been on market 25 days — a 2% lower offer ($163k) is reasonable based on typical stale-listing flexibility.
- 5 sale attempts since 18y ago with the ask held roughly flat each time — persistent listings suggest the price (not the market) is what's stuck; bring a comps-based counter.
- Current owner paid $48k; list at $166k implies a 248% gain — meaningful room to come down on a strong offer.
Risks & watch-outs
- Climate carrying-cost: severe wind risk, 99% chance of damaging wind over 30y; extreme-heat days projected 7→23/yr by 2055 (HVAC capex compounding) — expect insurance premiums to compound above CPI over the hold.
Questions for the listing agent
- Built in 1971 — when were the roof, HVAC, electrical panel, plumbing, and water heater last replaced?
- Is there a deadline driving the sale (1031 exchange, divorce, estate, relocation)? That informs how much negotiation room exists.
- Schools are D-rated, which usually means shorter tenancies and higher turnover. Who's the typical renter profile here, and what's been the actual vacancy rate?
- Crime grade is D in this area — have there been break-ins, vandalism, or insurance claims at this property in the last 3 years? What carrier currently insures it and at what premium?
- What's the average days-on-market for RENTAL listings here right now (not sales)? A rising rental-DOM trend means longer vacancies and softer asking-rent achievability than the comps imply.
- What's the recent tenant-quality profile in this submarket — average credit score on applications, eviction rate, late-payment / NSF rate, and stable-employment percentage? A property-management company in the area should have these aggregated.
- How much new for-sale + rental construction is in the pipeline within 1–3 miles? Heavy new supply typically softens prices + rents 12–24 months out; constrained supply supports both.
Investment metrics
- 1% rule
- 1.21% ✓
- Cap rate
- 9.85%
- Cash-on-cash
- 12.69%
- DSCR
- 1.56
- GRM
- 6.9
CMA / ARV
No comps found within radius.
Projected returns pro-forma
-3.0% appreciation · 3.0% rent growth · sell at horizon
- IRR
- 2.5%
- Equity multiple
- 1.09×
- Total profit
- $4,379
- Equity at exit
- $24,677
- IRR
- 12.0%
- Equity multiple
- 1.95×
- Total profit
- $43,971
- Equity at exit
- $14,309
Cash invested: $46,340 (down + closing). Projections, not guarantees.
Landlord ↔ Tenant lean methodology
- Overall (STATE)
- 87 Strongly Landlord-Friendly
- State Florida
- 87 Strongly Landlord-Friendly · R+3
- County
- — inherits STATE
- City
- — inherits STATE
ZIP-level market 34788
- Home prices YoY
- -18.2%
- Active inventory
- 285
- Price-to-rent
- 6.9×
Monthly cashflow live
- Estimated rent
- $1,996 medium interval (Pro) →
- Mortgage (P&I)
- −$868
- Tax from tax record
- −$150 /mo · $1,801/yr
- Insurance
- −$69
- HOA
- −$0
- Vacancy / Maint / Mgmt
- −$419
- Net cashflow
- $490
Break-even live
UW: 25.0% down · 7.5% · 30yr · 1.5% tax · 5.0% vac · 8.0% maint · 8.0% mgmt
Financing live
Cash to close
- Down payment
- $41,375
- Closing costs
- $4,965
- Reserves months
- —
- Total cash needed
- —
Loan-product check · same deal, 3 products live
Conventional
25% down · 7.5% · 30yr
- Down + closing
- —
- Monthly P&I
- —
- Monthly cashflow
- —
- DSCR
- —
- Eligible?
- —
Personal DTI + credit; lowest rate.
DSCR
20% down · 8.5% · 30yr
- Down + closing
- —
- Monthly P&I
- —
- Monthly cashflow
- —
- DSCR
- —
- Eligible?
- —
No personal income docs; deal must DSCR.
Hard money
10% down · 12.0% · 12mo
- Down + closing
- —
- Monthly P&I
- —
- Monthly cashflow
- —
- DSCR
- —
- Eligible?
- —
Short-term bridge; refi at stabilization.
Rent comps 1 comps
| Address | Beds | Baths | Sqft | Rent | $/sqft | DOM | Units | Dist |
|---|---|---|---|---|---|---|---|---|
| 35229 Orange Grove Ln Leesburg, FL | 2.0 | 1.0 | 1194 | $1,400 | $1.17 | 24d | 1 | 1.15mi |
Listing history 14 events
-
2026-05-07status Pending
-
2026-04-12$165,500 Active
-
2017-12-28soldstatus $47,500 Sold 196-char remark
Show marketing remark (196 chars)
Well kept 2 bed / 2 bath 'double wide' ready to move in. Two storage sheds with workshop. Nice screened Florida room / lanai to enjoy the outdoors. This one is 'Price to sell' so come have a look.
-
2017-12-28soldstatus $47,500
Show marketing remark (196 chars)
Well kept 2 bed / 2 bath 'double wide' ready to move in. Two storage sheds with workshop. Nice screened Florida room / lanai to enjoy the outdoors. This one is 'Price to sell' so come have a look.
-
2017-11-03status Pending 196-char remark
Show marketing remark (196 chars)
Well kept 2 bed / 2 bath 'double wide' ready to move in. Two storage sheds with workshop. Nice screened Florida room / lanai to enjoy the outdoors. This one is 'Price to sell' so come have a look.
-
2017-10-24$47,500 Active 196-char remark
Show marketing remark (196 chars)
Well kept 2 bed / 2 bath 'double wide' ready to move in. Two storage sheds with workshop. Nice screened Florida room / lanai to enjoy the outdoors. This one is 'Price to sell' so come have a look.
-
2014-03-19soldstatus $36,000 Sold 176-char remark
Show marketing remark (176 chars)
This 2/2 double wide home is in excellent condition. Turn Key furnished with nice furniture, 2 sheds, washer/ dryer and a workshop. Nice Florida Room and Lanai. PRICED TO SELL.
-
2014-01-01$44,900 176-char remark
Show marketing remark (176 chars)
This 2/2 double wide home is in excellent condition. Turn Key furnished with nice furniture, 2 sheds, washer/ dryer and a workshop. Nice Florida Room and Lanai. PRICED TO SELL.
-
2012-03-22soldstatus $48,000
-
2010-03-12soldstatus $25,000
-
2010-01-10$35,000
-
2009-12-01historical
-
2008-12-05$74,000
-
2000-06-28soldstatus $40,000
ⓘ Source: listings_history table (triggers on properties + properties_extension) + one-shot
backfill from property_details.listing_events for pre-trigger history.
Tax reassessment forecast FL · Resets to sale price
- Current annual tax
- $1,801 · $150/mo
- Projected year-2 tax
- $1,801 · $150/mo
- Expected delta
- $0/yr ($0/mo · 0.0%)
ⓘ Screening estimate from a state-policy table — verify with the county assessor before closing.
Climate risk First Street
- Flood 1/10 Low FEMA zone X (unshaded) · 0% chance over 30 yrs
- Wildfire 4/10 Moderate
- Heat 9/10 Extreme 7 d/yr ≥107°F today · 23 d/yr by 30 yrs out
- Wind 9/10 Extreme 99% chance of damaging wind over 30 yrs
- Air quality 2/10 Low 1 unhealthy d/yr today · 1 by 30 yrs out
Nearby sold comps map
Loading sold comps map…
Walkable amenities ~0.75 mi
Loading nearby amenities…
Taxation est. · year 1
- Rental income
- $23,951
- − Mortgage interest
- −$9,271
- − Property taxes
- −$1,801
- − Insurance
- −$828
- − Repairs & maintenance
- −$1,916
- − Management
- −$1,916
- − Depreciation
- −$4,815
- Taxable income
- $3,406
- Est. tax owed @ 24.0%
- −$817
- After-tax cash flow
- $5,061/yr
For passive investors: Depreciation is non-cash, so a rental often shows a tax loss while cash-flowing — sheltering income. Rental losses are passive: they offset passive income freely, and up to $25,000/yr can offset ordinary (W-2) income if you actively participate and your MAGI is under $100k (phasing out to $0 by $150k); unused losses carry forward. On sale, claimed depreciation is recaptured at up to 25%, and gains may owe capital-gains tax (a 1031 exchange can defer both). Figures are a year-1 estimate at your 24.0% rate — not tax advice; consult a CPA.
Schools (NCES district)
- District
- Lake
- NCES district ID
- 1201050
- Math proficiency
- 49% ▼ -7.00%
- Reading proficiency
- 50% ▼ -4.00%
- Median HH income
- $46,632
- Composite
- 42.05/100
- National rank
- #3327
- State rank
- #37 of 73 in FL
Livability — Leesburg
- Score
- 62/100
- State rank
- #751
- US rank
- #16429
Category grades
Schools grade is shown separately in the Schools card above.
Census & demographics
- County
- Lake County · 364,602 people
- City population
- 70,232
- Metro
- Orlando-Kissimmee-Sanford, FL
- Population (ZIP)
- 22,137
- Household income
- $54,147
- Rent vs Own
- Severe rent burden
- 406.0
Population outlook (Lake County) Hauer SSP2
- Today (2025)
- 386,640 people
- By 2030
- 417,107 · +7.9%
- By 2040
- 476,676 · +23.3%
- By 2050
- 531,296 · +37.4%
- By 2075
- 648,303 · +67.7%
- By 2100
- 698,530 · +80.7%
Race, ethnicity, and origin ACS 2023
- Neighborhood character
- Predominantly White (79%)
- Race & ethnicity
- White 79% Hispanic / Latino 12% Two or more races 7% Black 5% Asian 1%
- Hispanic origin (detail)
- Mexican 3% Puerto Rican 6%
- Common ancestry
- Romanian 4% Lithuanian 3% Slovak 2%
- Foreign-born
- 5% · Canada, South Korea
- Languages at home
- 88% English-only · Spanish 9% German/W. Germanic 1% Tagalog/Filipino 1%
Political lean MEDSL · Lake
- 2024 margin
- Strong R (+24.7) · D 37.3% · R 62.0%
- 2008→2024 swing
- -11.2pp toward R · 2008: -13.5pp · 2024: -24.7pp
- All cycles
- 2024: R+24.7 2020: R+20.0 2016: R+23.1 2012: R+17.1 2008: R+13.5
Not yet ingested
- Civics
- —
Market trends
- HPI YoY
- ▼ -61.07%
- Current HPI
- 273.6616
- Rent YoY
- —
- Metro
- Orlando-Kissimmee-Sanford, FL
- State GDP YoY
- ▲ 3.28%
- F500 in state
- 36
Industry mix (Fortune 500 HQ in FL)
| Industry | F500 HQs | Revenue |
|---|---|---|
| Industrial Technology | 2 | $29B |
|
||
| Insurance | 2 | $17B |
|
||
| Retail | 1 | $60B |
|
||
| Technology Distribution | 1 | $58B |
|
||
| Homebuilding | 1 | $35B |
|
||
| Technology Manufacturing | 1 | $35B |
|
||
Price history
+313.8% since first listed14 events — show timeline
- 2026-05-07 Pending — Stellar MLS as Distributed by MLS Grid
- 2026-04-12 Listed $165,500 Stellar MLS as Distributed by MLS Grid
- 2017-12-28 Sold (Public Records) $47,500 Public Records
- 2017-12-28 Sold (MLS) $47,500 Stellar MLS as Distributed by MLS Grid
- 2017-11-03 Pending — Stellar MLS as Distributed by MLS Grid
- 2017-10-24 Listed $47,500 Stellar MLS as Distributed by MLS Grid
- 2014-03-19 Sold (MLS) $36,000 Stellar MLS as Distributed by MLS Grid
- 2014-01-01 Listed $44,900 Stellar MLS as Distributed by MLS Grid
- 2012-03-22 Sold (Public Records) $48,000 Public Records
- 2010-03-12 Sold (MLS) $25,000 Stellar MLS as Distributed by MLS Grid
- 2010-01-10 Listed $35,000 Stellar MLS as Distributed by MLS Grid
- 2009-12-01 Listing Removed — Stellar MLS as Distributed by MLS Grid
- 2008-12-05 Listed $74,000 Stellar MLS as Distributed by MLS Grid
- 2000-06-28 Sold (Public Records) $40,000 Public Records
Property tax history
+10.4%/yrLatest (2025): $1,801 · +3.6% YoY. Source: county tax records.
Cash-flow waterfall
monthlySold comps — $/sqft
last 12 mo · ≤1 miLoading sold comps…