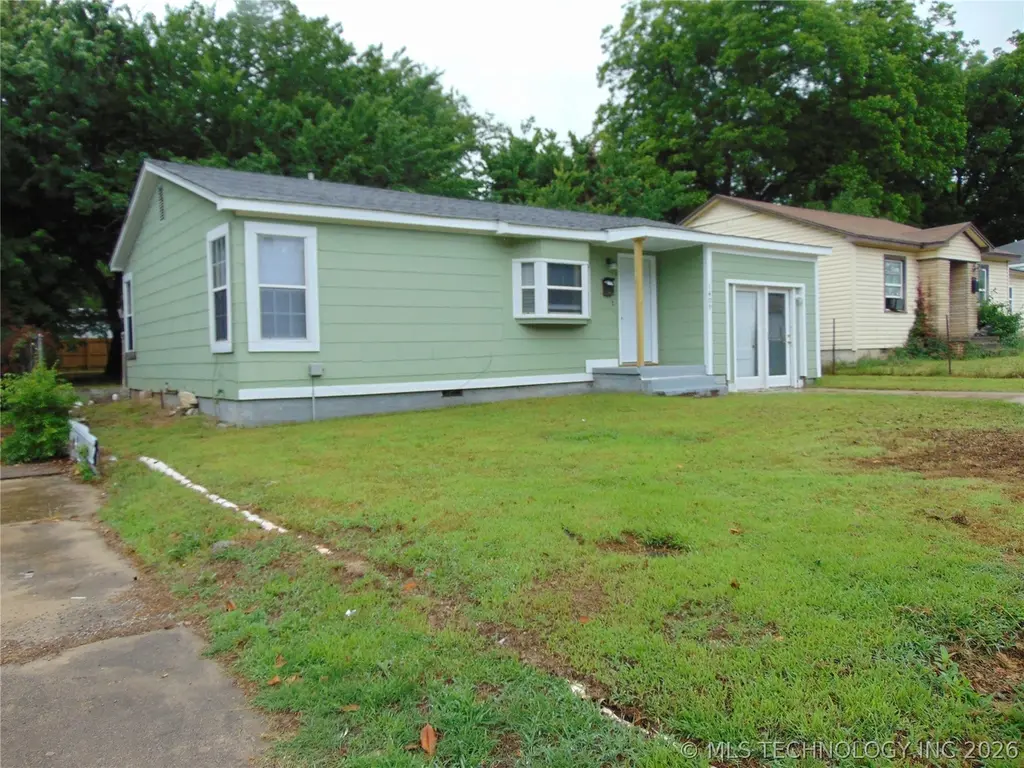
1409 B NW · Ardmore, OK
Flood risk 1/10 · Minimal
- FEMA flood zone
- X (unshaded)
- Chance of flooding over 30 yrs
- 0.0%
- Est. flood insurance / yr
- $507 – $1,088
Fire risk 3/10 · Minor
- Est. fire insurance / yr
- $2,463 – $4,575
Heat risk 6/10 · Moderate
- Hot days now (above 112°F)
- 7 days/yr
- Hot days in 30 yrs
- 20 days/yr
Wind risk 4/10 · Minor
- Chance of severe wind over 30 yrs
- 10.0%
Air-quality risk 3/10 · Minor
- Unhealthy air days now
- 2 days/yr
- Unhealthy air days in 30 yrs
- 3 days/yr
Risk factors via First Street. Map © Google.
Why this score? — see what drove the C grade
The composite is a weighted blend of 9 inputs, each scored 0–100. Each bar is that input's sub-score; the figure is the points it added to the 100-point composite (weight × sub-score).
- Cash flow +22.6/30.0
- ARV discount +9.8/15.0
- DSCR +7.2/10.0
- 1% rule +4.8/10.0
- Rent growth +4.3/5.0
- Livability +2.9/5.0
- Condition / age +2.5/5.0
- Schools +1.1/10.0
- Appreciation +0.0/10.0
$125,000
🖨 Deal sheet (PDF) 📄 Offer letter ✓ Due diligence
Listing remarks
Newly remodeled home that is a cute as can be. Major updates include a new roof in 2026, all new pex plumbing, new 200-amp breaker, HVAC only 2 years old, new floors, countertops and back splash, new entry door. The garage has been enclosed with a new sliding door entry also. The laundry facilities are in this large space which could have multiple uses. The kitchen, dining and living are arranged in an open floor plan with beautiful wood look lock together laminate flooring, new paint throughout and a cute kitchen with a tile backsplash sets this area off. This home is located only 2 blocks from an elementary school and conveniently located to the local businesses and medical facilities. Yo
Key facts
- New floors
- New pex plumbing
- New 200-amp breaker
Tags
Property features AI
Exterior
- Security: No safety shelter
- Utilities: Electricity available; Public water; Public sewer
- Home design: Single-story home; Faces east; Crawlspace foundation
- Construction: Built with wood frame and asbestos materials; Asphalt/fiberglass roof
- Exterior features: Covered porch; Porch; Shed(s); Chain link fencing; Mature trees
Interior
- Kitchen: Dishwasher; Microwave; Oven; Range; Stove
- Flooring: Carpet; Laminate
- Bathrooms: 1 full bathroom
- Heating & cooling: Central heating (electric); Central air conditioning
- Interior features: Ceramic countertops; Ceiling fan(s); Vinyl window frames; Electric oven/range connections
- Laundry & utility: Washer hookup; Electric water heater
Neighborhood map
What this means for you Summary
Snapshot
- This is a 2-bed/1.0-bath single-family listed at $125k.
Deal economics
- At list price, monthly cash flow is $212 ($3k/yr) — positive.
- The deal already cash-flows at list — no discount required.
- To meet the 1% rule (rent ≥ 1% of price), the offer needs to be $122k (2.4% below list).
- Recommended offer: $122k (2.4% below list) — sets the bar for 1% rule.
- Cap rate 8.3% vs local median 4.6% in Ardmore — top-decile yield for the area; either an underpriced asset or a hidden risk that comps aren't pricing in. Stress-test before assuming the spread holds.
Location & tenants
- Location reads 58/100 on livability (#447 in OK) — a working-class tenant base; expect higher turnover. Strengths: cost of living A+, housing A+; Watch: schools F, crime F, amenities F.
- Ardmore (town): math 12% / reading 15% proficiency, ranked #241 of 270 in OK (top 89%) — low school quality limits family demand, transient renter base, plan for 1-2y turnover; 73% free/reduced lunch — lower-income household profile, screen leases tightly.
- Market conditions: Rents rising fast (+7.4%/yr); 379 active listings in the ZIP; 73 units permitted in Carter County in 2024 (0 in 5+ unit buildings).
Forward outlook
- Local home prices are declining (-3.0%/yr); year-one equity from $864 of loan paydown is wiped out by about $4k of value loss. Plan a longer hold.
- Carter County population projected at +9% by 2050 — modest demand growth; plan on rents tracking national, not racing it.
- At projected returns (-3.0% appreciation + 7.4% rent growth), your $35k cash investment doubles in ~9 years — after that, you're playing with house money.
Negotiation context
- It's been on market 23 days — a 2% lower offer ($123k) is reasonable based on typical stale-listing flexibility.
Risks & watch-outs
- Watch-outs: built in 1950 — expect roof / HVAC / electrical / plumbing capex.
- Climate carrying-cost: extreme-heat days projected 7→20/yr by 2055 (HVAC capex compounding) — expect insurance premiums to compound above CPI over the hold.
Questions for the listing agent
- Built in 1950 — when were the roof, HVAC, electrical panel, plumbing, and water heater last replaced?
- Is there a deadline driving the sale (1031 exchange, divorce, estate, relocation)? That informs how much negotiation room exists.
- Schools are F-rated, which usually means shorter tenancies and higher turnover. Who's the typical renter profile here, and what's been the actual vacancy rate?
- Crime grade is F in this area — have there been break-ins, vandalism, or insurance claims at this property in the last 3 years? What carrier currently insures it and at what premium?
- What's the average days-on-market for RENTAL listings here right now (not sales)? A rising rental-DOM trend means longer vacancies and softer asking-rent achievability than the comps imply.
- What's the recent tenant-quality profile in this submarket — average credit score on applications, eviction rate, late-payment / NSF rate, and stable-employment percentage? A property-management company in the area should have these aggregated.
- How much new for-sale + rental construction is in the pipeline within 1–3 miles? Heavy new supply typically softens prices + rents 12–24 months out; constrained supply supports both.
Investment metrics
- 1% rule
- 0.98% ✗
- Cap rate
- 8.33%
- Cash-on-cash
- 7.26%
- DSCR
- 1.32
- GRM
- 8.5
CMA / ARV
- ARV (on-the-fly)
- $131,688
- Comps found
- 12
Show comp detail 12 sales within ~0.75 mi
| Address | Dist | Beds/Ba | Sqft | Sold | Price | $/sf | Match |
|---|---|---|---|---|---|---|---|
| 408 NW 11th St | 0.33mi | 2/1.0 | 1,194 (+12%) | 1mo | $140,000 | $117 | 63 |
| 1412 Healdton Blvd | 0.54mi | 3/1.0 (+1) | 1,124 (+6%) | 2mo | $144,300 | $128 | 58 |
| 703 Campbell | 0.59mi | 3/1.0 (+1) | 1,104 (+4%) | 4mo | $139,000 | $126 | 57 |
| 113 10th Ave NE | 0.48mi | 2/1.0 | 938 (-12%) | 3mo | $83,000 | $88 | 56 |
| 1218 G St NW | 0.61mi | 2/1.0 | 1,000 (-6%) | 7mo | $90,000 | $90 | 56 |
| 428 Elm | 0.49mi | 3/2.0 (+1) | 1,012 (-5%) | 7mo | $139,000 | $137 | 54 |
| 1220 Hargrove | 0.35mi | 3/1.0 (+1) | 1,182 (+11%) | 7mo | $155,000 | $131 | 54 |
| 426 Elm | 0.49mi | 3/1.5 (+1) | 1,128 (+6%) | 7mo | $89,000 | $79 | 54 |
| 818 Northwest Blvd | 0.53mi | 2/1.0 | 928 (-13%) | 3mo | $114,900 | $124 | 52 |
| 1115 Harris St | 0.52mi | 2/2.0 | 1,180 (+11%) | 4mo | $128,000 | $108 | 50 |
| 504 5th NW | 0.70mi | 2/1.0 | 1,162 (+9%) | 3mo | $138,000 | $119 | 49 |
| 421 Elm | 0.51mi | 3/1.5 (+1) | 926 (-13%) | 2mo | $132,000 | $143 | 46 |
Match score weights: distance 35% · size 25% · config 20% · recency 20%. Top-matched comps best support the ARV.
Projected returns pro-forma
-3.0% appreciation · 7.38% rent growth · sell at horizon
- IRR
- -0.9%
- Equity multiple
- 0.97×
- Total profit
- $-1,209
- Equity at exit
- $18,638
- IRR
- 12.6%
- Equity multiple
- 2.18×
- Total profit
- $41,316
- Equity at exit
- $10,808
Cash invested: $35,000 (down + closing). Projections, not guarantees.
Landlord ↔ Tenant lean methodology
- Overall (STATE)
- 83 Strongly Landlord-Friendly
- State Oklahoma
- 83 Strongly Landlord-Friendly · R+20
- County
- — inherits STATE
- City
- — inherits STATE
ZIP-level market 73401
- Home prices YoY
- -21.7%
- Rents YoY
- 7.4%
- Active inventory
- 379
- Price-to-rent
- 8.5×
Monthly cashflow live
- Estimated rent
- $1,220 medium interval (Pro) →
- Mortgage (P&I)
- −$656
- Tax from tax record
- −$44 /mo · $530/yr
- Insurance
- −$52
- HOA
- −$0
- Vacancy / Maint / Mgmt
- −$256
- Net cashflow
- $212
Break-even live
Sensitivity live
| Price | -10% $282 | -5% $247 | +0% $212 | +5% $176 | +10% $141 |
|---|---|---|---|---|---|
| Rent | -10% $115 | -5% $164 | +0% $212 | +5% $260 | +10% $308 |
| Rate | -1.0pp $275 | -0.5pp $244 | base $212 | +0.5pp $179 | +1.0pp $146 |
UW: 25.0% down · 7.5% · 30yr · 1.5% tax · 5.0% vac · 8.0% maint · 8.0% mgmt
Financing live
Cash to close
- Down payment
- $31,250
- Closing costs
- $3,750
- Reserves months
- —
- Total cash needed
- —
Loan-product check · same deal, 3 products live
Conventional
25% down · 7.5% · 30yr
- Down + closing
- —
- Monthly P&I
- —
- Monthly cashflow
- —
- DSCR
- —
- Eligible?
- —
Personal DTI + credit; lowest rate.
DSCR
20% down · 8.5% · 30yr
- Down + closing
- —
- Monthly P&I
- —
- Monthly cashflow
- —
- DSCR
- —
- Eligible?
- —
No personal income docs; deal must DSCR.
Hard money
10% down · 12.0% · 12mo
- Down + closing
- —
- Monthly P&I
- —
- Monthly cashflow
- —
- DSCR
- —
- Eligible?
- —
Short-term bridge; refi at stabilization.
Listing history 18 events
-
2026-06-19days on market $125,000 Active 23 DOM
-
2026-06-18days on market $125,000 Active 22 DOM
-
2026-06-17days on market $125,000 Active 21 DOM
-
2026-06-17price $125,000 Active 20 DOM
-
2026-06-16days on market $139,000 Active 20 DOM
-
2026-06-15days on market $139,000 Active 19 DOM
-
2026-06-14days on market $139,000 Active 17 DOM
-
2026-06-12days on market $139,000 Active 16 DOM
-
2026-06-09days on market $139,000 Active 13 DOM
-
2026-06-08days on market $139,000 Active 12 DOM
-
2026-06-07days on market $139,000 Active 11 DOM
-
2026-06-05days on market $139,000 Active 8 DOM
-
2026-06-03days on market $139,000 Active 7 DOM
-
2026-06-02days on market $139,000 Active 6 DOM
-
2026-06-01days on market $139,000 Active 5 DOM
-
2026-05-31days on market $139,000 Active 4 DOM
-
2026-05-30days on market $139,000 Active 3 DOM
-
2026-05-26$139,000 Active
ⓘ Source: listings_history table (triggers on properties + properties_extension) + one-shot
backfill from property_details.listing_events for pre-trigger history.
Tax reassessment forecast OK · Resets to sale price
- Current annual tax
- $530 · $44/mo
- Projected year-2 tax
- $1,125 · $94/mo
- Expected delta
- +$595/yr (+$50/mo · 112.3%)
ⓘ Screening estimate from a state-policy table — verify with the county assessor before closing.
Climate risk First Street
- Flood 1/10 Low FEMA zone X (unshaded) · 0% chance over 30 yrs
- Wildfire 3/10 Moderate
- Heat 6/10 Major 7 d/yr ≥112°F today · 20 d/yr by 30 yrs out
- Wind 4/10 Moderate 10% chance of damaging wind over 30 yrs
- Air quality 3/10 Moderate 2 unhealthy d/yr today · 3 by 30 yrs out
Nearby sold comps map
Loading sold comps map…
Walkable amenities ~0.75 mi
Loading nearby amenities…
Taxation est. · year 1
- Rental income
- $14,635
- − Mortgage interest
- −$7,002
- − Property taxes
- −$530
- − Insurance
- −$625
- − Repairs & maintenance
- −$1,171
- − Management
- −$1,171
- − Depreciation
- −$3,636
- Taxable income
- $500
- Est. tax owed @ 24.0%
- −$120
- After-tax cash flow
- $2,421/yr
For passive investors: Depreciation is non-cash, so a rental often shows a tax loss while cash-flowing — sheltering income. Rental losses are passive: they offset passive income freely, and up to $25,000/yr can offset ordinary (W-2) income if you actively participate and your MAGI is under $100k (phasing out to $0 by $150k); unused losses carry forward. On sale, claimed depreciation is recaptured at up to 25%, and gains may owe capital-gains tax (a 1031 exchange can defer both). Figures are a year-1 estimate at your 24.0% rate — not tax advice; consult a CPA.
Schools (NCES district)
- District
- Ardmore
- NCES district ID
- 4003180
- Math proficiency
- 12% ▼ -7.00%
- Reading proficiency
- 15% ▼ -6.00%
- Median HH income
- $35,194
- Composite
- 11.1/100
- National rank
- #9733
- State rank
- #241 of 270 in OK
Livability — Ardmore
- Score
- 58/100
- State rank
- #447
- US rank
- #21387
Category grades
Schools grade is shown separately in the Schools card above.
Census & demographics
- Census place
- Ardmore, OK
- County
- Carter County · 36,833 people
- City population
- 36,833
- Metro
- Ardmore, OK
- Population (ZIP)
- 36,833
- Household income
- $61,989
- Rent vs Own
- Severe rent burden
- 1026.0
Population outlook (Carter County) Hauer SSP2
- Today (2025)
- 50,892 people
- By 2030
- 51,913 · +2.0%
- By 2040
- 53,857 · +5.8%
- By 2050
- 55,604 · +9.3%
- By 2075
- 60,670 · +19.2%
- By 2100
- 62,366 · +22.5%
Race, ethnicity, and origin ACS 2023
- Neighborhood character
- Diverse neighborhood (Simpson 0.57)
- Race & ethnicity
- White 65% Two or more races 14% Hispanic / Latino 9% Native American 8% Black 7% Asian 1%
- Hispanic origin (detail)
- Mexican 7%
- Common ancestry
- Slovak 2% Lithuanian 1% Italian 1%
- Foreign-born
- 4% · Canada
- Languages at home
- 92% English-only · Spanish 5%
Political lean MEDSL · Carter
- 2024 margin
- Solid R (+54.7) · D 21.9% · R 76.7% · Other 1.4%
- 2008→2024 swing
- -14.2pp toward R · 2008: -40.5pp · 2024: -54.7pp
- All cycles
- 2024: R+54.7 2020: R+52.5 2016: R+52.6 2012: R+42.7 2008: R+40.5
Not yet ingested
- Civics
- —
Market trends
- HPI YoY
- ▼ -74.93%
- Current HPI
- 269.7381
- Rent YoY
- ▲ 7.38%
- Metro
- Ardmore, OK
- State GDP YoY
- ▲ 1.55%
- F500 in state
- 6
Industry mix (Fortune 500 HQ in OK)
| Industry | F500 HQs | Revenue |
|---|---|---|
| Energy | 3 | $48B |
|
||
Price history
1 event — show timeline
- 2026-05-26 Listed $139,000 MLS Technology, Inc.
Property tax history
+6.8%/yrLatest (2025): $530 · +5.0% YoY. Source: county tax records.
Cash-flow waterfall
monthlySold comps — $/sqft
last 12 mo · ≤1 miLoading sold comps…