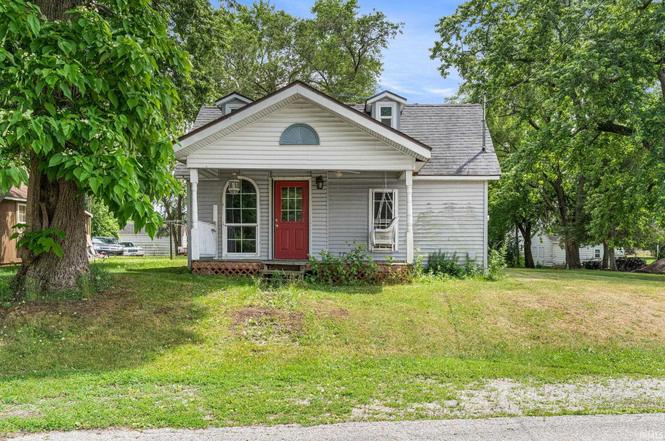
105 E Arlington Ave · North Judson, IN
Flood risk 1/10 · Minimal
- FEMA flood zone
- X (unshaded)
- Chance of flooding over 30 yrs
- 0.0%
- Est. flood insurance / yr
- $507 – $1,088
Fire risk 1/10 · Minimal
- Est. fire insurance / yr
- $717 – $1,331
Heat risk 2/10 · Minimal
- Hot days now (above 101°F)
- 7 days/yr
- Hot days in 30 yrs
- 16 days/yr
Wind risk 2/10 · Minimal
- Chance of severe wind over 30 yrs
- —
Air-quality risk 2/10 · Minimal
- Unhealthy air days now
- 1 days/yr
- Unhealthy air days in 30 yrs
- 2 days/yr
Risk factors via First Street. Map © Google.
Why this score? — see what drove the B+ grade
The composite is a weighted blend of 9 inputs, each scored 0–100. Each bar is that input's sub-score; the figure is the points it added to the 100-point composite (weight × sub-score).
- Cash flow +30.0/30.0
- ARV discount +15.0/15.0
- DSCR +10.0/10.0
- 1% rule +9.4/10.0
- Livability +3.2/5.0
- Schools +2.8/10.0
- Rent growth +2.5/5.0
- Condition / age +2.5/5.0
- Appreciation +0.0/10.0
$59,800
🖨 Deal sheet 📄 Offer letter ✓ Due diligence
Listing remarks MLS
Affordable opportunities like this don't come around often! Take a look at this North Judson property that's ready for its next chapter. With some TLC, this home could be restored to its former charm and make a wonderful place to call home or a great investment opportunity. Offering 2 bedrooms, 1 bathroom, and located on nearly a quarter acre lot, this property provides comfort, convenience, and value. Inside, you'll find a spacious living room with hardwood flooring and plenty of natural light. The kitchen features higher ceilings and a skylight, creating a bright and open feel. Both bedrooms offer comfortable living space, and the main-floor utility/laundry room adds everyday convenience. Recent updates include a new water heater, providing added peace of mind for the next owner. Outside, a covered front porch adds to the home's charm and provides a comfortable place to sit and unwind. You'll also find a generously sized backyard with plenty of room for outdoor activities, gardening, or future improvements. Whether you're a first-time homebuyer, investor, or someone looking for a property with potential, this North Judson home is worth a look!
Key facts
- Hardwood flooring
- Higher ceilings
- Covered front porch
Tags
Property features AI
Finance
- Other: Property listed as fixer condition
Exterior
- Parking: Driveway
- Utilities: Electricity connected; Natural gas connected; Public water; Public sewer
- Home design: One-story home; Built in 1900
- Construction: Vinyl siding; Asphalt roof; Originally built in 1900
- Exterior features: Private yard; Covered front porch; City views
Interior
- Kitchen: Range; Refrigerator
- Bedrooms: Primary bedroom; Second bedroom
- Flooring: Hardwood flooring; Other flooring
- Bathrooms: 1 full bathroom
- Heating & cooling: Natural gas heating; Central air conditioning
- Interior features: Some built-in or miscellaneous features (other)
- Laundry & utility: Main level laundry with electric dryer hookup
Neighborhood map
What this means for you Summary
Snapshot
- This is a 2-bed/1.0-bath single-family listed at $60k.
Deal economics
- At list price, monthly cash flow is $253 ($3k/yr) — positive.
- The deal already cash-flows at list — no discount required.
- Meets the 1% rule at list price ($862 rent vs $60k).
- Cap rate 11.4% vs local median 3.7% in North Judson — top-decile yield for the area; either an underpriced asset or a hidden risk that comps aren't pricing in. Stress-test before assuming the spread holds.
Location & tenants
- Location reads 63/100 on livability (#423 in IN) — a middle-class / working-renter tenant base. Strengths: crime A+, cost of living A+, housing A+; Watch: employment D, schools D-, amenities F.
- North Judson-San Pierre School Corporation (rural): math 30% / reading 35% proficiency, ranked #218 of 301 in IN (top 72%) — families likely to look elsewhere, expect single-tenant / working-renter base with shorter leases.
- Market conditions: 38 active listings in the ZIP; 58 units permitted in Starke County in 2024 (0 in 5+ unit buildings).
Forward outlook
- Local home prices are declining (-3.0%/yr); year-one equity from $413 of loan paydown is wiped out by about $2k of value loss. Plan a longer hold.
- Starke County population projected at -23% by 2050 — secular population decline; favor cash flow + early exit over multi-decade hold.
- At projected returns (-3.0% appreciation + 3.0% rent growth), your $17k cash investment doubles in ~7 years — after that, you're playing with house money.
Negotiation context
- Only 3 days on market — expect competitive offers; lowballing is unlikely to land.
- 4 sale attempts since 17y ago with the ask held roughly flat each time — persistent listings suggest the price (not the market) is what's stuck; bring a comps-based counter.
- Current owner paid $29k; list at $60k implies a 106% gain — meaningful room to come down on a strong offer.
Risks & watch-outs
- Watch-outs: built in 1900 — expect roof / HVAC / electrical / plumbing capex.
Questions for the listing agent
- Built in 1900 — when were the roof, HVAC, electrical panel, plumbing, and water heater last replaced?
- Is there a deadline driving the sale (1031 exchange, divorce, estate, relocation)? That informs how much negotiation room exists.
- Schools are D-rated, which usually means shorter tenancies and higher turnover. Who's the typical renter profile here, and what's been the actual vacancy rate?
- What's the average days-on-market for RENTAL listings here right now (not sales)? A rising rental-DOM trend means longer vacancies and softer asking-rent achievability than the comps imply.
- What's the recent tenant-quality profile in this submarket — average credit score on applications, eviction rate, late-payment / NSF rate, and stable-employment percentage? A property-management company in the area should have these aggregated.
- How much new for-sale + rental construction is in the pipeline within 1–3 miles? Heavy new supply typically softens prices + rents 12–24 months out; constrained supply supports both.
Investment metrics
- 1% rule
- 1.44% ✓
- Cap rate
- 11.36%
- Cash-on-cash
- 18.11%
- DSCR
- 1.81
- GRM
- 5.8
CMA / ARV
- ARV (on-the-fly)
- $77,760
- Comps found
- 6
Show comp detail 6 sales within ~0.75 mi
| Address | Dist | Beds/Ba | Sqft | Sold | Price | $/sf | Match |
|---|---|---|---|---|---|---|---|
| 108 Lincoln Ave | 0.04mi | 2/1.0 | 895 (+4%) | 9mo | $80,400 | $90 | 85 |
| 52 E Lincoln Ave | 0.12mi | 3/1.0 (+1) | 864 (0%) | 13mo | $110,000 | $127 | 79 |
| 419 Main St | 0.35mi | 2/1.0 | 840 (-3%) | 3mo | $37,000 | $44 | 76 |
| 401 Keller Ave | 0.34mi | 3/1.0 (+1) | 964 (+12%) | 9mo | $39,000 | $40 | 53 |
| 203 Silver St | 0.49mi | 2/1.0 | 784 (-9%) | 11mo | $64,900 | $83 | 52 |
| 306 S Schricker Ave | 0.64mi | 2/1.0 | 792 (-8%) | 13mo | $159,900 | $202 | 46 |
Match score weights: distance 35% · size 25% · config 20% · recency 20%. Top-matched comps best support the ARV.
Projected returns pro-forma
-3.0% appreciation · 3.0% rent growth · sell at horizon
- IRR
- 9.7%
- Equity multiple
- 1.38×
- Total profit
- $6,426
- Equity at exit
- $8,916
- IRR
- 18.9%
- Equity multiple
- 2.58×
- Total profit
- $26,409
- Equity at exit
- $5,170
Cash invested: $16,744 (down + closing). Projections, not guarantees.
Landlord ↔ Tenant lean methodology
- Overall (STATE)
- 90 Strongly Landlord-Friendly
- State Indiana
- 90 Strongly Landlord-Friendly · R+11
- County
- — inherits STATE
- City
- — inherits STATE
ZIP-level market 46366
- Home prices YoY
- -12.7%
- Active inventory
- 38
- Price-to-rent
- 5.8×
Monthly cashflow live
- Estimated rent
- $862 medium interval (Pro) →
- Mortgage (P&I)
- −$314
- Tax from tax record
- −$90 /mo · $1,074/yr
- Insurance
- −$25
- HOA
- −$0
- Vacancy / Maint / Mgmt
- −$181
- Net cashflow
- $253
Break-even live
UW: 25.0% down · 7.5% · 30yr · 1.5% tax · 5.0% vac · 8.0% maint · 8.0% mgmt
Financing live
Cash to close
- Down payment
- $14,950
- Closing costs
- $1,794
- Reserves months
- —
- Total cash needed
- —
Loan-product check · same deal, 3 products live
Conventional
25% down · 7.5% · 30yr
- Down + closing
- —
- Monthly P&I
- —
- Monthly cashflow
- —
- DSCR
- —
- Eligible?
- —
Personal DTI + credit; lowest rate.
DSCR
20% down · 8.5% · 30yr
- Down + closing
- —
- Monthly P&I
- —
- Monthly cashflow
- —
- DSCR
- —
- Eligible?
- —
No personal income docs; deal must DSCR.
Hard money
10% down · 12.0% · 12mo
- Down + closing
- —
- Monthly P&I
- —
- Monthly cashflow
- —
- DSCR
- —
- Eligible?
- —
Short-term bridge; refi at stabilization.
Listing history 4 events
-
2026-06-18days on market $59,800 Active 3 DOM
-
2026-06-17days on market $59,800 Active 2 DOM
-
2026-06-16remarks 699-char remark
-
2026-06-16$59,800 Active 1 DOM
ⓘ Source: listings_history table (triggers on properties + properties_extension) + one-shot
backfill from property_details.listing_events for pre-trigger history.
Tax reassessment forecast IN · Partial reset (capped growth)
- Current annual tax
- $1,074 · $90/mo
- Projected year-2 tax
- $1,074 · $90/mo
- Expected delta
- $0/yr ($0/mo · 0.0%)
ⓘ Screening estimate from a state-policy table — verify with the county assessor before closing.
Climate risk First Street
- Flood 1/10 Low FEMA zone X (unshaded) · 0% chance over 30 yrs
- Wildfire 1/10 Low
- Heat 2/10 Low 7 d/yr ≥101°F today · 16 d/yr by 30 yrs out
- Wind 2/10 Low
- Air quality 2/10 Low 1 unhealthy d/yr today · 2 by 30 yrs out
Nearby sold comps map
Loading sold comps map…
Walkable amenities ~0.75 mi
Loading nearby amenities…
Taxation est. · year 1
- Rental income
- $10,340
- − Mortgage interest
- −$3,350
- − Property taxes
- −$1,074
- − Insurance
- −$299
- − Repairs & maintenance
- −$827
- − Management
- −$827
- − Depreciation
- −$1,740
- Taxable income
- $2,223
- Est. tax owed @ 24.0%
- −$534
- After-tax cash flow
- $2,499/yr
For passive investors: Depreciation is non-cash, so a rental often shows a tax loss while cash-flowing — sheltering income. Rental losses are passive: they offset passive income freely, and up to $25,000/yr can offset ordinary (W-2) income if you actively participate and your MAGI is under $100k (phasing out to $0 by $150k); unused losses carry forward. On sale, claimed depreciation is recaptured at up to 25%, and gains may owe capital-gains tax (a 1031 exchange can defer both). Figures are a year-1 estimate at your 24.0% rate — not tax advice; consult a CPA.
Schools (NCES district)
- District
- North Judson-San Pierre School Corporation
- NCES district ID
- 1807800
- Math proficiency
- 30% ▼ -10.00%
- Reading proficiency
- 35% ▲ 3.00%
- Median HH income
- $42,731
- Composite
- 27.57/100
- National rank
- #6940
- State rank
- #218 of 301 in IN
Livability — North Judson
- Score
- 63/100
- State rank
- #423
- US rank
- #15224
Category grades
Schools grade is shown separately in the Schools card above.
Census & demographics
- Census place
- North Judson, IN
- City population
- 5,672
- Population (ZIP)
- 5,672
Population outlook (Starke County) Hauer SSP2
- Today (2025)
- 21,860 people
- By 2030
- 21,024 · -3.8%
- By 2040
- 19,041 · -12.9%
- By 2050
- 16,881 · -22.8%
- By 2075
- 11,880 · -45.7%
- By 2100
- 7,217 · -67.0%
Race, ethnicity, and origin ACS 2023
- Neighborhood character
- Predominantly White (92%)
- Race & ethnicity
- White 92% Hispanic / Latino 5% Two or more races 3% Asian 1%
- Common ancestry
- Romanian 5% Iranian 3% Slovak 2%
- Foreign-born
- 2% · Canada
- Languages at home
- 98% English-only · German/W. Germanic 1% Spanish 1%
Political lean MEDSL · Starke
- 2024 margin
- Solid R (+52.0) · D 23.2% · R 75.3% · Other 1.5%
- 2008→2024 swing
- -55.3pp toward R · 2008: 3.2pp · 2024: -52.0pp
- All cycles
- 2024: R+52.0 2020: R+46.8 2016: R+42.0 2012: R+10.6 2008: D+3.2
Not yet ingested
- Civics
- —
Market trends
- HPI YoY
- ▼ -32.58%
- Current HPI
- 224.7809
- Rent YoY
- —
- Metro
- —
- State GDP YoY
- ▲ 2.90%
- F500 in state
- 18
Industry mix (Fortune 500 HQ in IN)
| Industry | F500 HQs | Revenue |
|---|---|---|
| Industrial Machinery | 2 | $37B |
|
||
| Healthcare | 1 | $177B |
|
||
| Pharmaceuticals | 1 | $45B |
|
||
| Metals / Steel | 1 | $18B |
|
||
| Agriculture | 1 | $17B |
|
||
| Packaging | 1 | $12B |
|
||
Price history
+49.9% since first listed7 events — show timeline
- 2026-06-15 Listed $59,800 IRMLS
- 2026-06-15 Listed $59,800 NIRA MLS as Distributed by MLS Grid
- 2009-07-27 Sold (Public Records) $29,000 Public Records
- 2009-07-27 Sold (MLS) $29,000 NIRA MLS as Distributed by MLS Grid
- 2009-07-27 Sold (MLS) $29,000 NIRA MLS as Distributed by MLS Grid
- 2009-03-26 Listed $39,900 NIRA MLS as Distributed by MLS Grid
- 2009-03-26 Listed $39,900 NIRA MLS as Distributed by MLS Grid
Property tax history
+2.5%/yrLatest (2024): $1,074 · +3.7% YoY. Source: county tax records.
Cash-flow waterfall
monthlySold comps — $/sqft
last 12 mo · ≤1 miLoading sold comps…