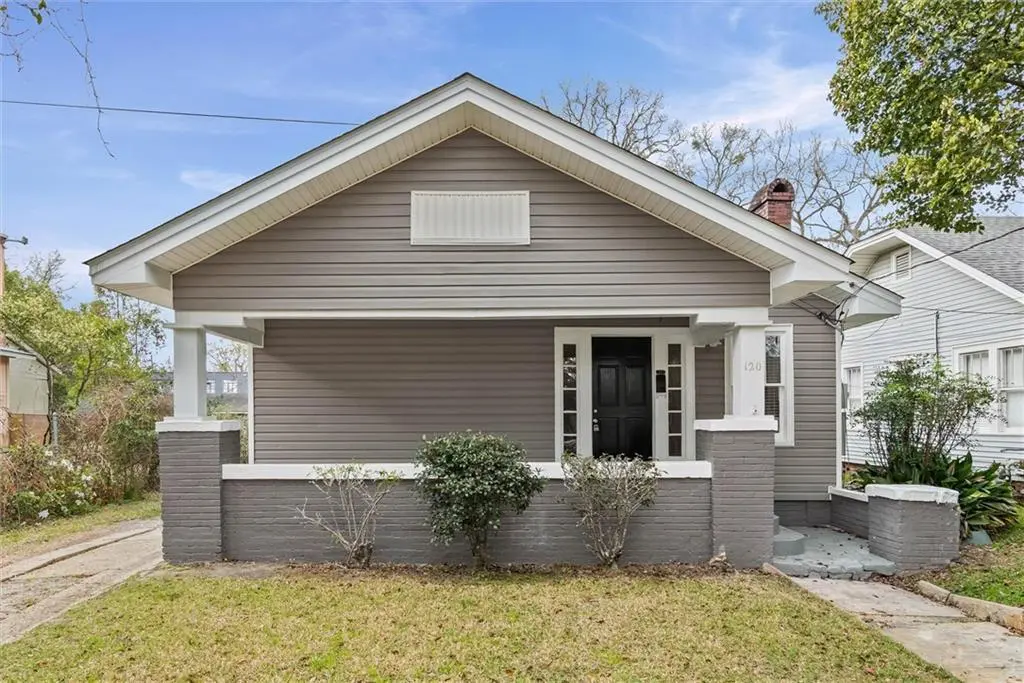
120 Demouy Ave · Mobile, AL
Flood risk 8/10 · Major
- FEMA flood zone
- X (unshaded)
- Chance of flooding over 30 yrs
- 0.99%
- Est. flood insurance / yr
- $507 – $1,088
Fire risk 1/10 · Minimal
- Est. fire insurance / yr
- $916 – $1,700
Heat risk 9/10 · Severe
- Hot days now (above 105°F)
- 7 days/yr
- Hot days in 30 yrs
- 20 days/yr
Wind risk 9/10 · Severe
- Chance of severe wind over 30 yrs
- 99.0%
Air-quality risk 2/10 · Minimal
- Unhealthy air days now
- 1 days/yr
- Unhealthy air days in 30 yrs
- 1 days/yr
Risk factors via First Street. Map © Google.
Why this score? — see what drove the D+ grade
The composite is a weighted blend of 9 inputs, each scored 0–100. Each bar is that input's sub-score; the figure is the points it added to the 100-point composite (weight × sub-score).
- ARV discount +15.0/15.0
- Cash flow +12.1/30.0
- Rent growth +3.8/5.0
- Livability +3.8/5.0
- DSCR +3.6/10.0
- 1% rule +2.6/10.0
- Condition / age +2.5/5.0
- Schools +2.3/10.0
- Appreciation +0.0/10.0
$219,500
🖨 Deal sheet (PDF) 📄 Offer letter ✓ Due diligence
Listing remarks MLS
BEAUTIFULLY UPDATED HOME IN THE HEART OF MIDTOWN MOBILE! Features include new hardwood floors throughout (except for the bathrooms), new paint, updated bathrooms, updated lighting, new vinyl siding, and more. The remodeled kitchen features updated cabinets, counter tops, and appliances. Demouy Avenue has some of the most beautiful older homes in Midtown. Don't miss your opportunity to own one! Call your Realtor 5 minutes ago!
Key facts
- Updated cabinets
- Remodeled kitchen
- Updated bathrooms
Tags
Neighborhood map
What this means for you Summary
Snapshot
- This is a 3-bed/2.0-bath single-family listed at $220k.
Deal economics
- At list price, monthly cash flow is $-116 ($-1k/yr) — negative.
- To cash-flow at today's rent, offer at most $199k (9.3% below list).
- To meet the 1% rule (rent ≥ 1% of price), the offer needs to be $167k (24.0% below list).
- Recommended offer: $167k (24.0% below list) — sets the bar for 1% rule.
- Cap rate 6.0% vs local median 4.9% in Mobile — meaningfully above typical; check what's discounted (condition, days-on-market, listing class) to confirm the premium yield is real.
Location & tenants
- Location reads 75/100 on livability (#20 in AL, #4,262 nationally) — a middle-class / working-renter tenant base. Strengths: commute A+, cost of living A+, housing A+; Watch: crime F, employment D-.
- Mobile County (urban): math 15% / reading 39% proficiency, ranked #81 of 129 in AL (top 63%) — low school quality limits family demand, transient renter base, plan for 1-2y turnover; 67% free/reduced lunch — lower-income household profile, screen leases tightly.
- Zoned schools: Leinkauf Elementary School (math 8% / reading 26%, grade F, #499 of 627 statewide, top 80%, 538 students, 91% FRL); Booker T Washington Middle School (math 0% / reading 12%, grade F, #252 of 257 statewide, top 98%, 340 students, 95% FRL); Murphy High School (math 10% / reading 19%, grade F, #220 of 305 statewide, top 77%, 1,254 students, 66% FRL) — zoned schools average 84% FRL vs 67% district-wide (17 pts higher); higher-poverty schools than district average — tighter screening recommended.
- Zoned-school proficiency averages 13% at this address vs 27% district-wide (-14 pts) — the specific schools serving this property underperform the Mobile County average; the district grade overstates school quality for this exact location.
- Market conditions: Rents rising fast (+5.1%/yr); 175 active listings in the ZIP; 36 comparable units currently listed for rent nearby; rentals at typical pace (median 23d on market — plan ~3-4 weeks tenant-placement turnaround); 42% of comp listings sitting > 30 days — soft ceiling on asking rent; 1,678 units permitted in Mobile County in 2024 (264 in 5+ unit buildings).
- This rent runs 39% of the median local income ($51k/yr) — at the standard rent-burdened threshold; future hikes will face affordability resistance.
Forward outlook
- Local home prices are declining (-3.0%/yr); year-one equity from $2k of loan paydown is wiped out by about $7k of value loss. Plan a longer hold.
- Mobile County population projected to shrink 8% by 2050 — rents likely to lag national; underwrite the cash flow, not the appreciation.
Negotiation context
- It's been on market 106 days — a 9% lower offer ($200k) is reasonable based on typical stale-listing flexibility.
Risks & watch-outs
- Watch-outs: flood insurance adds $66/mo; built in 1930 — expect roof / HVAC / electrical / plumbing capex.
- Climate carrying-cost: severe flood risk; severe wind risk, 99% chance of damaging wind over 30y; extreme-heat days projected 7→20/yr by 2055 (HVAC capex compounding) — expect insurance premiums to compound above CPI over the hold.
Questions for the listing agent
- What do current leases actually rent for vs. the listed asking? Can we see a recent rent roll and the last 12 months of T-12 income?
- It's been on market 106 days. Have you received any prior offers? Is the seller open to a 24% concession, seller financing, or rate buy-down credit?
- Built in 1930 — when were the roof, HVAC, electrical panel, plumbing, and water heater last replaced?
- What's the actual annual flood-insurance premium (NFIP or private), and is the property in a SFHA with mandatory coverage?
- Why hasn't it sold? Are there any deal-killer items the seller is aware of (foundation, flood, title, zoning, code violations)?
- Is there a deadline driving the sale (1031 exchange, divorce, estate, relocation)? That informs how much negotiation room exists.
- Schools are D-rated, which usually means shorter tenancies and higher turnover. Who's the typical renter profile here, and what's been the actual vacancy rate?
- Crime grade is F in this area — have there been break-ins, vandalism, or insurance claims at this property in the last 3 years? What carrier currently insures it and at what premium?
- The area grade is low — what's the realistic commute time and amenity access for the typical tenant pool here? Any planned neighborhood developments (good or bad) we should know about?
- What's the average days-on-market for RENTAL listings here right now (not sales)? A rising rental-DOM trend means longer vacancies and softer asking-rent achievability than the comps imply.
- What's the recent tenant-quality profile in this submarket — average credit score on applications, eviction rate, late-payment / NSF rate, and stable-employment percentage? A property-management company in the area should have these aggregated.
- How much new for-sale + rental construction is in the pipeline within 1–3 miles? Heavy new supply typically softens prices + rents 12–24 months out; constrained supply supports both.
Investment metrics
- 1% rule
- 0.76% ✗
- Cap rate
- 6.02%
- Cash-on-cash
- -0.96%
- DSCR
- 0.96
- GRM
- 11.0
CMA / ARV
- ARV (median comp)
- $279,523
- List price
- $219,500
- Delta
- -21.47%
- Verdict
- UNDERPRICED
- Comps
- 20 within 1.0 mi
Show comp detail 12 sales within ~0.75 mi
| Address | Dist | Beds/Ba | Sqft | Sold | Price | $/sf | Match |
|---|---|---|---|---|---|---|---|
| 53 Carlen St S | 0.17mi | 3/2.0 | 1,383 (+3%) | 1mo | $300,000 | $217 | 86 |
| 1910 Hunter Ave | 0.16mi | 3/2.5 | 1,462 (+9%) | 4mo | $310,000 | $212 | 72 |
| 21 Carlen St S | 0.25mi | 3/2.0 | 1,460 (+9%) | 2mo | $310,000 | $212 | 71 |
| 21 HOUSTON St | 0.33mi | 2/1.0 (-1) | 1,375 (+3%) | 2mo | $180,000 | $131 | 70 |
| 121 Macy Pl | 0.49mi | 3/2.0 | 1,375 (+3%) | 3mo | $280,000 | $204 | 70 |
| 55 Monterey St S | 0.45mi | 2/2.0 (-1) | 1,366 (+2%) | 1mo | $260,000 | $190 | 70 |
| 18 Hannon Ave | 0.37mi | 3/1.0 | 1,472 (+10%) | 2mo | $253,650 | $172 | 60 |
| 210 Houston St | 0.22mi | 2/1.0 (-1) | 1,182 (-12%) | 2mo | $155,000 | $131 | 59 |
| 1809 Calmes St | 0.66mi | 4/2.0 (+1) | 1,420 (+6%) | 0mo | $45,000 | $32 | 54 |
| 1657 Dauphin St | 0.54mi | 2/2.0 (-1) | 1,509 (+13%) | 2mo | $375,000 | $249 | 47 |
| 1561 Bruister St | 0.54mi | 2/2.0 (-1) | 1,504 (+12%) | 3mo | $330,000 | $219 | 47 |
| 503 Dauphin Island Pkwy | 0.60mi | 2/1.0 (-1) | 1,159 (-13%) | 3mo | $40,500 | $35 | 38 |
Match score weights: distance 35% · size 25% · config 20% · recency 20%. Top-matched comps best support the ARV.
Projected returns pro-forma
-3.0% appreciation · 5.06% rent growth · sell at horizon
- IRR
- -17.9%
- Equity multiple
- 0.36×
- Total profit
- $-39,443
- Equity at exit
- $32,728
- IRR
- -6.8%
- Equity multiple
- 0.53×
- Total profit
- $-28,842
- Equity at exit
- $18,978
Cash invested: $61,460 (down + closing). Projections, not guarantees.
Landlord ↔ Tenant lean methodology
- Overall (STATE)
- 90 Strongly Landlord-Friendly
- State Alabama
- 90 Strongly Landlord-Friendly · R+15
- County
- — inherits STATE
- City
- — inherits STATE
ZIP-level market 36606
- Rents YoY
- 5.1%
- Active inventory
- 175
- Price-to-rent
- 11.0×
Monthly cashflow live
- Estimated rent
- $1,669 high interval (Pro) →
- Mortgage (P&I)
- −$1,151
- Tax from tax record
- −$125 /mo · $1,505/yr
- Insurance
- −$91
- Flood insurance flood zone
- −$66 /mo · $798/yr
- HOA
- −$0
- Vacancy / Maint / Mgmt
- −$350
- Net cashflow
- $-116
Break-even live
Sensitivity live
| Price | -10% $8 | -5% $-54 | +0% $-116 | +5% $-178 | +10% $-240 |
|---|---|---|---|---|---|
| Rent | -10% $-248 | -5% $-182 | +0% $-116 | +5% $-50 | +10% $16 |
| Rate | -1.0pp $-5 | -0.5pp $-60 | base $-116 | +0.5pp $-173 | +1.0pp $-231 |
UW: 25.0% down · 7.5% · 30yr · 1.5% tax · 5.0% vac · 8.0% maint · 8.0% mgmt
Financing live
Cash to close
- Down payment
- $54,875
- Closing costs
- $6,585
- Reserves months
- —
- Total cash needed
- —
Loan-product check · same deal, 3 products live
Conventional
25% down · 7.5% · 30yr
- Down + closing
- —
- Monthly P&I
- —
- Monthly cashflow
- —
- DSCR
- —
- Eligible?
- —
Personal DTI + credit; lowest rate.
DSCR
20% down · 8.5% · 30yr
- Down + closing
- —
- Monthly P&I
- —
- Monthly cashflow
- —
- DSCR
- —
- Eligible?
- —
No personal income docs; deal must DSCR.
Hard money
10% down · 12.0% · 12mo
- Down + closing
- —
- Monthly P&I
- —
- Monthly cashflow
- —
- DSCR
- —
- Eligible?
- —
Short-term bridge; refi at stabilization.
Rent comps 36 comps
| Address | Beds | Baths | Sqft | Rent | $/sqft | DOM | Units | Dist |
|---|---|---|---|---|---|---|---|---|
| 122 Demouy Ave Unit 1/2 Mobile, AL | 2.0 | 1.0 | 1300 | $1,530 | $1.18 | 45d | 1 | 0.01mi |
| 182 Williams St Unit 1043570P Mobile, AL | 3.0 | 1.0 | 1399 | $2,476 | $1.77 | 15d | 1 | 0.30mi |
| 209 S Fulton St Mobile, AL | 2.0 | 1.5 | 1255 | $1,750 | $1.39 | 23d | 1 | 0.34mi |
| 1660 Laurel St Mobile, AL | 3.0 | 2.0 | 1768 | $2,200 | $1.24 | 15d | 1 | 0.35mi |
| 1704 McGill Ave Unit B Mobile, AL | 3.0 | 2.5 | 1500 | $1,750 | $1.17 | 45d | 1 | 0.40mi |
| 107 Macy Pl Mobile, AL | 3.0 | 2.0 | 1800 | $2,250 | $1.25 | 45d | 1 | 0.52mi |
| 129 Shell Road Pl Unit 1043713P Mobile, AL | 4.0 | 2.0 | 1496 | $3,389 | $2.27 | 23d | 1 | 0.63mi |
| 111 S Catherine St Mobile, AL | 2.0 | 1.0 | 891 | $899 | $1.01 | 45d | 1 | 0.66mi |
| 104 Ellinor St Mobile, AL | 2.0 | 1.0 | 896 | $1,275 | $1.42 | 23d | 1 | 0.67mi |
| 1566 Dauphin St Unit Back Carriage House Mobile, AL | 3.0 | 1.0 | 1300 | $1,200 | $0.92 | 45d | 1 | 0.69mi |
| 561 Dauphin Island Pkwy Mobile, AL | 4.0 | 2.0 | 1389 | $1,050 | $0.76 | 45d | 1 | 0.71mi |
| 84 S Lafayette St Unit 1043577P Mobile, AL | 3.0 | 2.0 | 1496 | $3,116 | $2.08 | 15d | 1 | 0.73mi |
| 611 Dauphin Island Pkwy Mobile, AL | 3.0 | 2.0 | 1450 | $1,300 | $0.90 | 45d | 1 | 0.80mi |
| 562 Clarke St Mobile, AL | 2.0 | 1.0 | 1061 | $1,025 | $0.97 | 45d | 1 | 0.81mi |
| 1417 Monroe St Mobile, AL | 2.0 | 1.0 | 1064 | $1,350 | $1.27 | 45d | 1 | 0.86mi |
| 2503 Richard Ave Mobile, AL | 2.0 | 1.0 | 928 | $805 | $0.87 | 15d | 1 | 0.88mi |
| 2507 Taylor Ave Mobile, AL | 3.0 | 1.0 | 1230 | $1,495 | $1.22 | 15d | 1 | 0.90mi |
| 186 Stanton Rd Mobile, AL | 1.0–3.0 | 1.0–2.5 | 1263 | $2,450 | $1.94 | 45d | 1 | 0.93mi |
| 615 Mohawk St Mobile, AL | 3.0 | 1.0 | 1172 | $1,500 | $1.28 | 45d | 1 | 0.95mi |
| 618 Clarke St Mobile, AL | 3.0 | 1.0 | 1427 | $1,200 | $0.84 | 45d | 1 | 0.97mi |
| 706 Cherokee St Mobile, AL | 3.0 | 1.0 | 1260 | $1,375 | $1.09 | 23d | 1 | 0.99mi |
| 107 Grand Blvd Mobile, AL | 2.0 | 2.0 | 1200 | $1,295 | $1.08 | 23d | 1 | 1.00mi |
| 305 Indian Creek Dr E Unit 1043809P Mobile, AL | 3.0 | 2.5 | 1496 | $3,985 | $2.66 | 15d | 1 | 1.00mi |
| 200 S Florida St Unit 101 Mobile, AL | 2.0 | 2.0 | 1150 | $1,375 | $1.20 | 23d | 1 | 1.06mi |
| 2656 Pathway Pl Mobile, AL | 2.0–3.0 | 1.0 | 778 | $1,261 | $1.62 | 15d | 9 | 1.13mi |
| 1141 Montauk Ave Unit 1043864P Mobile, AL | 3.0 | 2.0 | 1420 | $2,741 | $1.93 | 15d | 1 | 1.21mi |
| 2604 Dauphin St Mobile, AL | 2.0 | 1.0 | 950 | $1,072 | $1.13 | 45d | 2 | 1.21mi |
| 2604 Dauphin St #210 Mobile, AL | 2.0 | 1.0 | 950 | $1,150 | $1.21 | 23d | 1 | 1.21mi |
| 57 N Ann St Unit 1043453P Mobile, AL | 2.0 | 2.0 | 1065 | $2,015 | $1.89 | 23d | 1 | 1.23mi |
| 2008 W Victory Dr Mobile, AL | 3.0 | 1.0 | 1011 | $1,200 | $1.19 | 45d | 1 | 1.28mi |
| 713 Iris Ave Mobile, AL | 3.0 | 1.0 | 1617 | $1,300 | $0.80 | 23d | 1 | 1.37mi |
| 2500 Dauphinwood Dr Mobile, AL | 2.0–3.0 | 1.0–2.0 | 1250 | $1,395 | $1.12 | 15d | 19 | 1.37mi |
| 418 Durande Dr Mobile, AL | 3.0 | 2.0 | 1456 | $1,350 | $0.93 | 15d | 1 | 1.41mi |
| 2068 Victory Ct Mobile, AL | 4.0 | 1.0 | 1259 | $1,225 | $0.97 | 45d | 1 | 1.42mi |
| 402 Havens St Mobile, AL | 4.0 | 2.0 | 960 | $1,350 | $1.41 | 15d | 1 | 1.42mi |
| 168 W Collins St Mobile, AL | 3.0 | 1.0 | 968 | $725 | $0.75 | 23d | 1 | 1.48mi |
Listing history 20 events
-
2026-06-21days on market $219,500 Active 106 DOM
-
2026-06-18days on market $219,500 Active 103 DOM
-
2026-06-17days on market $219,500 Active 102 DOM
-
2026-06-16days on market $219,500 Active 101 DOM
-
2026-06-15days on market $219,500 Active 100 DOM
-
2026-06-14days on market $219,500 Active 98 DOM
-
2026-06-13days on market $219,500 Active 97 DOM
-
2026-06-10days on market $219,500 Active 95 DOM
-
2026-06-09days on market $219,500 Active 94 DOM
-
2026-06-08days on market $219,500 Active 93 DOM
-
2026-06-07days on market $219,500 Active 92 DOM
-
2026-06-05days on market $219,500 Active 89 DOM
-
2026-06-03days on market $219,500 Active 88 DOM
-
2026-06-02days on market $219,500 Active 87 DOM
-
2026-06-01days on market $219,500 Active 86 DOM
-
2026-05-31days on market $219,500 Active 85 DOM
-
2026-05-30days on market $219,500 Active 84 DOM
-
2026-04-29price $219,500 433-char remark
Show marketing remark (433 chars)
BEAUTIFULLY UPDATED HOME IN THE HEART OF MIDTOWN MOBILE! Features include new hardwood floors throughout (except for the bathrooms), new paint, updated bathrooms, updated lighting, new vinyl siding, and more. The remodeled kitchen features updated cabinets, counter tops, and appliances. Demouy Avenue has some of the most beautiful older homes in Midtown. Don't miss your opportunity to own one! Call your Realtor 5 minutes ago!
-
2026-03-07$225,000 Active 433-char remark
Show marketing remark (433 chars)
BEAUTIFULLY UPDATED HOME IN THE HEART OF MIDTOWN MOBILE! Features include new hardwood floors throughout (except for the bathrooms), new paint, updated bathrooms, updated lighting, new vinyl siding, and more. The remodeled kitchen features updated cabinets, counter tops, and appliances. Demouy Avenue has some of the most beautiful older homes in Midtown. Don't miss your opportunity to own one! Call your Realtor 5 minutes ago!
-
2019-03-19soldstatus $327,500
ⓘ Source: listings_history table (triggers on properties + properties_extension) + one-shot
backfill from property_details.listing_events for pre-trigger history.
Tax reassessment forecast AL · Resets to sale price
- Current annual tax
- $1,505 · $125/mo
- Projected year-2 tax
- $1,505 · $125/mo
- Expected delta
- $0/yr ($0/mo · 0.0%)
ⓘ Screening estimate from a state-policy table — verify with the county assessor before closing.
Climate risk First Street
- Flood 8/10 Severe FEMA zone X (unshaded) · 99% chance over 30 yrs
- Wildfire 1/10 Low
- Heat 9/10 Extreme 7 d/yr ≥105°F today · 20 d/yr by 30 yrs out
- Wind 9/10 Extreme 99% chance of damaging wind over 30 yrs
- Air quality 2/10 Low 1 unhealthy d/yr today · 1 by 30 yrs out
Nearby sold comps map
Loading sold comps map…
Walkable amenities ~0.75 mi
Loading nearby amenities…
Taxation est. · year 1
- Rental income
- $20,028
- − Mortgage interest
- −$12,295
- − Property taxes
- −$1,505
- − Insurance
- −$1,895
- − Repairs & maintenance
- −$1,602
- − Management
- −$1,602
- − Depreciation
- −$6,385
- Taxable loss
- −$5,257
- Est. tax savings @ 24.0%
- +$1,262
- After-tax cash flow
- $-129/yr
For passive investors: Depreciation is non-cash, so a rental often shows a tax loss while cash-flowing — sheltering income. Rental losses are passive: they offset passive income freely, and up to $25,000/yr can offset ordinary (W-2) income if you actively participate and your MAGI is under $100k (phasing out to $0 by $150k); unused losses carry forward. On sale, claimed depreciation is recaptured at up to 25%, and gains may owe capital-gains tax (a 1031 exchange can defer both). Figures are a year-1 estimate at your 24.0% rate — not tax advice; consult a CPA.
Schools (NCES district)
- District
- Mobile County
- NCES district ID
- 0102370
- Math proficiency
- 15% ▼ -28.00%
- Reading proficiency
- 39% ▬ 0.00%
- Median HH income
- $42,455
- Composite
- 22.9/100
- National rank
- #8002
- State rank
- #81 of 129 in AL
Livability — Mobile
- Score
- 75/100
- State rank
- #20
- US rank
- #4262
Category grades
Schools grade is shown separately in the Schools card above.
Census & demographics
- Census place
- Mobile, AL
- County
- Mobile County · 246,577 people
- City population
- 205,729
- Metro
- Mobile, AL
- Population (ZIP)
- 18,728
- Household income
- $51,303
- Rent vs Own
- Severe rent burden
- 999.0
Population outlook (Mobile County) Hauer SSP2
- Today (2025)
- 415,303 people
- By 2030
- 411,755 · -0.9%
- By 2040
- 399,670 · -3.8%
- By 2050
- 382,616 · -7.9%
- By 2075
- 337,353 · -18.8%
- By 2100
- 283,391 · -31.8%
Race, ethnicity, and origin ACS 2023
- Neighborhood character
- Majority Black (56%)
- Race & ethnicity
- Black 56% White 37% Two or more races 5% Hispanic / Latino 4%
- Common ancestry
- Italian 2% Scottish 2% Lithuanian 1%
- Foreign-born
- 3% · Canada
- Languages at home
- 96% English-only · Spanish 3%
Political lean MEDSL · Mobile
- 2024 margin
- R (+16.4) · D 41.3% · R 57.7%
- 2008→2024 swing
- -7.7pp toward R · 2008: -8.7pp · 2024: -16.4pp
- All cycles
- 2024: R+16.4 2020: R+11.9 2016: R+13.9 2012: R+9.3 2008: R+8.7
Not yet ingested
- Civics
- —
Market trends
- HPI YoY
- ▼ -232.19%
- Current HPI
- 145.9025
- Rent YoY
- ▲ 5.06%
- Metro
- Mobile, AL
- State GDP YoY
- ▲ 2.94%
- F500 in state
- 4
Industry mix (Fortune 500 HQ in AL)
| Industry | F500 HQs | Revenue |
|---|---|---|
| Financial Services | 1 | $8B |
|
||
| Healthcare | 1 | $5B |
|
||
Price history
-33.0% since first listed3 events — show timeline
- 2026-04-29 Price Changed $219,500 GCMLS AL
- 2026-03-07 Listed $225,000 GCMLS AL
- 2019-03-19 Sold (Public Records) $327,500 Public Records
Property tax history
+1.3%/yrLatest (2025): $1,505 · +4.0% YoY. Source: county tax records.
Cash-flow waterfall
monthlySold comps — $/sqft
last 12 mo · ≤1 miLoading sold comps…