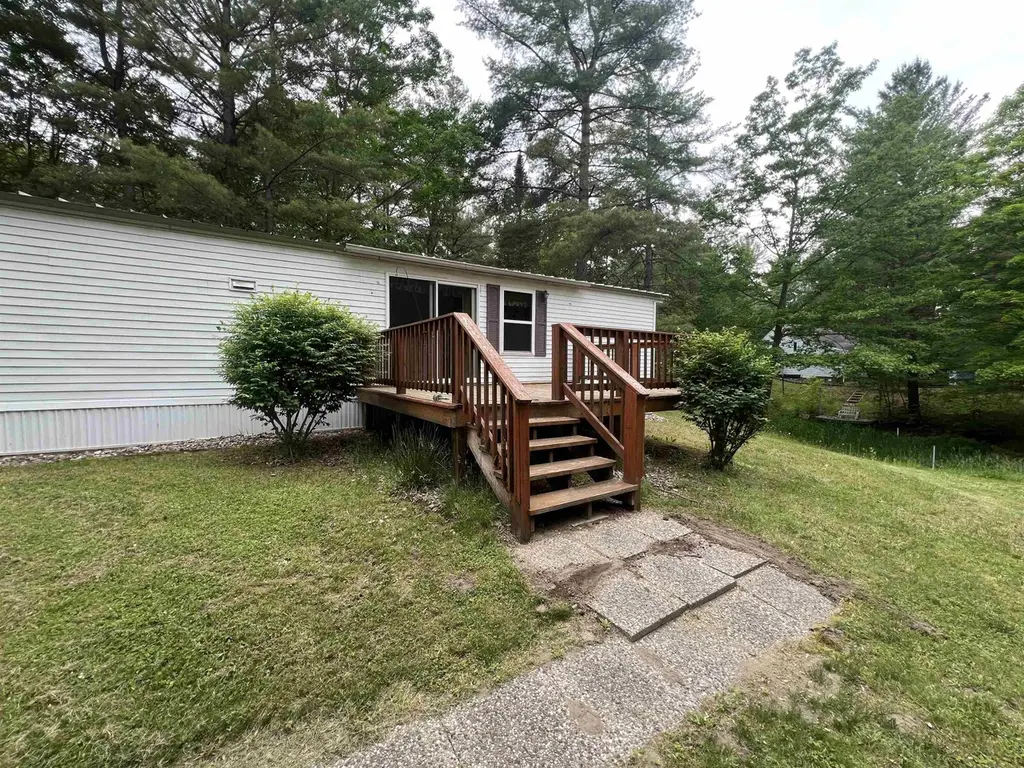
3707 TOWSLEY Ct · Secord, MI
Flood risk 1/10 · Minimal
- FEMA flood zone
- X (unshaded)
- Chance of flooding over 30 yrs
- 0.0%
- Est. flood insurance / yr
- $473 – $860
Fire risk 2/10 · Minimal
- Est. fire insurance / yr
- $784 – $1,456
Heat risk 2/10 · Minimal
- Hot days now (above 95°F)
- 7 days/yr
- Hot days in 30 yrs
- 13 days/yr
Wind risk 1/10 · Minimal
- Chance of severe wind over 30 yrs
- —
Air-quality risk 2/10 · Minimal
- Unhealthy air days now
- 0 days/yr
- Unhealthy air days in 30 yrs
- 1 days/yr
Risk factors via First Street. Map © Google.
Why this score? — see what drove the B- grade
The composite is a weighted blend of 9 inputs, each scored 0–100. Each bar is that input's sub-score; the figure is the points it added to the 100-point composite (weight × sub-score).
- Cash flow +30.0/30.0
- 1% rule +10.0/10.0
- DSCR +10.0/10.0
- ARV discount +7.5/15.0
- Schools +3.3/10.0
- Rent growth +2.5/5.0
- Livability +2.5/5.0
- Condition / age +2.5/5.0
- Appreciation +0.0/10.0
$89,900
🖨 Deal sheet 📄 Offer letter ✓ Due diligence
Listing remarks
WATERFRONT well maintained three bedroom, family owned & maintained immaculate, updraded mobile home on a canal leading to Secord Lake, the lake level is expected to return in 2026. There is a 12 x 24 shed for your yard equipment and toys and 4 x8 tool sheds. Upgrades include All new windows, newer kitchen cabinets and countertop, newer vinyl flooring in the kitchen, utility area & bathroom which has a garden tub, and attractive newer kitchen & dining area light fixtures. Situated on a peaceful Cul-De-Sac with Great Neighbors.
Key facts
- 12 x 24 shed
- 4 x 8 tool sheds
- Waterfront
Tags
Property features AI
Exterior
- Utilities: Shared private well water; Septic system; LP/propane gas
- Home design: Single-wide manufactured home; One-story
- Construction: Built in 1994; Piers foundation
- Exterior features: Vinyl siding; Waterfront property on Secord Lake; 110 feet frontage; Paved street access; Cul-de-sac lot
Interior
- Kitchen: Kitchen area approximately 10 x 12
- Bedrooms: Three bedrooms on the main level — 11 x 12, 10 x 12, and approximately 9 (W=9)
- Bathrooms: One full bathroom on the main level
- Heating & cooling: Forced air heating; LP/propane gas fuel
- Interior features: Living room measuring 15 x 12; Located on a cul-de-sac; On waterfront (Secord Lake)
Neighborhood map
What this means for you Summary
Snapshot
- This is a 3-bed/1.0-bath single-family listed at $90k.
Deal economics
- At list price, monthly cash flow is $1k ($12k/yr) — positive.
- The deal already cash-flows at list — no discount required.
- Meets the 1% rule at list price ($2k rent vs $90k).
- Recommended offer: $87k (3.0% below list) — sets the bar for market timing.
Location & tenants
- Location reads: area grade B — affects rentability + tenant quality, not the cash-flow math above.
- Gladwin Community Schools (town): math 28% / reading 51% proficiency, ranked #232 of 540 in MI (top 43%) — families likely to look elsewhere, expect single-tenant / working-renter base with shorter leases.
- Market conditions: 287 active listings in the ZIP; 90 units permitted in Gladwin County in 2024 (0 in 5+ unit buildings).
Forward outlook
- Local home prices are declining (-3.0%/yr); year-one equity from $622 of loan paydown is wiped out by about $3k of value loss. Plan a longer hold.
- Gladwin County population projected at -25% by 2050 — secular population decline; favor cash flow + early exit over multi-decade hold.
- At projected returns (-3.0% appreciation + 3.0% rent growth), your $25k cash investment doubles in ~3 years — after that, you're playing with house money.
Negotiation context
- It's been on market 49 days — a 3% lower offer ($87k) is reasonable based on typical stale-listing flexibility.
- 3 sale attempts since 2y ago with the ask held roughly flat each time — persistent listings suggest the price (not the market) is what's stuck; bring a comps-based counter.
Questions for the listing agent
- It's been on market 49 days. Have you received any prior offers? Is the seller open to a 3% concession, seller financing, or rate buy-down credit?
- Is there a deadline driving the sale (1031 exchange, divorce, estate, relocation)? That informs how much negotiation room exists.
- What's the average days-on-market for RENTAL listings here right now (not sales)? A rising rental-DOM trend means longer vacancies and softer asking-rent achievability than the comps imply.
- What's the recent tenant-quality profile in this submarket — average credit score on applications, eviction rate, late-payment / NSF rate, and stable-employment percentage? A property-management company in the area should have these aggregated.
- How much new for-sale + rental construction is in the pipeline within 1–3 miles? Heavy new supply typically softens prices + rents 12–24 months out; constrained supply supports both.
Investment metrics
- 1% rule
- 2.23% ✓
- Cap rate
- 19.84%
- Cash-on-cash
- 48.40%
- DSCR
- 3.15
- GRM
- 3.7
CMA / ARV
- ARV (median comp)
- $192,402
- List price
- $89,900
- Delta
- -53.27%
- Verdict
- UNDERPRICED
- Comps
- 17 within 1.0 mi
Show comp detail 4 sales within ~0.75 mi
| Address | Dist | Beds/Ba | Sqft | Sold | Price | $/sf | Match |
|---|---|---|---|---|---|---|---|
| 700 Whispering Pines Rd | 0.06mi | 2/2.0 (-1) | 910 (-2%) | 13mo | $80,000 | $88 | 75 |
| 3796 Pinelands Point Rd | 0.49mi | 2/1.0 (-1) | 920 (-0%) | 20mo | $205,000 | $223 | 54 |
| 3588 Pinelands Pt Rd | 0.60mi | 2/1.0 (-1) | 864 (-6%) | 11mo | $240,000 | $278 | 47 |
| 3814 Pinelands Pt Rd | 0.45mi | 3/2.0 | 1,008 (+9%) | 23mo | $290,000 | $288 | 41 |
Match score weights: distance 35% · size 25% · config 20% · recency 20%. Top-matched comps best support the ARV.
Projected returns pro-forma
-3.0% appreciation · 3.0% rent growth · sell at horizon
- IRR
- 45.9%
- Equity multiple
- 2.99×
- Total profit
- $50,094
- Equity at exit
- $13,404
- IRR
- 51.7%
- Equity multiple
- 6.04×
- Total profit
- $126,883
- Equity at exit
- $7,773
Cash invested: $25,172 (down + closing). Projections, not guarantees.
Landlord ↔ Tenant lean methodology
- Overall (STATE)
- 62 Landlord-Friendly
- State Michigan
- 62 Landlord-Friendly · EVEN
- County
- — inherits STATE
- City
- — inherits STATE
ZIP-level market 48624
- Home prices YoY
- -23.4%
- Active inventory
- 287
- Price-to-rent
- 3.7×
Monthly cashflow live
- Estimated rent
- $2,009 medium interval (Pro) →
- Mortgage (P&I)
- −$471
- Tax from tax record
- −$63 /mo · $751/yr
- Insurance
- −$37
- HOA
- −$0
- Vacancy / Maint / Mgmt
- −$422
- Net cashflow
- $1,015
Break-even live
UW: 25.0% down · 7.5% · 30yr · 1.5% tax · 5.0% vac · 8.0% maint · 8.0% mgmt
Financing live
Cash to close
- Down payment
- $22,475
- Closing costs
- $2,697
- Reserves months
- —
- Total cash needed
- —
Loan-product check · same deal, 3 products live
Conventional
25% down · 7.5% · 30yr
- Down + closing
- —
- Monthly P&I
- —
- Monthly cashflow
- —
- DSCR
- —
- Eligible?
- —
Personal DTI + credit; lowest rate.
DSCR
20% down · 8.5% · 30yr
- Down + closing
- —
- Monthly P&I
- —
- Monthly cashflow
- —
- DSCR
- —
- Eligible?
- —
No personal income docs; deal must DSCR.
Hard money
10% down · 12.0% · 12mo
- Down + closing
- —
- Monthly P&I
- —
- Monthly cashflow
- —
- DSCR
- —
- Eligible?
- —
Short-term bridge; refi at stabilization.
Listing history 21 events
-
2026-06-18days on market $89,900 Active 49 DOM
-
2026-06-17days on market $89,900 Active 48 DOM
-
2026-06-16days on market $89,900 Active 47 DOM
-
2026-06-15days on market $89,900 Active 46 DOM
-
2026-06-13days on market $89,900 Active 44 DOM
-
2026-06-12days on market $89,900 Active 43 DOM
-
2026-06-09days on market $89,900 Active 40 DOM
-
2026-06-08days on market $89,900 Active 39 DOM
-
2026-06-07days on market $89,900 Active 38 DOM
-
2026-06-07days on market $89,900 Active 37 DOM
-
2026-06-04days on market $89,900 Active 34 DOM
-
2026-06-02days on market $89,900 Active 33 DOM
-
2026-06-01days on market $89,900 Active 32 DOM
-
2026-05-31days on market $89,900 Active 31 DOM
-
2026-05-31days on market $89,900 Active 30 DOM
-
2026-04-29$89,900 Active 551-char remark
-
2025-12-13historical
-
2025-06-12$89,900 Active
-
2024-10-02historical
-
2024-06-28price $99,900
-
2024-05-10$129,900 Active
ⓘ Source: listings_history table (triggers on properties + properties_extension) + one-shot
backfill from property_details.listing_events for pre-trigger history.
Tax reassessment forecast MI · Partial reset (capped growth)
- Current annual tax
- $751 · $63/mo
- Projected year-2 tax
- $1,068 · $89/mo
- Expected delta
- +$317/yr (+$26/mo · 42.2%)
ⓘ Screening estimate from a state-policy table — verify with the county assessor before closing.
Climate risk First Street
- Flood 1/10 Low FEMA zone X (unshaded) · 0% chance over 30 yrs
- Wildfire 2/10 Low
- Heat 2/10 Low 7 d/yr ≥95°F today · 13 d/yr by 30 yrs out
- Wind 1/10 Low
- Air quality 2/10 Low 0 unhealthy d/yr today · 1 by 30 yrs out
Nearby sold comps map
Loading sold comps map…
Walkable amenities ~0.75 mi
Loading nearby amenities…
Taxation est. · year 1
- Rental income
- $24,103
- − Mortgage interest
- −$5,036
- − Property taxes
- −$751
- − Insurance
- −$450
- − Repairs & maintenance
- −$1,928
- − Management
- −$1,928
- − Depreciation
- −$2,615
- Taxable income
- $11,394
- Est. tax owed @ 24.0%
- −$2,735
- After-tax cash flow
- $9,448/yr
For passive investors: Depreciation is non-cash, so a rental often shows a tax loss while cash-flowing — sheltering income. Rental losses are passive: they offset passive income freely, and up to $25,000/yr can offset ordinary (W-2) income if you actively participate and your MAGI is under $100k (phasing out to $0 by $150k); unused losses carry forward. On sale, claimed depreciation is recaptured at up to 25%, and gains may owe capital-gains tax (a 1031 exchange can defer both). Figures are a year-1 estimate at your 24.0% rate — not tax advice; consult a CPA.
Schools (NCES district)
- District
- Gladwin Community Schools
- NCES district ID
- 2615990
- Math proficiency
- 28% ▼ -13.00%
- Reading proficiency
- 51% ▼ -2.00%
- Median HH income
- $38,917
- Composite
- 32.93/100
- National rank
- #5595
- State rank
- #232 of 540 in MI
Livability — Secord
No livability data for this city. (Only ~50 U.S. cities are tracked.)
Census & demographics
- Population (ZIP)
- 16,269
Population outlook (Gladwin County) Hauer SSP2
- Today (2025)
- 23,440 people
- By 2030
- 22,281 · -4.9%
- By 2040
- 19,867 · -15.2%
- By 2050
- 17,667 · -24.6%
- By 2075
- 12,909 · -44.9%
- By 2100
- 8,629 · -63.2%
Race, ethnicity, and origin ACS 2023
- Neighborhood character
- Predominantly White (94%)
- Race & ethnicity
- White 94% Two or more races 4% Hispanic / Latino 2%
- Common ancestry
- Romanian 8% Lithuanian 3% Iranian 3%
- Foreign-born
- 1%
- Languages at home
- 95% English-only · German/W. Germanic 4% Spanish 1%
Political lean MEDSL · Gladwin
- 2024 margin
- Solid R (+40.7) · D 29.1% · R 69.8% · Other 1.1%
- 2008→2024 swing
- -42.2pp toward R · 2008: 1.5pp · 2024: -40.7pp
- All cycles
- 2024: R+40.7 2020: R+36.8 2016: R+34.7 2012: R+7.2 2008: D+1.5
Not yet ingested
- Civics
- —
Market trends
- HPI YoY
- ▼ -72.67%
- Current HPI
- 238.0744
- Rent YoY
- —
- Metro
- —
- State GDP YoY
- ▲ 1.37%
- F500 in state
- 28
Industry mix (Fortune 500 HQ in MI)
| Industry | F500 HQs | Revenue |
|---|---|---|
| Automotive Parts | 3 | $48B |
|
||
| Automotive | 2 | $372B |
|
||
| Chemicals | 1 | $45B |
|
||
| Automotive Retail | 1 | $29B |
|
||
| Healthcare / Medical Devices | 1 | $23B |
|
||
| Automotive Technology | 1 | $20B |
|
||
Price history
-30.8% since first listed6 events — show timeline
- 2026-04-29 Listed $89,900 MiRealSource-MiMLS
- 2025-12-13 Listing Removed — MiRealSource-MiMLS
- 2025-06-12 Listed $89,900 MiRealSource-MiMLS
- 2024-10-02 Listing Removed — MiRealSource-MiMLS
- 2024-06-28 Price Changed $99,900 MiRealSource-MiMLS
- 2024-05-10 Listed $129,900 MiRealSource-MiMLS
Property tax history
-7.3%/yrLatest (2025): $751 · -52.4% YoY. Source: county tax records.
Cash-flow waterfall
monthlySold comps — $/sqft
last 12 mo · ≤1 miLoading sold comps…