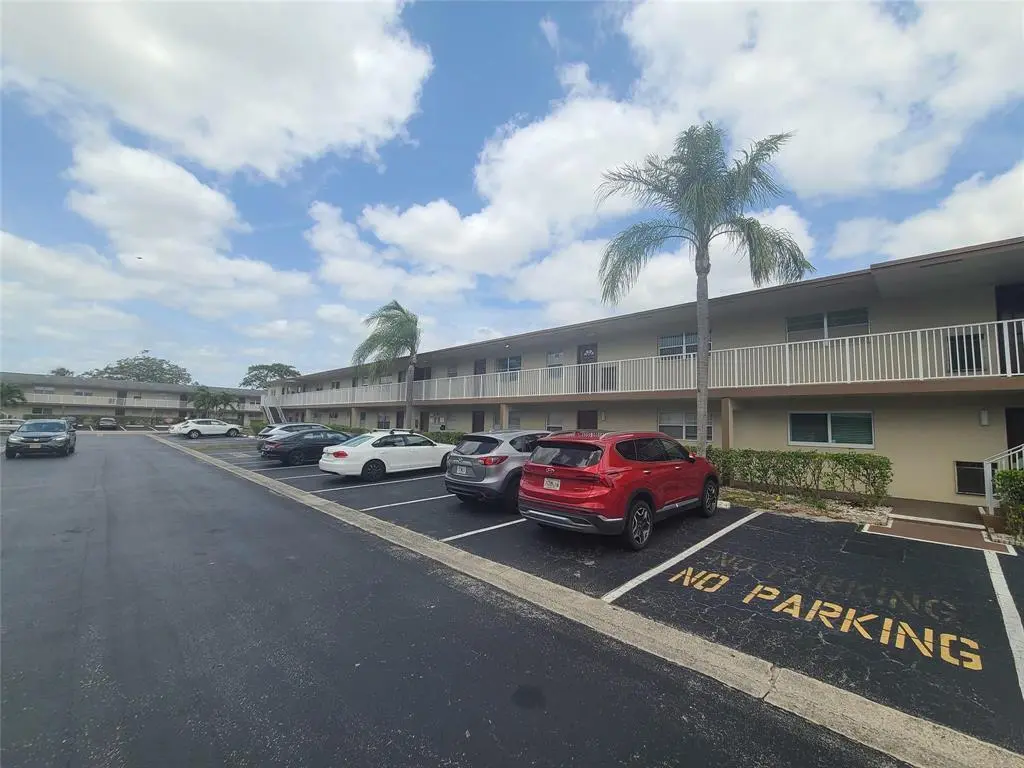
550 NW 78th Ter #205 · Margate, FL
Flood risk 1/10 · Minimal
- FEMA flood zone
- X (shaded)
- Chance of flooding over 30 yrs
- 0.0%
- Est. flood insurance / yr
- $507 – $1,088
Fire risk 1/10 · Minimal
- Est. fire insurance / yr
- $947 – $1,759
Heat risk 9/10 · Severe
- Hot days now (above 106°F)
- 7 days/yr
- Hot days in 30 yrs
- 27 days/yr
Wind risk 10/10 · Severe
- Chance of severe wind over 30 yrs
- 99.0%
Air-quality risk 3/10 · Minor
- Unhealthy air days now
- 3 days/yr
- Unhealthy air days in 30 yrs
- 3 days/yr
Risk factors via First Street. Map © Google.
Why this score? — see what drove the B grade
The composite is a weighted blend of 9 inputs, each scored 0–100. Each bar is that input's sub-score; the figure is the points it added to the 100-point composite (weight × sub-score).
- Cash flow +30.0/30.0
- 1% rule +10.0/10.0
- DSCR +10.0/10.0
- ARV discount +7.5/15.0
- Schools +4.1/10.0
- Livability +4.0/5.0
- Rent growth +3.0/5.0
- Condition / age +2.5/5.0
- Appreciation +0.0/10.0
$55,000
🖨 Deal sheet (PDF) 📄 Offer letter ✓ Due diligence
Listing remarks
This 55+ condo in the heart of Margate offers a fantastic opportunity for those looking to create a space tailored to their specific taste. As a "diamond in the rough, " this unit is perfect for a handy buyer or investor ready to build immediate equity. The interior features a spacious, sun-filled layout that provides a solid foundation for your personalized updates. While the property requires cosmetic work—including flooring, paint, and a kitchen refresh—it is priced to sell and reflects its significant potential. Residents of this quiet community enjoy a relaxed lifestyle with access to excellent amenities like a clubhouse and a sparkling pool. Sold as-is, this repr
Key facts
- Clubhouse
- Spacious layout
- $495 HOA
Tags
Neighborhood map
What this means for you Summary
Snapshot
- This is a 1-bed/1.0-bath condo listed at $55k.
Deal economics
- At list price, monthly cash flow is $372 ($4k/yr) — positive.
- The deal already cash-flows at list — no discount required.
- Meets the 1% rule at list price ($2k rent vs $55k).
- Cap rate 14.4% vs local median 4.3% in Margate — top-decile yield for the area; either an underpriced asset or a hidden risk that comps aren't pricing in. Stress-test before assuming the spread holds.
Location & tenants
- Location reads 81/100 on livability (#85 in FL, #1,398 nationally) — a professional / high-income tenant draw. Strengths: commute A+, housing A+, health & safety A+; Watch: amenities F.
- Broward (suburban): math 42% / reading 53% proficiency, ranked #46 of 73 in FL (top 63%) — families likely to look elsewhere, expect single-tenant / working-renter base with shorter leases.
- Zoned schools: Atlantic West Elementary School (math 28% / reading 42%, grade F, #1,697 of 2,144 statewide, top 80%, 622 students, 77% FRL); Margate Middle School (math 25% / reading 34%, grade F, #469 of 571 statewide, top 84%, 1,094 students, 77% FRL); Coconut Creek High School (math 13% / reading 26%, grade F, #562 of 667 statewide, top 85%, 1,892 students, 72% FRL) — zoned schools average 76% FRL vs 51% district-wide (24 pts higher); higher-poverty schools than district average — tighter screening recommended.
- Zoned-school proficiency averages 28% at this address vs 48% district-wide (-20 pts) — the specific schools serving this property underperform the Broward average; the district grade overstates school quality for this exact location.
- Market conditions: Rents rising (+1.9%/yr); 558 active listings in the ZIP; 22 comparable units currently listed for rent nearby; rentals at typical pace (median 23d on market — plan ~3-4 weeks tenant-placement turnaround); 2,111 units permitted in Broward County in 2024 (1,265 in 5+ unit buildings).
Forward outlook
- Local home prices are declining (-3.0%/yr); year-one equity from $380 of loan paydown is wiped out by about $2k of value loss. Plan a longer hold.
- Broward County population projected at +34% by 2050 — long-run rental-demand tailwind backs the buy-and-hold thesis.
- At projected returns (-3.0% appreciation + 1.9% rent growth), your $15k cash investment doubles in ~5 years — after that, you're playing with house money.
Negotiation context
- Only 12 days on market — expect competitive offers; lowballing is unlikely to land.
- 2 sale attempts with the ask held roughly flat each time — persistent listings suggest the price (not the market) is what's stuck; bring a comps-based counter.
- Current owner paid $33k; list at $55k implies a 67% gain — meaningful room to come down on a strong offer.
Risks & watch-outs
- Watch-outs: HOA is 32% of rent.
- Climate carrying-cost: severe wind risk, 99% chance of damaging wind over 30y; extreme-heat days projected 7→27/yr by 2055 (HVAC capex compounding) — expect insurance premiums to compound above CPI over the hold.
Questions for the listing agent
- Built in 1974 — when were the roof, HVAC, electrical panel, plumbing, and water heater last replaced?
- What does the HOA fee cover, when was the last increase, and are there any pending special assessments or reserve-fund shortfalls?
- Any open or pending special assessments — roof, HVAC, plumbing, elevator, façade? What's the per-unit balance and payoff schedule, and is the seller paying it off at close or rolling it to the buyer?
- Is there a deadline driving the sale (1031 exchange, divorce, estate, relocation)? That informs how much negotiation room exists.
- What's the average days-on-market for RENTAL listings here right now (not sales)? A rising rental-DOM trend means longer vacancies and softer asking-rent achievability than the comps imply.
- What's the recent tenant-quality profile in this submarket — average credit score on applications, eviction rate, late-payment / NSF rate, and stable-employment percentage? A property-management company in the area should have these aggregated.
- How much new apartment / multifamily construction is in the pipeline within 1–3 miles? Heavy new supply (>2% of stock underway) typically softens rents 12–24 months out; light construction supports rent growth.
Investment metrics
- 1% rule
- 2.81% ✓
- Cap rate
- 14.42%
- Cash-on-cash
- 29.01%
- DSCR
- 2.29
- GRM
- 3.0
CMA / ARV
No comps found within radius.
Projected returns pro-forma
-3.0% appreciation · 1.94% rent growth · sell at horizon
- IRR
- 21.8%
- Equity multiple
- 1.88×
- Total profit
- $13,477
- Equity at exit
- $8,201
- IRR
- 28.9%
- Equity multiple
- 3.40×
- Total profit
- $36,975
- Equity at exit
- $4,755
Cash invested: $15,400 (down + closing). Projections, not guarantees.
Landlord ↔ Tenant lean methodology
- Overall (STATE)
- 87 Strongly Landlord-Friendly
- State Florida
- 87 Strongly Landlord-Friendly · R+3
- County
- — inherits STATE
- City
- — inherits STATE
ZIP-level market 33063
- Home prices YoY
- -18.1%
- Rents YoY
- 1.9%
- Active inventory
- 558
- Price-to-rent
- 3.0×
Monthly cashflow live
- Estimated rent
- $1,547 high interval (Pro) →
- Mortgage (P&I)
- −$288
- Tax from tax record
- −$44 /mo · $526/yr
- Insurance
- −$23
- HOA
- −$495
- Vacancy / Maint / Mgmt
- −$325
- Net cashflow
- $372
Break-even live
Sensitivity live
| Price | -10% $403 | -5% $388 | +0% $372 | +5% $357 | +10% $341 |
|---|---|---|---|---|---|
| Rent | -10% $250 | -5% $311 | +0% $372 | +5% $433 | +10% $495 |
| Rate | -1.0pp $400 | -0.5pp $386 | base $372 | +0.5pp $358 | +1.0pp $344 |
UW: 25.0% down · 7.5% · 30yr · 1.5% tax · 5.0% vac · 8.0% maint · 8.0% mgmt
Financing live
Cash to close
- Down payment
- $13,750
- Closing costs
- $1,650
- Reserves months
- —
- Total cash needed
- —
Loan-product check · same deal, 3 products live
Conventional
25% down · 7.5% · 30yr
- Down + closing
- —
- Monthly P&I
- —
- Monthly cashflow
- —
- DSCR
- —
- Eligible?
- —
Personal DTI + credit; lowest rate.
DSCR
20% down · 8.5% · 30yr
- Down + closing
- —
- Monthly P&I
- —
- Monthly cashflow
- —
- DSCR
- —
- Eligible?
- —
No personal income docs; deal must DSCR.
Hard money
10% down · 12.0% · 12mo
- Down + closing
- —
- Monthly P&I
- —
- Monthly cashflow
- —
- DSCR
- —
- Eligible?
- —
Short-term bridge; refi at stabilization.
Rent comps 22 comps
| Address | Beds | Baths | Sqft | Rent | $/sqft | DOM | Units | Dist |
|---|---|---|---|---|---|---|---|---|
| 7605 NW 5th Ct #204 Margate, FL | 1.0 | 1.0 | 670 | $1,350 | $2.01 | 25d | 1 | 0.31mi |
| 7500 NW 5th Pl #204 Margate, FL | 1.0 | 1.0 | 670 | $1,400 | $2.09 | 18d | 1 | 0.36mi |
| 7500 NW 5th Pl #204 Margate, FL | 1.0 | 1.0 | 670 | $1,400 | $2.09 | 25d | 1 | 0.36mi |
| 7305 NW 5th Ct #204 Margate, FL | 1.0 | 1.0 | 670 | $1,375 | $2.05 | 25d | 1 | 0.50mi |
| 7897 Golf Circle Dr Margate, FL | 1.0–2.0 | 1.0–1.5 | 757 | $1,349 | $1.78 | 6d | 2 | 0.53mi |
| 7797 Golf Circle Dr Margate, FL | 1.0–2.0 | 1.0–2.0 | 834 | $1,450 | $1.74 | 5d | 2 | 0.64mi |
| 7807 Golf Circle Dr Margate, FL | 1.0 | 1.0–1.5 | 757 | $1,525 | $2.01 | 22d | 4 | 0.70mi |
| 7807 Golf Circle Dr Margate, FL | 1.0 | 1.0–1.5 | 749 | $1,575 | $2.10 | 18d | 2 | 0.70mi |
| 9000 Ramblewood Dr Apt 605 Coral Springs, FL | 1.0 | 1.0 | 743 | $1,971 | $2.65 | 4d | 1 | 1.02mi |
| 9000 Ramblewood Dr Apt 605 Coral Springs, FL | 1.0 | 1.0 | 743 | $2,208 | $2.97 | 25d | 1 | 1.02mi |
| 7110 Southgate Blvd Tamarac, FL | 1.0 | 1.0 | 550 | $1,600 | $2.91 | 25d | 1 | 1.14mi |
| 7124 Southgate Blvd #7124 Tamarac, FL | 1.0 | 1.0 | 550 | $1,600 | $2.91 | 25d | 1 | 1.15mi |
| 7178 Southgate Blvd #7178 Tamarac, FL | 1.0 | 1.0 | 550 | $1,700 | $3.09 | 25d | 1 | 1.16mi |
| 7220 Southgate Blvd #7220 Tamarac, FL | 1.0 | 1.0 | 550 | $1,700 | $3.09 | 25d | 1 | 1.17mi |
| 400 NW 65th Ave Margate, FL | 1.0–3.0 | 1.0–2.0 | 706 | $1,599 | $2.26 | 0d | 4 | 1.33mi |
| 400 NW 65th Ave Margate, FL | 1.0–3.0 | 1.0–2.0 | 706 | $1,599 | $2.26 | 23d | 4 | 1.33mi |
| 6890 Royal Palm Blvd Unit 209H Margate, FL | 1.0 | 1.5 | 720 | $1,450 | $2.01 | 25d | 1 | 1.41mi |
| 6750 Royal Palm Blvd Unit 209E Margate, FL | 1.0 | 1.5 | 720 | $1,000 | $1.39 | 4d | 1 | 1.46mi |
| 1251 W River Dr Unit 3 Margate, FL | 1.0 | 1.0 | 500 | $1,500 | $3.00 | 15d | 1 | 1.47mi |
| 6670 Royal Palm Blvd Unit 206K Margate, FL | 1.0 | 1.5 | 720 | $1,450 | $2.01 | 3d | 1 | 1.47mi |
| 6670 Royal Palm Blvd Unit 206K Margate, FL | 1.0 | 1.5 | 720 | $1,450 | $2.01 | 25d | 1 | 1.47mi |
| 6670 Royal Palm Blvd Unit 205K Margate, FL | 1.0 | 1.5 | 720 | $1,300 | $1.81 | 4d | 1 | 1.47mi |
HOA detail condo
- Monthly dues
- $495 · $5,940/yr
- Likely covers
- pool
- Assessments
- None detected in remarks — confirm with the listing agent.
Listing history 9 events
-
2026-04-28status Pending
-
2026-04-16$55,000 Active
-
2026-03-20historical
-
2025-04-22$60,000 Active
-
2016-11-16soldstatus $33,000
-
2009-07-24soldstatus $20,000
-
2004-12-01soldstatus $37,000
-
2004-05-27soldstatus $25,000
-
1974-10-01soldstatus $17,500
ⓘ Source: listings_history table (triggers on properties + properties_extension) + one-shot
backfill from property_details.listing_events for pre-trigger history.
Tax reassessment forecast FL · Resets to sale price
- Current annual tax
- $526 · $44/mo
- Projected year-2 tax
- $526 · $44/mo
- Expected delta
- $0/yr ($0/mo · 0.0%)
ⓘ Screening estimate from a state-policy table — verify with the county assessor before closing.
Climate risk First Street
- Flood 1/10 Low FEMA zone X (shaded) · 0% chance over 30 yrs
- Wildfire 1/10 Low
- Heat 9/10 Extreme 7 d/yr ≥106°F today · 27 d/yr by 30 yrs out
- Wind 10/10 Extreme 99% chance of damaging wind over 30 yrs
- Air quality 3/10 Moderate 3 unhealthy d/yr today · 3 by 30 yrs out
Nearby sold comps map
Loading sold comps map…
Walkable amenities ~0.75 mi
Loading nearby amenities…
Taxation est. · year 1
- Rental income
- $18,570
- − Mortgage interest
- −$3,081
- − Property taxes
- −$526
- − Insurance
- −$275
- − Repairs & maintenance
- −$1,486
- − Management
- −$1,486
- − HOA
- −$5,940
- − Depreciation
- −$1,600
- Taxable income
- $4,176
- Est. tax owed @ 24.0%
- −$1,002
- After-tax cash flow
- $3,465/yr
For passive investors: Depreciation is non-cash, so a rental often shows a tax loss while cash-flowing — sheltering income. Rental losses are passive: they offset passive income freely, and up to $25,000/yr can offset ordinary (W-2) income if you actively participate and your MAGI is under $100k (phasing out to $0 by $150k); unused losses carry forward. On sale, claimed depreciation is recaptured at up to 25%, and gains may owe capital-gains tax (a 1031 exchange can defer both). Figures are a year-1 estimate at your 24.0% rate — not tax advice; consult a CPA.
Schools (NCES district)
- District
- Broward
- NCES district ID
- 1200180
- Math proficiency
- 42% ▼ -18.00%
- Reading proficiency
- 53% ▼ -5.00%
- Median HH income
- $52,139
- Composite
- 40.88/100
- National rank
- #3621
- State rank
- #46 of 73 in FL
Livability — Margate
- Score
- 81/100
- State rank
- #85
- US rank
- #1398
Category grades
Schools grade is shown separately in the Schools card above.
Census & demographics
- Census place
- Margate, FL
- County
- Broward County · 1,963,430 people
- City population
- 55,466
- Metro
- Miami-Fort Lauderdale-Pompano Beach, FL
- Population (ZIP)
- 55,466
- Household income
- $62,918
- Rent vs Own
- Severe rent burden
- 2290.0
Population outlook (Broward County) Hauer SSP2
- Today (2025)
- 2,207,033 people
- By 2030
- 2,360,704 · +7.0%
- By 2040
- 2,661,208 · +20.6%
- By 2050
- 2,946,698 · +33.5%
- By 2075
- 3,602,273 · +63.2%
- By 2100
- 3,970,984 · +79.9%
Race, ethnicity, and origin ACS 2023
- Neighborhood character
- Highly diverse neighborhood (Simpson 0.72)
- Race & ethnicity
- White 34% Hispanic / Latino 29% Black 28% Two or more races 18% Asian 4%
- Hispanic origin (detail)
- Mexican 2% Puerto Rican 7% Cuban 3% Dominican 3%
- Common ancestry
- Hispanic 6% Romanian 2% Estonian 2%
- Foreign-born
- 36% · Canada, Jamaica, Vietnam
- Languages at home
- 61% English-only · Spanish 24% French/Haitian/Cajun 7% Other Indo-European 4%
Political lean MEDSL · Broward
- 2024 margin
- D (+17.0) · D 58.0% · R 41.0%
- 2008→2024 swing
- -17.8pp toward R · 2008: 34.7pp · 2024: 17.0pp
- All cycles
- 2024: D+17.0 2020: D+29.8 2016: D+35.0 2012: D+34.9 2008: D+34.7
Not yet ingested
- Civics
- —
Market trends
- HPI YoY
- ▼ -87.17%
- Current HPI
- 393.9225
- Rent YoY
- ▲ 1.94%
- Metro
- Miami-Fort Lauderdale-Pompano Beach, FL
- State GDP YoY
- ▲ 3.28%
- F500 in state
- 36
Industry mix (Fortune 500 HQ in FL)
| Industry | F500 HQs | Revenue |
|---|---|---|
| Industrial Technology | 2 | $29B |
|
||
| Insurance | 2 | $17B |
|
||
| Retail | 1 | $60B |
|
||
| Technology Distribution | 1 | $58B |
|
||
| Homebuilding | 1 | $35B |
|
||
| Technology Manufacturing | 1 | $35B |
|
||
Price history
+214.3% since first listed9 events — show timeline
- 2026-04-28 Pending — Beaches MLS
- 2026-04-16 Listed $55,000 Beaches MLS
- 2026-03-20 Listing Removed — Beaches MLS
- 2025-04-22 Listed $60,000 Beaches MLS
- 2016-11-16 Sold (Public Records) $33,000 Public Records
- 2009-07-24 Sold (Public Records) $20,000 Public Records
- 2004-12-01 Sold (Public Records) $37,000 Public Records
- 2004-05-27 Sold (Public Records) $25,000 Public Records
- 1974-10-01 Sold (Public Records) $17,500 Public Records
Property tax history
-2.2%/yrLatest (2025): $526 · +4.0% YoY. Source: county tax records.
Cash-flow waterfall
monthlySold comps — $/sqft
last 12 mo · ≤1 miLoading sold comps…