200 Berkley Rd #202 · Hollywood, FL
Flood risk No data
- FEMA flood zone
- —
- Chance of flooding over 30 yrs
- —
- Est. flood insurance / yr
- —
Fire risk No data
- Est. fire insurance / yr
- —
Heat risk No data
- Hot days now (above threshold)
- —
- Hot days in 30 yrs
- —
Wind risk No data
- Chance of severe wind over 30 yrs
- —
Air-quality risk No data
- Unhealthy air days now
- —
- Unhealthy air days in 30 yrs
- —
Risk factors via First Street. Map © Google.
Why this score? — see what drove the D+ grade
The composite is a weighted blend of 9 inputs, each scored 0–100. Each bar is that input's sub-score; the figure is the points it added to the 100-point composite (weight × sub-score).
- Cash flow +13.0/30.0
- 1% rule +10.0/10.0
- ARV discount +7.5/15.0
- Schools +4.1/10.0
- DSCR +3.9/10.0
- Livability +3.8/5.0
- Rent growth +2.8/5.0
- Condition / age +2.5/5.0
- Appreciation +0.0/10.0
$145,000
🖨 Deal sheet 📄 Offer letter ✓ Due diligence
Key facts
- $545 HOA
- Parking
- Community pool
Property features AI
Finance
- Other: Senior community
- Financial info: Not a land lease property; Pets allowed (call for details)
- HOA & community: Association dues assessed monthly; HOA includes insurance, sewer, water, common area maintenance, and roof repairs; Community amenities: fitness center, game room, laundry, parking, pool, spa/hot tub, shuffleboard court, pickleball courts, sidewalks, maintained community
Exterior
- Parking: 1 parking space; No carport
- Security: Gated community
- Utilities: Public water; Public sewer; 150 amp electrical service; Cable connected; Electricity connected; Water available
- Home design: Condominium; 2 total stories; unit entry on the 2nd floor; Resale condition; Faces east
- Construction: Concrete block construction with stucco; Shingle roof; Block foundation; Built as part of a multi-story building
- Exterior features: Covered patio; Screened patio; Patio
Interior
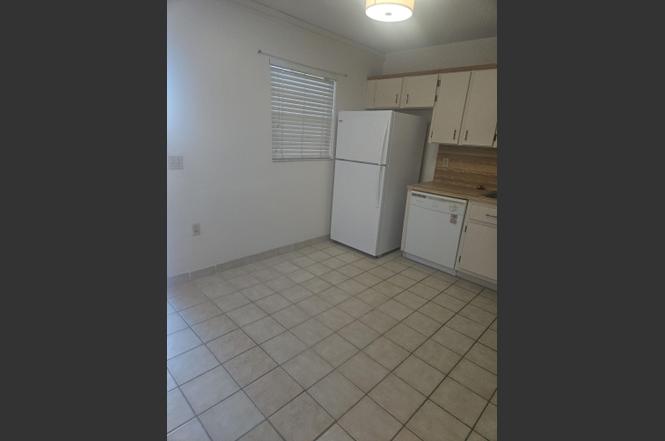
- Kitchen: Electric range; Built-in microwave; Dishwasher; Garbage disposal; Refrigerator; Electric water heater
- Bedrooms: 2 bedrooms on the main level
- Flooring: Ceramic tile; Wood
- Bathrooms: 2 full bathrooms
- Heating & cooling: Central heating; Central air conditioning
- Interior features: No special interior features listed
- Laundry & utility: Common area laundry
Neighborhood map
What this means for you Summary
Snapshot
- This is a 2-bed/2.0-bath condo listed at $145k.
Deal economics
- At list price, monthly cash flow is $-9 ($-109/yr) — negative.
- To cash-flow at today's rent, offer at most $143k (1.1% below list).
- Meets the 1% rule at list price ($2k rent vs $145k).
- Recommended offer: $143k (1.1% below list) — sets the bar for cash-flow.
- Cap rate 6.2% vs local median 3.2% in Hollywood — top-decile yield for the area; either an underpriced asset or a hidden risk that comps aren't pricing in. Stress-test before assuming the spread holds.
Location & tenants
- Location reads 76/100 on livability (#232 in FL, #3,548 nationally) — a middle-class / working-renter tenant base. Strengths: commute A+, housing A+, crime B+; Watch: amenities D.
- Broward (suburban): math 42% / reading 53% proficiency, ranked #46 of 73 in FL (top 63%) — families likely to look elsewhere, expect single-tenant / working-renter base with shorter leases.
- Zoned schools: Driftwood Elementary School (math 26% / reading 41%, grade F, #1,758 of 2,144 statewide, top 83%, 522 students, 73% FRL); Driftwood Middle School (math 34% / reading 45%, grade F, #373 of 571 statewide, top 66%, 1,136 students, 71% FRL); Hollywood Hills High School (math 14% / reading 31%, grade F, #539 of 667 statewide, top 81%, 1,718 students, 68% FRL) — zoned schools average 71% FRL vs 51% district-wide (19 pts higher); higher-poverty schools than district average — tighter screening recommended.
- Zoned-school proficiency averages 32% at this address vs 48% district-wide (-16 pts) — the specific schools serving this property underperform the Broward average; the district grade overstates school quality for this exact location.
- Market conditions: Rents rising (+1.0%/yr); 326 active listings in the ZIP; 40 comparable units currently listed for rent nearby; rentals at typical pace (median 21d on market — plan ~3-4 weeks tenant-placement turnaround); solid renter incomes; 2,111 units permitted in Broward County in 2024 (1,265 in 5+ unit buildings).
- This rent runs 33% of the median local income ($80k/yr) — at the standard rent-burdened threshold; future hikes will face affordability resistance.
Forward outlook
- Local home prices are declining (-3.0%/yr); year-one equity from $1k of loan paydown is wiped out by about $4k of value loss. Plan a longer hold.
- Broward County population projected at +34% by 2050 — long-run rental-demand tailwind backs the buy-and-hold thesis.
Negotiation context
- Only 2 days on market — expect competitive offers; lowballing is unlikely to land.
- Current owner paid $98k; 47% above their basis — modest negotiation headroom, anchor on the comps not their cost.
Risks & watch-outs
- Watch-outs: property tax is 3.0% of price; HOA is 25% of rent.
Questions for the listing agent
- What do current leases actually rent for vs. the listed asking? Can we see a recent rent roll and the last 12 months of T-12 income?
- Property tax is high relative to price — has the assessment been appealed recently, and will the sale trigger a re-assessment?
- What does the HOA fee cover, when was the last increase, and are there any pending special assessments or reserve-fund shortfalls?
- Any open or pending special assessments — roof, HVAC, plumbing, elevator, façade? What's the per-unit balance and payoff schedule, and is the seller paying it off at close or rolling it to the buyer?
- Is there a deadline driving the sale (1031 exchange, divorce, estate, relocation)? That informs how much negotiation room exists.
- The area grade is low — what's the realistic commute time and amenity access for the typical tenant pool here? Any planned neighborhood developments (good or bad) we should know about?
- What's the average days-on-market for RENTAL listings here right now (not sales)? A rising rental-DOM trend means longer vacancies and softer asking-rent achievability than the comps imply.
- What's the recent tenant-quality profile in this submarket — average credit score on applications, eviction rate, late-payment / NSF rate, and stable-employment percentage? A property-management company in the area should have these aggregated.
- How much new apartment / multifamily construction is in the pipeline within 1–3 miles? Heavy new supply (>2% of stock underway) typically softens rents 12–24 months out; light construction supports rent growth.
Investment metrics
- 1% rule
- 1.50% ✓
- Cap rate
- 6.22%
- Cash-on-cash
- -0.27%
- DSCR
- 0.99
- GRM
- 5.5
CMA / ARV
No comps found within radius.
Projected returns pro-forma
-3.0% appreciation · 1.01% rent growth · sell at horizon
- IRR
- -20.3%
- Equity multiple
- 0.31×
- Total profit
- $-27,874
- Equity at exit
- $21,620
- IRR
- -22.8%
- Equity multiple
- 0.02×
- Total profit
- $-39,937
- Equity at exit
- $12,537
Cash invested: $40,600 (down + closing). Projections, not guarantees.
Landlord ↔ Tenant lean methodology
- Overall (STATE)
- 87 Strongly Landlord-Friendly
- State Florida
- 87 Strongly Landlord-Friendly · R+3
- County
- — inherits STATE
- City
- — inherits STATE
ZIP-level market 33024
- Rents YoY
- 1.0%
- Active inventory
- 326
- Price-to-rent
- 5.5×
Monthly cashflow live
- Estimated rent
- $2,180 high interval (Pro) →
- Mortgage (P&I)
- −$760
- Tax from tax record
- −$365 /mo · $4,382/yr
- Insurance
- −$60
- HOA
- −$545
- Vacancy / Maint / Mgmt
- −$458
- Net cashflow
- $-9
Break-even live
UW: 25.0% down · 7.5% · 30yr · 1.5% tax · 5.0% vac · 8.0% maint · 8.0% mgmt
Financing live
Cash to close
- Down payment
- $36,250
- Closing costs
- $4,350
- Reserves months
- —
- Total cash needed
- —
Loan-product check · same deal, 3 products live
Conventional
25% down · 7.5% · 30yr
- Down + closing
- —
- Monthly P&I
- —
- Monthly cashflow
- —
- DSCR
- —
- Eligible?
- —
Personal DTI + credit; lowest rate.
DSCR
20% down · 8.5% · 30yr
- Down + closing
- —
- Monthly P&I
- —
- Monthly cashflow
- —
- DSCR
- —
- Eligible?
- —
No personal income docs; deal must DSCR.
Hard money
10% down · 12.0% · 12mo
- Down + closing
- —
- Monthly P&I
- —
- Monthly cashflow
- —
- DSCR
- —
- Eligible?
- —
Short-term bridge; refi at stabilization.
Rent comps 40 comps
| Address | Beds | Baths | Sqft | Rent | $/sqft | DOM | Units | Dist |
|---|---|---|---|---|---|---|---|---|
| 251 Berkley Rd #209 Hollywood, FL | 1.0 | 1.5 | 650 | $1,600 | $2.46 | 2d | 1 | 0.04mi |
| 251 Berkley Rd #209 Hollywood, FL | 1.0 | 1.5 | 650 | $1,600 | $2.46 | 24d | 1 | 0.04mi |
| 200 Ashbury Rd #209 Hollywood, FL | 1.0 | 1.5 | 920 | $1,450 | $1.58 | 24d | 1 | 0.05mi |
| 301 Cambridge Rd #301 Hollywood, FL | 2.0 | 2.0 | 920 | $1,850 | $2.01 | 20d | 1 | 0.08mi |
| 300 Berkley Rd #212 Hollywood, FL | 2.0 | 2.0 | 920 | $1,995 | $2.17 | 24d | 1 | 0.11mi |
| 100 Ashbury Rd Hollywood, FL | 1.0–2.0 | 1.5–2.0 | 840 | $2,400 | $2.86 | 20d | 2 | 0.14mi |
| 100 Ashbury Rd Hollywood, FL | 1.0–2.0 | 1.5–2.0 | 840 | $2,400 | $2.86 | 5d | 2 | 0.14mi |
| 322 Briarwood Cir Unit 1-17 Hollywood, FL | 2.0 | 2.0 | 1030 | $2,500 | $2.43 | 13d | 1 | 0.14mi |
| 6243 Garden Ct Davie, FL | 2.0 | 2.0 | 950 | $2,375 | $2.50 | 24d | 1 | 0.22mi |
| 6249 Garden Ct Davie, FL | 2.0 | 2.0 | 950 | $2,399 | $2.53 | 16d | 1 | 0.23mi |
| 100 Gate Rd Unit 3-63 Hollywood, FL | 2.0 | 2.0 | 1000 | $2,300 | $2.30 | 14d | 1 | 0.25mi |
| 200 Gate Rd #102 Hollywood, FL | 2.0 | 2.0 | 1015 | $1,850 | $1.82 | 24d | 1 | 0.33mi |
| 7400 Stirling Rd Hollywood, FL | 2.0 | 1.0 | 610 | $2,118 | $3.47 | 7d | 11 | 0.52mi |
| 7420 Stirling Rd Hollywood, FL | 2.0 | 2.0 | 925 | $2,195 | $2.37 | 4d | 1 | 0.61mi |
| 6420 Oak St Hollywood, FL | 3.0 | 2.0 | 1028 | $3,500 | $3.40 | 24d | 1 | 0.63mi |
| 6420 Oak St Hollywood, FL | 2.0 | 1.0 | 1027 | $3,500 | $3.41 | 20d | 1 | 0.63mi |
| 7550 Stirling Rd Hollywood, FL | 1.0–2.0 | 1.0–2.0 | 872 | $2,295 | $2.63 | 1d | 7 | 0.70mi |
| 7025 Stirling Rd Davie, FL | 1.0–3.0 | 1.0–2.0 | 1044 | $2,696 | $2.58 | 2d | 17 | 0.75mi |
| 3300 El Jardin Dr Hollywood, FL | 2.0 | 1.0 | 864 | $2,000 | $2.31 | 24d | 1 | 0.80mi |
| 7608 NW 38th Ct #14 Hollywood, FL | 2.0 | 2.0 | 831 | $2,450 | $2.95 | 24d | 1 | 0.83mi |
| 7610 Stirling Rd Unit 204C Hollywood, FL | 1.0 | 1.0 | 750 | $1,675 | $2.23 | 14d | 1 | 0.84mi |
| 7610 Stirling Rd Hollywood, FL | 1.0 | 1.0 | 750 | $1,675 | $2.23 | 24d | 2 | 0.84mi |
| 7541 Atlanta St #7541 Hollywood, FL | 3.0 | 2.0 | 1056 | $2,700 | $2.56 | 24d | 1 | 0.95mi |
| 5100 SW 64th Ave Davie, FL | 2.0 | 2.0 | 990 | $2,122 | $2.14 | 24d | 2 | 0.98mi |
| 5100 SW 64th Ave #106 Davie, FL | 2.0 | 2.0 | 990 | $2,250 | $2.27 | 3d | 1 | 0.98mi |
| 5100 SW 64th Ave #106 Davie, FL | 2.0 | 2.0 | 990 | $2,350 | $2.37 | 21d | 1 | 0.98mi |
| 5060 SW 64th Ave #102 Davie, FL | 2.0 | 2.0 | 742 | $2,150 | $2.90 | 24d | 1 | 1.02mi |
| 5080 SW 64th Ave #208 Davie, FL | 2.0 | 2.0 | 990 | $2,200 | $2.22 | 10d | 1 | 1.04mi |
| 5080 SW 64th Ave #208 Davie, FL | 2.0 | 2.0 | 990 | $2,200 | $2.22 | 15d | 1 | 1.04mi |
| 6791 Scott St Hollywood, FL | 3.0 | 2.0 | 886 | $3,300 | $3.72 | 1d | 1 | 1.06mi |
| 6791 Scott St Unit 6791 Hollywood, FL | 3.0 | 2.0 | 886 | $3,400 | $3.84 | 24d | 1 | 1.06mi |
| 6560 SW 49th St Unit 2 Davie, FL | 1.0 | 1.0 | 1000 | $1,800 | $1.80 | 3d | 1 | 1.18mi |
| 3211 Sabal Palm Mnr #105 Hollywood, FL | 2.0 | 2.0 | 942 | $1,666 | $1.77 | 24d | 1 | 1.19mi |
| 6193 SW 48th Ct Unit 6193 Davie, FL | 2.0 | 2.0 | 1075 | $2,600 | $2.42 | 10d | 1 | 1.19mi |
| 6193 SW 48th Ct Unit 6193 Davie, FL | 2.0 | 2.0 | 1075 | $2,550 | $2.37 | 2d | 1 | 1.19mi |
| 4785 SW 62nd Ave #102 Davie, FL | 2.0 | 2.0 | 965 | $2,175 | $2.25 | 5d | 1 | 1.23mi |
| 3271 Sabal Palm Mnr #103 Hollywood, FL | 2.0 | 2.0 | 942 | $2,100 | $2.23 | 24d | 1 | 1.25mi |
| 4775 SW 62nd Ave #102 Davie, FL | 2.0 | 2.0 | 965 | $1,950 | $2.02 | 24d | 1 | 1.26mi |
| 3241 Sabal Palm Mnr #104 Hollywood, FL | 2.0 | 2.0 | 942 | $2,150 | $2.28 | 24d | 1 | 1.26mi |
| 7851 Raleigh St Hollywood, FL | 3.0 | 2.0 | 1008 | $3,400 | $3.37 | 17d | 1 | 1.35mi |
HOA detail condo
- Monthly dues
- $545 · $6,540/yr
- Assessments
- None detected in remarks — confirm with the listing agent.
Listing history 2 events
-
2026-06-18days on market $145,000 Active 2 DOM
-
2026-06-17$145,000 Active 1 DOM
ⓘ Source: listings_history table (triggers on properties + properties_extension) + one-shot
backfill from property_details.listing_events for pre-trigger history.
Tax reassessment forecast FL · Resets to sale price
- Current annual tax
- $4,382 · $365/mo
- Projected year-2 tax
- $4,382 · $365/mo
- Expected delta
- $0/yr ($0/mo · 0.0%)
ⓘ Screening estimate from a state-policy table — verify with the county assessor before closing.
Nearby sold comps map
Loading sold comps map…
Walkable amenities ~0.75 mi
Loading nearby amenities…
Taxation est. · year 1
- Rental income
- $26,156
- − Mortgage interest
- −$8,122
- − Property taxes
- −$4,382
- − Insurance
- −$725
- − Repairs & maintenance
- −$2,092
- − Management
- −$2,092
- − HOA
- −$6,540
- − Depreciation
- −$4,218
- Taxable loss
- −$2,017
- Est. tax savings @ 24.0%
- +$484
- After-tax cash flow
- $375/yr
For passive investors: Depreciation is non-cash, so a rental often shows a tax loss while cash-flowing — sheltering income. Rental losses are passive: they offset passive income freely, and up to $25,000/yr can offset ordinary (W-2) income if you actively participate and your MAGI is under $100k (phasing out to $0 by $150k); unused losses carry forward. On sale, claimed depreciation is recaptured at up to 25%, and gains may owe capital-gains tax (a 1031 exchange can defer both). Figures are a year-1 estimate at your 24.0% rate — not tax advice; consult a CPA.
Schools (NCES district)
- District
- Broward
- NCES district ID
- 1200180
- Math proficiency
- 42% ▼ -18.00%
- Reading proficiency
- 53% ▼ -5.00%
- Median HH income
- $52,139
- Composite
- 40.88/100
- National rank
- #3621
- State rank
- #46 of 73 in FL
Livability — Hollywood
- Score
- 76/100
- State rank
- #232
- US rank
- #3548
Category grades
Schools grade is shown separately in the Schools card above.
Census & demographics
- Census place
- Hollywood, FL
- County
- Broward County · 1,963,430 people
- City population
- 109,079
- Metro
- Miami-Fort Lauderdale-Pompano Beach, FL
- Population (ZIP)
- 76,585
- Household income
- $80,061
- Rent vs Own
- Severe rent burden
- 2813.0
Population outlook (Broward County) Hauer SSP2
- Today (2025)
- 2,207,033 people
- By 2030
- 2,360,704 · +7.0%
- By 2040
- 2,661,208 · +20.6%
- By 2050
- 2,946,698 · +33.5%
- By 2075
- 3,602,273 · +63.2%
- By 2100
- 3,970,984 · +79.9%
Race, ethnicity, and origin ACS 2023
- Neighborhood character
- Diverse neighborhood (Simpson 0.65)
- Race & ethnicity
- Hispanic / Latino 52% Two or more races 23% White 22% Black 17% Asian 4%
- Hispanic origin (detail)
- Mexican 3% Puerto Rican 7% Cuban 13% Dominican 5%
- Common ancestry
- Hispanic 4% Romanian 2% Estonian 1%
- Foreign-born
- 40% · Canada, Jamaica, Dominican Republic
- Languages at home
- 44% English-only · Spanish 46% French/Haitian/Cajun 5% Other Indo-European 3%
Political lean MEDSL · Broward
- 2024 margin
- D (+17.0) · D 58.0% · R 41.0%
- 2008→2024 swing
- -17.8pp toward R · 2008: 34.7pp · 2024: 17.0pp
- All cycles
- 2024: D+17.0 2020: D+29.8 2016: D+35.0 2012: D+34.9 2008: D+34.7
Not yet ingested
- Civics
- —
Market trends
- HPI YoY
- ▼ -442.20%
- Current HPI
- 464.3405
- Rent YoY
- ▲ 1.01%
- Metro
- Miami-Fort Lauderdale-Pompano Beach, FL
- State GDP YoY
- ▲ 3.28%
- F500 in state
- 36
Industry mix (Fortune 500 HQ in FL)
| Industry | F500 HQs | Revenue |
|---|---|---|
| Industrial Technology | 2 | $29B |
|
||
| Insurance | 2 | $17B |
|
||
| Retail | 1 | $60B |
|
||
| Technology Distribution | 1 | $58B |
|
||
| Homebuilding | 1 | $35B |
|
||
| Technology Manufacturing | 1 | $35B |
|
||
Price history
+218.7% since first listed4 events — show timeline
- 2026-06-16 Listed $145,000 Beaches MLS
- 2004-09-24 Sold (Public Records) $98,500 Public Records
- 2000-11-07 Sold (Public Records) $49,000 Public Records
- 1980-11-01 Sold (Public Records) $45,500 Public Records
Property tax history
+22.4%/yrLatest (2025): $4,382 · +503.3% YoY. Source: county tax records.
Cash-flow waterfall
monthlySold comps — $/sqft
last 12 mo · ≤1 miLoading sold comps…