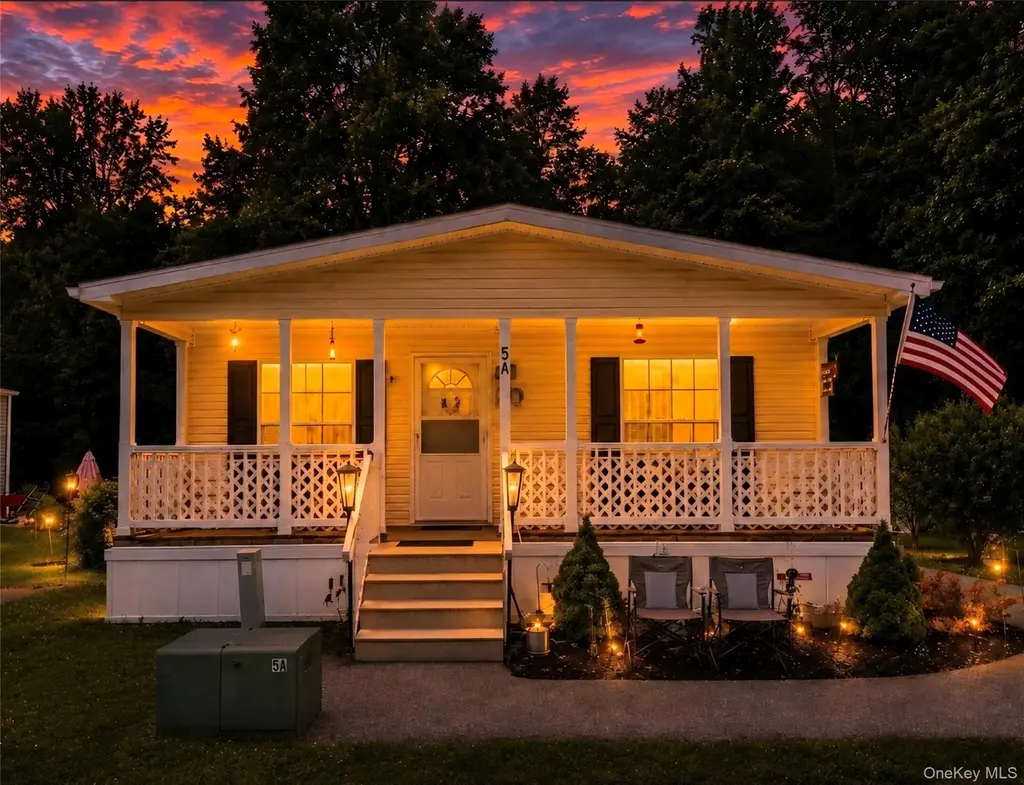
575 Creek Rd Unit 5A · Haviland, NY
Flood risk 1/10 · Minimal
- FEMA flood zone
- X (unshaded)
- Chance of flooding over 30 yrs
- 0.0%
- Est. flood insurance / yr
- $473 – $860
Fire risk 4/10 · Minor
- Est. fire insurance / yr
- $691 – $1,283
Heat risk 4/10 · Minor
- Hot days now (above 98°F)
- 7 days/yr
- Hot days in 30 yrs
- 15 days/yr
Wind risk 4/10 · Minor
- Chance of severe wind over 30 yrs
- 11.0%
Air-quality risk 2/10 · Minimal
- Unhealthy air days now
- 1 days/yr
- Unhealthy air days in 30 yrs
- 2 days/yr
Risk factors via First Street. Map © Google.
Why this score? — see what drove the D+ grade
The composite is a weighted blend of 9 inputs, each scored 0–100. Each bar is that input's sub-score; the figure is the points it added to the 100-point composite (weight × sub-score).
- Cash flow +12.9/30.0
- 1% rule +9.9/10.0
- ARV discount +7.5/15.0
- Schools +4.7/10.0
- DSCR +3.9/10.0
- Condition / age +3.8/5.0
- Rent growth +3.4/5.0
- Livability +3.2/5.0
- Appreciation +0.0/10.0
$150,000
🖨 Deal sheet (PDF) 📄 Offer letter ✓ Due diligence
Listing remarks
Welcome to this well-maintained 2020 mobile home offered by its original owners and located in the Elgen Homes Community. With 2 bedrooms, 2 full bathrooms, and approximately 1,100 square feet, this home combines modern construction with comfortable single-level living. The inviting covered front porch creates a welcoming entry, while the landscaped exterior, storage sheds, and wooded backdrop add to the property's appeal. Inside, buyers searching for a home with an updated kitchen will appreciate the spacious layout featuring rich wood cabinetry, stainless steel appliances, ample storage, and a large center island that serves as both a prep space and gathering area. The open-concept living
Key facts
- Covered front porch
- Large center island
- Updated kitchen
Tags
Property features AI
Finance
- HOA & community: Has association; Association fee $742 monthly; Association covers sewer, snow removal, and trash
Exterior
- Parking: Driveway (no carport)
- Utilities: Public sewer; Private trash collection
- Home design: Mobile home
- Construction: Vinyl siding construction
- Exterior features: Vinyl siding; Barn(s); Not waterfront
Interior
- Kitchen: Eat-in kitchen; Appliances: Other
- Bedrooms: Includes a first-floor bedroom
- Flooring: Hardwood flooring; Laminate flooring
- Bathrooms: 2 full bathrooms
- Heating & cooling: Central air conditioning; Electric heating; Forced air; Oil heating
- Interior features: First-floor bedroom; First-floor full bathroom; Ceiling fans; Eat-in kitchen; Recessed lighting; Porch
- Laundry & utility: No basement
Neighborhood map
What this means for you Summary
Snapshot
- This is a 2-bed/2.0-bath manufactured listed at $150k. Condition is rated good.
Deal economics
- At list price, monthly cash flow is $-10 ($-118/yr) — negative.
- To cash-flow at today's rent, offer at most $149k (0.9% below list).
- Meets the 1% rule at list price ($2k rent vs $150k).
- Recommended offer: $149k (0.9% below list) — sets the bar for cash-flow.
- Cap rate 6.2% vs local median 4.2% in Haviland — top-decile yield for the area; either an underpriced asset or a hidden risk that comps aren't pricing in. Stress-test before assuming the spread holds.
Location & tenants
- Location reads 65/100 on livability (#712 in NY) — a middle-class / working-renter tenant base. Strengths: housing A+, crime A-, employment A-; Watch: cost of living C-, amenities F, commute F.
- Hyde Park Central School District (rural): math 43% / reading 62% proficiency, ranked #316 of 590 in NY (top 54%) — acceptable for families but not a draw, mixed tenant base, ~2y average lease.
- Zoned schools: Ralph R Smith School (math 22% / reading 32%, grade F, #1,786 of 2,108 statewide, top 86%, 340 students, 54% FRL); Haviland Middle School (math 23% / reading 57%, grade F, #413 of 729 statewide, top 57%, 759 students, 59% FRL); Franklin D Roosevelt Senior High School (math 93% / reading 90%, grade A+, #197 of 1,100 statewide, top 18%, 1,136 students, 52% FRL) — zoned schools average 55% FRL vs 34% district-wide (21 pts higher); higher-poverty schools than district average — tighter screening recommended.
- Market conditions: Rents rising (+3.7%/yr); 195 active listings in the ZIP; 2 comparable units currently listed for rent nearby; 620 units permitted in Dutchess County in 2024 (242 in 5+ unit buildings).
- This rent runs 42% of the median local income ($64k/yr) — at the standard rent-burdened threshold; future hikes will face affordability resistance.
Forward outlook
- Local home prices are declining (-3.0%/yr); year-one equity from $1k of loan paydown is wiped out by about $4k of value loss. Plan a longer hold.
- Dutchess County population projected at -11% by 2050 — secular population decline; favor cash flow + early exit over multi-decade hold.
Negotiation context
- Only 4 days on market — expect competitive offers; lowballing is unlikely to land.
Risks & watch-outs
- Watch-outs: HOA is 33% of rent.
Questions for the listing agent
- What do current leases actually rent for vs. the listed asking? Can we see a recent rent roll and the last 12 months of T-12 income?
- What does the HOA fee cover, when was the last increase, and are there any pending special assessments or reserve-fund shortfalls?
- Is there a deadline driving the sale (1031 exchange, divorce, estate, relocation)? That informs how much negotiation room exists.
- The area grade is low — what's the realistic commute time and amenity access for the typical tenant pool here? Any planned neighborhood developments (good or bad) we should know about?
- What's the average days-on-market for RENTAL listings here right now (not sales)? A rising rental-DOM trend means longer vacancies and softer asking-rent achievability than the comps imply.
- What's the recent tenant-quality profile in this submarket — average credit score on applications, eviction rate, late-payment / NSF rate, and stable-employment percentage? A property-management company in the area should have these aggregated.
- How much new for-sale + rental construction is in the pipeline within 1–3 miles? Heavy new supply typically softens prices + rents 12–24 months out; constrained supply supports both.
Investment metrics
- 1% rule
- 1.49% ✓
- Cap rate
- 6.21%
- Cash-on-cash
- -0.28%
- DSCR
- 0.99
- GRM
- 5.6
CMA / ARV
No comps found within radius.
Projected returns pro-forma
-3.0% appreciation · 3.67% rent growth · sell at horizon
- IRR
- -15.1%
- Equity multiple
- 0.45×
- Total profit
- $-22,922
- Equity at exit
- $22,365
- IRR
- -4.2%
- Equity multiple
- 0.70×
- Total profit
- $-12,454
- Equity at exit
- $12,969
Cash invested: $42,000 (down + closing). Projections, not guarantees.
Landlord ↔ Tenant lean methodology
- Overall (STATE)
- 15 Strongly Tenant-Friendly
- State New York
- 15 Strongly Tenant-Friendly · D+10
- County
- — inherits STATE
- City
- — inherits STATE
ZIP-level market 12601
- Rents YoY
- 3.7%
- Active inventory
- 195
- Price-to-rent
- 5.6×
Monthly cashflow live
- Estimated rent
- $2,239 medium interval (Pro) →
- Mortgage (P&I)
- −$787
- Tax est. 1.5%
- −$188 /mo · $2,250/yr
- Insurance
- −$62
- HOA
- −$742
- Vacancy / Maint / Mgmt
- −$470
- Net cashflow
- $-10
Break-even live
Sensitivity live
| Price | -10% $94 | -5% $42 | +0% $-10 | +5% $-62 | +10% $-113 |
|---|---|---|---|---|---|
| Rent | -10% $-187 | -5% $-98 | +0% $-10 | +5% $79 | +10% $167 |
| Rate | -1.0pp $66 | -0.5pp $28 | base $-10 | +0.5pp $-49 | +1.0pp $-88 |
UW: 25.0% down · 7.5% · 30yr · 1.5% tax · 5.0% vac · 8.0% maint · 8.0% mgmt
Financing live
Cash to close
- Down payment
- $37,500
- Closing costs
- $4,500
- Reserves months
- —
- Total cash needed
- —
Loan-product check · same deal, 3 products live
Conventional
25% down · 7.5% · 30yr
- Down + closing
- —
- Monthly P&I
- —
- Monthly cashflow
- —
- DSCR
- —
- Eligible?
- —
Personal DTI + credit; lowest rate.
DSCR
20% down · 8.5% · 30yr
- Down + closing
- —
- Monthly P&I
- —
- Monthly cashflow
- —
- DSCR
- —
- Eligible?
- —
No personal income docs; deal must DSCR.
Hard money
10% down · 12.0% · 12mo
- Down + closing
- —
- Monthly P&I
- —
- Monthly cashflow
- —
- DSCR
- —
- Eligible?
- —
Short-term bridge; refi at stabilization.
Rent comps 2 comps
| Address | Beds | Baths | Sqft | Rent | $/sqft | DOM | Units | Dist |
|---|---|---|---|---|---|---|---|---|
| 195 Pinebrook Dr Hyde Park, NY | 2.0 | 2.5 | 1381 | $2,950 | $2.14 | 45d | 1 | 0.80mi |
| 58 W Dorsey Ln Unit A Hyde Park, NY | 2.0 | 1.0 | 950 | $2,150 | $2.26 | 16d | 1 | 1.22mi |
HOA detail
- Monthly dues
- $742 · $8,904/yr
Listing history 7 events
-
2026-06-21days on market $150,000 Active 4 DOM
-
2026-06-18statusdays on market $150,000 Active 1 DOM
-
2026-06-17days on market $150,000 Coming Soon 5 DOM
-
2026-06-16days on market $150,000 Coming Soon 4 DOM
-
2026-06-15days on market $150,000 Coming Soon 3 DOM
-
2026-06-14remarks 699-char remark
-
2026-06-14$150,000 Coming Soon 1 DOM
ⓘ Source: listings_history table (triggers on properties + properties_extension) + one-shot
backfill from property_details.listing_events for pre-trigger history.
Climate risk First Street
- Flood 1/10 Low FEMA zone X (unshaded) · 0% chance over 30 yrs
- Wildfire 4/10 Moderate
- Heat 4/10 Moderate 7 d/yr ≥98°F today · 15 d/yr by 30 yrs out
- Wind 4/10 Moderate 11% chance of damaging wind over 30 yrs
- Air quality 2/10 Low 1 unhealthy d/yr today · 2 by 30 yrs out
Nearby sold comps map
Loading sold comps map…
Walkable amenities ~0.75 mi
Loading nearby amenities…
Taxation est. · year 1
- Rental income
- $26,868
- − Mortgage interest
- −$8,402
- − Property taxes
- −$2,250
- − Insurance
- −$750
- − Repairs & maintenance
- −$2,149
- − Management
- −$2,149
- − HOA
- −$8,904
- − Depreciation
- −$4,364
- Taxable loss
- −$2,101
- Est. tax savings @ 24.0%
- +$504
- After-tax cash flow
- $387/yr
For passive investors: Depreciation is non-cash, so a rental often shows a tax loss while cash-flowing — sheltering income. Rental losses are passive: they offset passive income freely, and up to $25,000/yr can offset ordinary (W-2) income if you actively participate and your MAGI is under $100k (phasing out to $0 by $150k); unused losses carry forward. On sale, claimed depreciation is recaptured at up to 25%, and gains may owe capital-gains tax (a 1031 exchange can defer both). Figures are a year-1 estimate at your 24.0% rate — not tax advice; consult a CPA.
Condition & rehab AI · 13 photos
This 2020 manufactured home is well-maintained and ready for move-in. It offers a good condition with a modern kitchen and good curb appeal.
Value-add opportunities
- Resale Paint exterior siding — Enhances curb appeal and value
- Rental Replace window seals — Improves energy efficiency and reduces heating/cooling costs
Renovation cost estimate screening
Value-add ROI direction
- Resale Paint exterior siding — Enhances curb appeal and value ↑
- Rental Replace window seals — Improves energy efficiency and reduces heating/cooling costs ↑
ⓘ Cost ranges are severity-bucket heuristics (US national rule-of-thumb). Get contractor quotes + a written scope before underwriting a rehab budget.
Schools (NCES district)
- District
- Hyde Park Central School District
- NCES district ID
- 3615180
- Math proficiency
- 43% ▼ -3.00%
- Reading proficiency
- 62% ▲ 15.00%
- Median HH income
- $68,932
- Composite
- 46.59/100
- National rank
- #2421
- State rank
- #316 of 590 in NY
Livability — Haviland
- Score
- 65/100
- State rank
- #712
- US rank
- #13550
Category grades
Schools grade is shown separately in the Schools card above.
Census & demographics
- Census place
- Haviland, NY
- County
- Dutchess County · 188,048 people
- Metro
- Poughkeepsie-Newburgh-Middletown, NY
- Population (ZIP)
- 44,164
- Household income
- $63,652
- Rent vs Own
- Severe rent burden
- 2891.0
Population outlook (Dutchess County) Hauer SSP2
- Today (2025)
- 291,768 people
- By 2030
- 287,131 · -1.6%
- By 2040
- 274,881 · -5.8%
- By 2050
- 259,971 · -10.9%
- By 2075
- 235,366 · -19.3%
- By 2100
- 208,786 · -28.4%
Race, ethnicity, and origin ACS 2023
- Neighborhood character
- Highly diverse neighborhood (Simpson 0.70)
- Race & ethnicity
- White 44% Black 24% Hispanic / Latino 22% Two or more races 17% Asian 3%
- Hispanic origin (detail)
- Mexican 8% Puerto Rican 5% Dominican 1%
- Common ancestry
- Romanian 3% Iranian 1% Lithuanian 1%
- Foreign-born
- 19% · Canada, China
- Languages at home
- 79% English-only · Spanish 15% Other Indo-European 1% Chinese 1%
Political lean MEDSL · Dutchess
- 2024 margin
- Lean D (+5.4) · D 52.7% · R 47.3%
- 2008→2024 swing
- -3.2pp toward R · 2008: 8.6pp · 2024: 5.4pp
- All cycles
- 2024: D+5.4 2020: D+9.6 2016: R+1.1 2012: D+6.6 2008: D+8.6
Not yet ingested
- Civics
- —
Market trends
- HPI YoY
- ▼ -210.62%
- Current HPI
- 293.9789
- Rent YoY
- ▲ 3.67%
- Metro
- Poughkeepsie-Newburgh-Middletown, NY
- State GDP YoY
- ▲ 2.60%
- F500 in state
- 92
Industry mix (Fortune 500 HQ in NY)
| Industry | F500 HQs | Revenue |
|---|---|---|
| Financial Services | 10 | $950B |
|
||
| Consumer Goods | 9 | $162B |
|
||
| Insurance | 4 | $225B |
|
||
| Telecommunications | 2 | $144B |
|
||
| Pharmaceuticals | 2 | $112B |
|
||
| Media / Entertainment | 2 | $69B |
|
||
Price history
1 event — show timeline
- 2026-06-12 Coming Soon $150,000 OneKey® MLS as Distributed by MLS Grid
Cash-flow waterfall
monthlySold comps — $/sqft
last 12 mo · ≤1 miLoading sold comps…