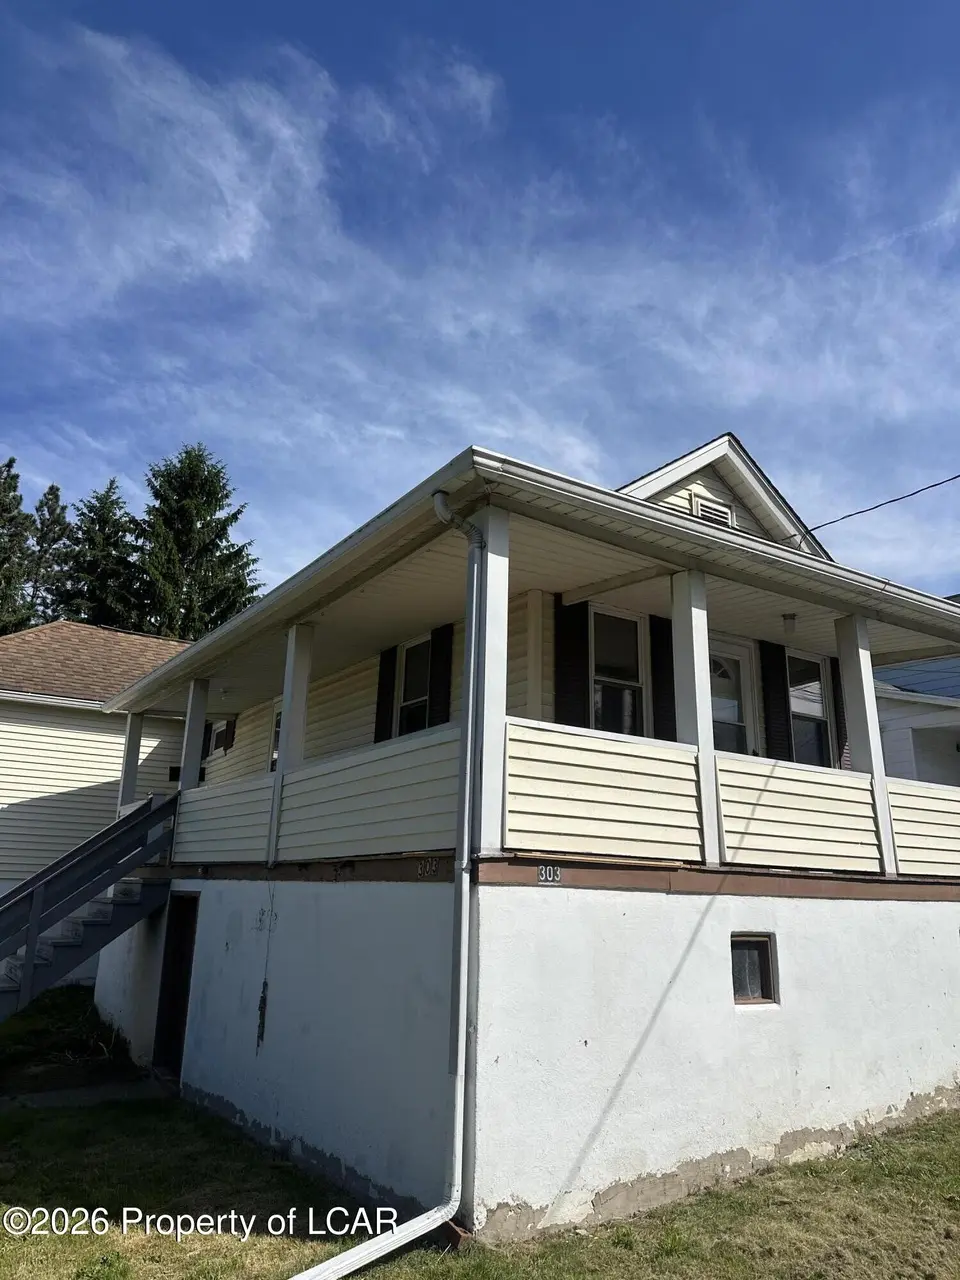
303 Church St · Old Forge, PA
Flood risk 1/10 · Minimal
- FEMA flood zone
- X (unshaded)
- Chance of flooding over 30 yrs
- 0.0%
- Est. flood insurance / yr
- $473 – $860
Fire risk 2/10 · Minimal
- Est. fire insurance / yr
- $511 – $949
Heat risk 3/10 · Minor
- Hot days now (above 96°F)
- 7 days/yr
- Hot days in 30 yrs
- 15 days/yr
Wind risk 3/10 · Minor
- Chance of severe wind over 30 yrs
- 4.0%
Air-quality risk 2/10 · Minimal
- Unhealthy air days now
- 0 days/yr
- Unhealthy air days in 30 yrs
- 1 days/yr
Risk factors via First Street. Map © Google.
Why this score? — see what drove the B+ grade
The composite is a weighted blend of 9 inputs, each scored 0–100. Each bar is that input's sub-score; the figure is the points it added to the 100-point composite (weight × sub-score).
- Cash flow +30.0/30.0
- DSCR +10.0/10.0
- 1% rule +9.2/10.0
- Appreciation +7.6/10.0
- ARV discount +7.5/15.0
- Livability +3.9/5.0
- Schools +3.1/10.0
- Rent growth +2.5/5.0
- Condition / age +2.5/5.0
$85,000
🖨 Deal sheet (PDF) 📄 Offer letter ✓ Due diligence
Listing remarks
Cute home with 2bedrooms, one is a walk through, modern kitchen and bath, large lot, fenced yard. Hud owned property being sold in as is condition, for additional information and to place an offer go to www. hudhomestore. gov, case #446-592693buyer pays all transfer tax , deed prep and occupancy fees
Key facts
- Fenced yard
- Large lot
- Modern kitchen
Tags
Property features AI
Exterior
- Utilities: Public water; Public sewer
- Home design: Single-family residence; One story
- Construction: Vinyl siding
- Exterior features: Front porch; Fenced yard
Interior
- Kitchen: Eat-in kitchen; Electric water heater
- Bathrooms: 1 full bathroom
- Heating & cooling: Oil heating; Baseboard heat
- Interior features: Eat-in kitchen; Dirt-floored basement
Neighborhood map
What this means for you Summary
Snapshot
- This is a 2-bed/1.0-bath single-family listed at $85k.
Deal economics
- At list price, monthly cash flow is $364 ($4k/yr) — positive.
- The deal already cash-flows at list — no discount required.
- Meets the 1% rule at list price ($1k rent vs $85k).
- Cap rate 11.4% vs local median 6.1% in Old Forge — top-decile yield for the area; either an underpriced asset or a hidden risk that comps aren't pricing in. Stress-test before assuming the spread holds.
Location & tenants
- Location reads 78/100 on livability (#287 in PA, #2,531 nationally) — a middle-class / working-renter tenant base. Strengths: crime A+, cost of living A+, housing A+; Watch: employment C-, amenities F, commute F.
- Old Forge SD (suburban): math 22% / reading 49% proficiency, ranked #409 of 539 in PA (top 76%) — families likely to look elsewhere, expect single-tenant / working-renter base with shorter leases.
- Market conditions: 39 active listings in the ZIP; 12 comparable units currently listed for rent nearby; rentals at typical pace (median 22d on market — plan ~3-4 weeks tenant-placement turnaround); 42% of comp listings sitting > 30 days — soft ceiling on asking rent; 251 units permitted in Lackawanna County in 2024 (0 in 5+ unit buildings).
Forward outlook
- In year one you build about $5k of equity ($588 loan paydown + $4k appreciation (5.2% local appreciation)).
- Lackawanna County population projected to shrink 4% by 2050 — rents likely to lag national; underwrite the cash flow, not the appreciation.
- At projected returns (5.2% appreciation + 3.0% rent growth), your $24k cash investment doubles in ~3 years — after that, you're playing with house money.
- By year 7, paydown + projected appreciation supports a ~$32k cash-out refi (75% LTV) — recoverable capital for the next deal without selling this one.
Negotiation context
- Only 11 days on market — expect competitive offers; lowballing is unlikely to land.
- 6 sale attempts since 21y ago with the ask held roughly flat each time — persistent listings suggest the price (not the market) is what's stuck; bring a comps-based counter.
Questions for the listing agent
- Is there a deadline driving the sale (1031 exchange, divorce, estate, relocation)? That informs how much negotiation room exists.
- Schools are B-rated — typically a magnet for longer-tenancy family renters. What's the average tenant stay here, and is there a school-zone premium baked into asking?
- What's the average days-on-market for RENTAL listings here right now (not sales)? A rising rental-DOM trend means longer vacancies and softer asking-rent achievability than the comps imply.
- What's the recent tenant-quality profile in this submarket — average credit score on applications, eviction rate, late-payment / NSF rate, and stable-employment percentage? A property-management company in the area should have these aggregated.
- How much new for-sale + rental construction is in the pipeline within 1–3 miles? Heavy new supply typically softens prices + rents 12–24 months out; constrained supply supports both.
Investment metrics
- 1% rule
- 1.42% ✓
- Cap rate
- 11.43%
- Cash-on-cash
- 18.33%
- DSCR
- 1.82
- GRM
- 5.9
CMA / ARV
No comps found within radius.
Projected returns pro-forma
5.15% appreciation · 3.0% rent growth · sell at horizon
- IRR
- 29.1%
- Equity multiple
- 2.83×
- Total profit
- $43,481
- Equity at exit
- $48,925
- IRR
- 27.7%
- Equity multiple
- 5.67×
- Total profit
- $111,145
- Equity at exit
- $85,071
Cash invested: $23,800 (down + closing). Projections, not guarantees.
Landlord ↔ Tenant lean methodology
- Overall (STATE)
- 62 Landlord-Friendly
- State Pennsylvania
- 62 Landlord-Friendly · EVEN
- County
- — inherits STATE
- City
- — inherits STATE
ZIP-level market 18518
- Home prices YoY
- 2.2%
- Active inventory
- 39
- Price-to-rent
- 5.9×
Monthly cashflow live
- Estimated rent
- $1,204 high interval (Pro) →
- Mortgage (P&I)
- −$446
- Tax est. 1.5%
- −$106 /mo · $1,275/yr
- Insurance
- −$35
- HOA
- −$0
- Vacancy / Maint / Mgmt
- −$253
- Net cashflow
- $364
Break-even live
Sensitivity live
| Price | -10% $422 | -5% $393 | +0% $364 | +5% $334 | +10% $305 |
|---|---|---|---|---|---|
| Rent | -10% $269 | -5% $316 | +0% $364 | +5% $411 | +10% $459 |
| Rate | -1.0pp $406 | -0.5pp $385 | base $364 | +0.5pp $342 | +1.0pp $319 |
UW: 25.0% down · 7.5% · 30yr · 1.5% tax · 5.0% vac · 8.0% maint · 8.0% mgmt
Financing live
Cash to close
- Down payment
- $21,250
- Closing costs
- $2,550
- Reserves months
- —
- Total cash needed
- —
Loan-product check · same deal, 3 products live
Conventional
25% down · 7.5% · 30yr
- Down + closing
- —
- Monthly P&I
- —
- Monthly cashflow
- —
- DSCR
- —
- Eligible?
- —
Personal DTI + credit; lowest rate.
DSCR
20% down · 8.5% · 30yr
- Down + closing
- —
- Monthly P&I
- —
- Monthly cashflow
- —
- DSCR
- —
- Eligible?
- —
No personal income docs; deal must DSCR.
Hard money
10% down · 12.0% · 12mo
- Down + closing
- —
- Monthly P&I
- —
- Monthly cashflow
- —
- DSCR
- —
- Eligible?
- —
Short-term bridge; refi at stabilization.
Rent comps 12 comps
| Address | Beds | Baths | Sqft | Rent | $/sqft | DOM | Units | Dist |
|---|---|---|---|---|---|---|---|---|
| 304 Vine St Unit 304 Old Forge, PA | 2.0 | 1.0 | 1000 | $1,400 | $1.40 | 44d | 1 | 0.21mi |
| 114 William St Unit 2 Old Forge, PA | 1.0 | 1.0 | 741 | $1,150 | $1.55 | 44d | 1 | 0.28mi |
| 112 William St Unit 1 Old Forge, PA | 1.0 | 1.0 | 627 | $1,100 | $1.75 | 44d | 1 | 0.28mi |
| 513 Oak St Old Forge, PA | 2.0 | 1.0 | 700 | $1,050 | $1.50 | 44d | 1 | 0.31mi |
| 202 Moosic Rd Unit 1 Old Forge, PA | 1.0 | 1.0 | 625 | $1,050 | $1.68 | 14d | 1 | 0.51mi |
| 1213 Lori Dr Old Forge, PA | 2.0 | 1.0 | 740 | $1,250 | $1.69 | 14d | 1 | 0.59mi |
| 1215 Lori Dr Old Forge, PA | 2.0 | 1.0 | 740 | $1,100 | $1.49 | 14d | 1 | 0.59mi |
| 531 S Main St Old Forge, PA | 1.0 | 1.0 | 600 | $1,090 | $1.82 | 14d | 1 | 0.76mi |
| 128-130 Henderson St Old Forge, PA | 1.0 | 1.0 | 900 | $1,195 | $1.33 | 22d | 1 | 0.94mi |
| 152 Drakes Ln Old Forge, PA | 2.0 | 1.0 | 979 | $1,700 | $1.74 | 14d | 1 | 1.12mi |
| 864 S Main St #3 Old Forge, PA | 2.0 | 1.0 | 965 | $1,350 | $1.40 | 14d | 1 | 1.18mi |
| 652 Marion Ln Moosic, PA | 2.0 | 2.0 | 1000 | $1,500 | $1.50 | 44d | 1 | 1.39mi |
Listing history 10 events
-
2026-06-15status $85,000 Pending 11 DOM
-
2026-06-15days on market $85,000 Active 11 DOM
-
2026-06-14days on market $85,000 Active 9 DOM
-
2026-06-13days on market $85,000 Active 8 DOM
-
2026-06-10days on market $85,000 Active 6 DOM
-
2026-06-09days on market $85,000 Active 5 DOM
-
2026-06-08days on market $85,000 Active 4 DOM
-
2026-06-07days on market $85,000 Active 3 DOM
-
2026-06-05remarks 301-char remark
-
2026-06-05$85,000 Active 1 DOM
ⓘ Source: listings_history table (triggers on properties + properties_extension) + one-shot
backfill from property_details.listing_events for pre-trigger history.
Climate risk First Street
- Flood 1/10 Low FEMA zone X (unshaded) · 0% chance over 30 yrs
- Wildfire 2/10 Low
- Heat 3/10 Moderate 7 d/yr ≥96°F today · 15 d/yr by 30 yrs out
- Wind 3/10 Moderate 4% chance of damaging wind over 30 yrs
- Air quality 2/10 Low 0 unhealthy d/yr today · 1 by 30 yrs out
Nearby sold comps map
Loading sold comps map…
Walkable amenities ~0.75 mi
Loading nearby amenities…
Taxation est. · year 1
- Rental income
- $14,446
- − Mortgage interest
- −$4,761
- − Property taxes
- −$1,275
- − Insurance
- −$425
- − Repairs & maintenance
- −$1,156
- − Management
- −$1,156
- − Depreciation
- −$2,473
- Taxable income
- $3,201
- Est. tax owed @ 24.0%
- −$768
- After-tax cash flow
- $3,595/yr
For passive investors: Depreciation is non-cash, so a rental often shows a tax loss while cash-flowing — sheltering income. Rental losses are passive: they offset passive income freely, and up to $25,000/yr can offset ordinary (W-2) income if you actively participate and your MAGI is under $100k (phasing out to $0 by $150k); unused losses carry forward. On sale, claimed depreciation is recaptured at up to 25%, and gains may owe capital-gains tax (a 1031 exchange can defer both). Figures are a year-1 estimate at your 24.0% rate — not tax advice; consult a CPA.
Schools (NCES district)
- District
- Old Forge SD
- NCES district ID
- 4218120
- Math proficiency
- 22% ▼ -19.00%
- Reading proficiency
- 49% ▼ -17.00%
- Median HH income
- $49,409
- Composite
- 30.6/100
- National rank
- #6196
- State rank
- #409 of 539 in PA
Livability — Old Forge
- Score
- 78/100
- State rank
- #287
- US rank
- #2531
Category grades
Schools grade is shown separately in the Schools card above.
Census & demographics
- Census place
- Old Forge, PA
- City population
- 8,533
- Population (ZIP)
- 8,533
Population outlook (Lackawanna County) Hauer SSP2
- Today (2025)
- 210,652 people
- By 2030
- 208,623 · -1.0%
- By 2040
- 203,980 · -3.2%
- By 2050
- 201,069 · -4.5%
- By 2075
- 205,026 · -2.7%
- By 2100
- 210,851 · +0.1%
Race, ethnicity, and origin ACS 2023
- Neighborhood character
- Predominantly White (84%)
- Race & ethnicity
- White 84% Two or more races 13% Hispanic / Latino 9% Asian 1%
- Hispanic origin (detail)
- Puerto Rican 9%
- Common ancestry
- Romanian 17% Scotch-Irish 4% Subsaharan African 2%
- Foreign-born
- 2% · Canada
- Languages at home
- 95% English-only · Spanish 3% Other Indo-European 1% Other Asian/Pacific 1%
Political lean MEDSL · Lackawanna
- 2024 margin
- Toss-up / Even · D 51.0% · R 48.3%
- 2008→2024 swing
- -23.2pp toward R · 2008: 26.0pp · 2024: 2.8pp
- All cycles
- 2024: D+2.8 2020: D+8.4 2016: D+3.4 2012: D+27.4 2008: D+26.0
Not yet ingested
- Civics
- —
Market trends
- HPI YoY
- ▲ 5.15%
- Current HPI
- 242.2839
- Rent YoY
- —
- Metro
- —
- State GDP YoY
- ▲ 1.68%
- F500 in state
- 34
Industry mix (Fortune 500 HQ in PA)
| Industry | F500 HQs | Revenue |
|---|---|---|
| Healthcare | 2 | $309B |
|
||
| Insurance | 2 | $27B |
|
||
| Telecommunications / Media | 1 | $124B |
|
||
| Industrial Distribution | 1 | $22B |
|
||
| Financial Services | 1 | $20B |
|
||
| Chemicals / Materials | 1 | $18B |
|
||
Price history
+13.5% since first listed17 events — show timeline
- 2026-06-04 Listed $85,000 LCAR
- 2023-09-20 Sold (Public Records) $150,000 Public Records
- 2023-09-15 Sold (MLS) $150,000 GSBR as distributed by MLS GRID
- 2023-08-21 Pending — GSBR as distributed by MLS GRID
- 2023-08-10 Price Changed $145,000 GSBR as distributed by MLS GRID
- 2023-07-26 Listed $160,000 GSBR as distributed by MLS GRID
- 2022-03-29 Sold (MLS) $87,300 GSBR as distributed by MLS GRID
- 2022-03-02 Pending — GSBR as distributed by MLS GRID
- 2022-03-02 Relisted — GSBR as distributed by MLS GRID
- 2022-03-01 Delisted — GSBR as distributed by MLS GRID
- 2022-01-06 Price Changed $99,900 GSBR as distributed by MLS GRID
- 2021-12-15 Price Changed $107,900 GSBR as distributed by MLS GRID
- 2021-11-30 Price Changed $111,900 GSBR as distributed by MLS GRID
- 2021-11-13 Price Changed $119,900 GSBR as distributed by MLS GRID
- 2021-10-13 Listed $123,900 GSBR as distributed by MLS GRID
- 2005-10-29 Listed $71,900 GSBR as distributed by MLS GRID
- 2005-06-22 Listed $74,900 GSBR as distributed by MLS GRID
Property tax history
+37.4%/yrLatest (2026): $39,733 · +2693.6% YoY. Source: county tax records.
Cash-flow waterfall
monthlySold comps — $/sqft
last 12 mo · ≤1 miLoading sold comps…