 🏷️ Likely Rental
960 Crystal Lake Dr · Deerfield Beach, FL
Flood risk 1/10 · Minimal
- FEMA flood zone
- X (unshaded)
- Chance of flooding over 30 yrs
- 0.0%
- Est. flood insurance / yr
- $507 – $1,088
Fire risk 1/10 · Minimal
- Est. fire insurance / yr
- $947 – $1,759
Heat risk 9/10 · Severe
- Hot days now (above 107°F)
- 7 days/yr
- Hot days in 30 yrs
- 26 days/yr
Wind risk 10/10 · Severe
- Chance of severe wind over 30 yrs
- 99.0%
Air-quality risk 2/10 · Minimal
- Unhealthy air days now
- 1 days/yr
- Unhealthy air days in 30 yrs
- 3 days/yr
Risk factors via First Street. Map © Google.
Why this score? — see what drove the C grade
The composite is a weighted blend of 9 inputs, each scored 0–100. Each bar is that input's sub-score; the figure is the points it added to the 100-point composite (weight × sub-score).
- Cash flow +22.8/30.0
- ARV discount +7.5/15.0
- DSCR +7.3/10.0
- 1% rule +5.9/10.0
- Schools +4.1/10.0
- Livability +3.8/5.0
- Condition / age +3.8/5.0
- Rent growth +2.9/5.0
- Appreciation +0.0/10.0
$189,000
🖨 Deal sheet 📄 Offer letter ✓ Due diligence
Listing remarks
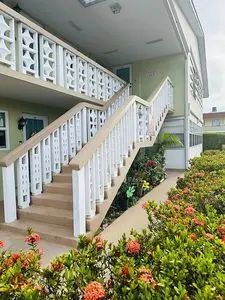
Top-floor 2 bedroom, 2 bathroom condo in a quiet and well-kept 55+ community in Deerfield Beach. Clean, well maintained, and move-in ready with a spacious layout and added privacy from being on the top floor. The property sits on a recreational lake and offers access to a community pool, on-site laundry, and peaceful surroundings. HOA is $700/month and includes water, pool access, and community maintenance. Conveniently located just minutes from I-95 and within walking distance to the Brightline station, making it easy to get around South Florida. Close to shopping, restaurants, and the beach. Great opportunity for a full-time residence, seasonal home, or investment property.
Key facts
- Close to restaurants
- Community pool
- Recreational lake
Tags
Neighborhood map
What this means for you Summary
Snapshot
- This is a 2-bed/2.0-bath single-family listed at $189k. Condition is rated good.
Deal economics
- At list price, monthly cash flow is $328 ($4k/yr) — positive.
- The deal already cash-flows at list — no discount required.
- Meets the 1% rule at list price ($2k rent vs $189k).
- Recommended offer: $183k (3.0% below list) — sets the bar for market timing.
- Cap rate 8.4% vs local median 4.2% in Deerfield Beach — top-decile yield for the area; either an underpriced asset or a hidden risk that comps aren't pricing in. Stress-test before assuming the spread holds.
Location & tenants
- Location reads 75/100 on livability (#250 in FL, #3,970 nationally) — a middle-class / working-renter tenant base. Strengths: housing A+, health & safety A+, cost of living A; Watch: schools D-, amenities D-, employment D-.
- Broward (suburban): math 42% / reading 53% proficiency, ranked #46 of 73 in FL (top 63%) — families likely to look elsewhere, expect single-tenant / working-renter base with shorter leases.
- Market conditions: Rents rising (+1.8%/yr); 591 active listings in the ZIP; 40 comparable units currently listed for rent nearby; rentals at typical pace (median 24d on market — plan ~3-4 weeks tenant-placement turnaround); 2,111 units permitted in Broward County in 2024 (1,265 in 5+ unit buildings).
- This rent runs 35% of the median local income ($71k/yr) — at the standard rent-burdened threshold; future hikes will face affordability resistance.
Forward outlook
- Local home prices are declining (-3.0%/yr); year-one equity from $1k of loan paydown is wiped out by about $6k of value loss. Plan a longer hold.
- Broward County population projected at +34% by 2050 — long-run rental-demand tailwind backs the buy-and-hold thesis.
Negotiation context
- It's been on market 35 days — a 3% lower offer ($183k) is reasonable based on typical stale-listing flexibility.
- 4 sale attempts since 3y ago with the ask held roughly flat each time — persistent listings suggest the price (not the market) is what's stuck; bring a comps-based counter.
Risks & watch-outs
- Climate carrying-cost: severe wind risk, 99% chance of damaging wind over 30y; extreme-heat days projected 7→26/yr by 2055 (HVAC capex compounding) — expect insurance premiums to compound above CPI over the hold.
Questions for the listing agent
- It's been on market 35 days. Have you received any prior offers? Is the seller open to a 3% concession, seller financing, or rate buy-down credit?
- Built in 1967 — when were the roof, HVAC, electrical panel, plumbing, and water heater last replaced?
- Is there a deadline driving the sale (1031 exchange, divorce, estate, relocation)? That informs how much negotiation room exists.
- Schools are D-rated, which usually means shorter tenancies and higher turnover. Who's the typical renter profile here, and what's been the actual vacancy rate?
- What's the average days-on-market for RENTAL listings here right now (not sales)? A rising rental-DOM trend means longer vacancies and softer asking-rent achievability than the comps imply.
- What's the recent tenant-quality profile in this submarket — average credit score on applications, eviction rate, late-payment / NSF rate, and stable-employment percentage? A property-management company in the area should have these aggregated.
- How much new for-sale + rental construction is in the pipeline within 1–3 miles? Heavy new supply typically softens prices + rents 12–24 months out; constrained supply supports both.
Investment metrics
- 1% rule
- 1.09% ✓
- Cap rate
- 8.37%
- Cash-on-cash
- 7.43%
- DSCR
- 1.33
- GRM
- 7.6
CMA / ARV
- ARV (on-the-fly)
- $419,144
- Comps found
- 2
Show comp detail 2 sales within ~0.75 mi
| Address | Dist | Beds/Ba | Sqft | Sold | Price | $/sf | Match |
|---|---|---|---|---|---|---|---|
| 651 NW 37th St | 0.30mi | 2/2.0 | 994 (+3%) | 21mo | $430,000 | $433 | 64 |
| 4314 NW 6 Ave | 0.61mi | 2/2.0 | 1,060 (+10%) | 2mo | $315,000 | $297 | 54 |
Match score weights: distance 35% · size 25% · config 20% · recency 20%. Top-matched comps best support the ARV.
Projected returns pro-forma
-3.0% appreciation · 1.75% rent growth · sell at horizon
- IRR
- -6.3%
- Equity multiple
- 0.77×
- Total profit
- $-12,295
- Equity at exit
- $28,181
- IRR
- 1.7%
- Equity multiple
- 1.11×
- Total profit
- $6,013
- Equity at exit
- $16,341
Cash invested: $52,920 (down + closing). Projections, not guarantees.
Landlord ↔ Tenant lean methodology
- Overall (STATE)
- 87 Strongly Landlord-Friendly
- State Florida
- 87 Strongly Landlord-Friendly · R+3
- County
- — inherits STATE
- City
- — inherits STATE
ZIP-level market 33064
- Home prices YoY
- -18.7%
- Rents YoY
- 1.8%
- Active inventory
- 591
- Price-to-rent
- 7.6×
Monthly cashflow live
- Estimated rent
- $2,068 high interval (Pro) →
- Mortgage (P&I)
- −$991
- Tax est. 1.5%
- −$236 /mo · $2,835/yr
- Insurance
- −$79
- HOA
- −$0
- Vacancy / Maint / Mgmt
- −$434
- Net cashflow
- $328
Break-even live
UW: 25.0% down · 7.5% · 30yr · 1.5% tax · 5.0% vac · 8.0% maint · 8.0% mgmt
Financing live
Cash to close
- Down payment
- $47,250
- Closing costs
- $5,670
- Reserves months
- —
- Total cash needed
- —
Loan-product check · same deal, 3 products live
Conventional
25% down · 7.5% · 30yr
- Down + closing
- —
- Monthly P&I
- —
- Monthly cashflow
- —
- DSCR
- —
- Eligible?
- —
Personal DTI + credit; lowest rate.
DSCR
20% down · 8.5% · 30yr
- Down + closing
- —
- Monthly P&I
- —
- Monthly cashflow
- —
- DSCR
- —
- Eligible?
- —
No personal income docs; deal must DSCR.
Hard money
10% down · 12.0% · 12mo
- Down + closing
- —
- Monthly P&I
- —
- Monthly cashflow
- —
- DSCR
- —
- Eligible?
- —
Short-term bridge; refi at stabilization.
Rent comps 40 comps
| Address | Beds | Baths | Sqft | Rent | $/sqft | DOM | Units | Dist |
|---|---|---|---|---|---|---|---|---|
| 941 Crystal Lake Dr #302 Deerfield Beach, FL | 2.0 | 2.0 | 882 | $1,890 | $2.14 | 14d | 1 | 0.07mi |
| 1021 Crystal Lake Dr #203 Deerfield Beach, FL | 2.0 | 2.0 | 890 | $1,800 | $2.02 | 14d | 1 | 0.08mi |
| 1100 Crystal Lake Dr #207 Deerfield Beach, FL | 1.0 | 1.0 | 660 | $1,900 | $2.88 | 24d | 1 | 0.12mi |
| 1101 Crystal Lake Dr #203 Deerfield Beach, FL | 2.0 | 2.0 | 930 | $2,200 | $2.37 | 24d | 1 | 0.12mi |
| 858 Crystal Lake Dr #858 Pompano Beach, FL | 2.0 | 2.0 | 987 | $2,200 | $2.23 | 24d | 1 | 0.13mi |
| 3901 NW 9th Ave Deerfield Beach, FL | 2.0 | 2.0 | 800 | $1,995 | $2.49 | 24d | 1 | 0.14mi |
| 3801 Crystal Lake Dr Deerfield Beach, FL | 1.0–2.0 | 1.0–2.0 | 968 | $2,325 | $2.40 | 1d | 8 | 0.21mi |
| 4061 NW 9th Ave #206 Deerfield Beach, FL | 2.0 | 2.0 | 800 | $1,900 | $2.38 | 24d | 1 | 0.27mi |
| 3910 Crystal Lake Dr #201 Deerfield Beach, FL | 2.0 | 2.0 | 884 | $2,000 | $2.26 | 24d | 1 | 0.32mi |
| 3550 NW 8th Ave Pompano Beach, FL | 2.0 | 1.5 | 765 | $1,775 | $2.32 | 14d | 4 | 0.39mi |
| 3500 Blue Lake Dr #101 Pompano Beach, FL | 1.0 | 1.5 | 850 | $1,900 | $2.24 | 24d | 1 | 0.41mi |
| 3400 Blue Lake Dr Pompano Beach, FL | 2.0 | 2.0 | 1039 | $2,288 | $2.20 | 24d | 2 | 0.41mi |
| 3550 Blue Lake Dr Pompano Beach, FL | 1.0 | 1.5 | 850 | $1,850 | $2.18 | 24d | 1 | 0.41mi |
| 521 NW 35th Ct Unit D Pompano Beach, FL | 1.0 | 1.0 | 600 | $1,525 | $2.54 | 24d | 1 | 0.42mi |
| 4304 NW 9th Ave Unit 2-2D Pompano Beach, FL | 2.0 | 2.0 | 1040 | $1,750 | $1.68 | 14d | 1 | 0.49mi |
| 4314 NW 9th Ave Deerfield Beach, FL | 1.0–2.0 | 1.5–2.0 | 992 | $1,940 | $1.95 | 14d | 2 | 0.50mi |
| 4354 NW 9th Ave Unit 12-3D Pompano Beach, FL | 2.0 | 2.0 | 1040 | $2,000 | $1.92 | 24d | 1 | 0.50mi |
| 4394 NW 9th Ave Unit 20-1A Deerfield Beach, FL | 2.0 | 2.0 | 950 | $1,700 | $1.79 | 24d | 1 | 0.50mi |
| 651 NW 42nd Ct #214 Deerfield Beach, FL | 2.0 | 1.0 | 721 | $1,695 | $2.35 | 24d | 1 | 0.54mi |
| 401 NW 34th St Pompano Beach, FL | 2.0 | 1.0–1.5 | 704 | $2,294 | $3.26 | 2d | 16 | 0.54mi |
| 4450 Military Trl Unit 22 Pompano Beach, FL | 2.0 | 1.0 | 940 | $1,950 | $2.07 | 24d | 1 | 0.58mi |
| 1001 NW 45th St #6 Deerfield Beach, FL | 2.0 | 2.0 | 850 | $2,200 | $2.59 | 15d | 1 | 0.59mi |
| 351 NW 42nd Ct Apt 205 Pompano Beach, FL | 2.0 | 1.0 | 800 | $1,899 | $2.37 | 14d | 1 | 0.65mi |
| 311 NW 42nd Ct #101 Deerfield Beach, FL | 2.0 | 1.0 | 800 | $1,799 | $2.25 | 24d | 1 | 0.66mi |
| 4325 NW 5th Ave Deerfield Beach, FL | 2.0 | 2.0 | 953 | $2,249 | $2.36 | 10d | 1 | 0.67mi |
| 3005 NW 5th Ter #2 Pompano Beach, FL | 2.0 | 1.0 | 968 | $2,100 | $2.17 | 24d | 1 | 0.68mi |
| 331 NW 42nd Ct Unit 101 Pompano Beach, FL | 2.0 | 1.0 | 800 | $1,799 | $2.25 | 14d | 1 | 0.69mi |
| 250 W Sample Rd Pompano Beach, FL | 1.0–2.0 | 1.0–2.0 | 900 | $2,150 | $2.39 | 24d | 1 | 0.70mi |
| 1421 NW 45th St #5 Deerfield Beach, FL | 2.0 | 2.0 | 760 | $2,000 | $2.63 | 24d | 1 | 0.70mi |
| 3000 NW 5th Ter #129 Pompano Beach, FL | 2.0 | 2.0 | 912 | $2,000 | $2.19 | 24d | 1 | 0.74mi |
| 3109 NW 2nd Ter Unit 4-156 Pompano Beach, FL | 1.0 | 1.0 | 680 | $1,600 | $2.35 | 24d | 1 | 0.76mi |
| 3109 NW 2nd Ter Unit 4-156 Pompano Beach, FL | 1.0 | 1.0 | 680 | $1,600 | $2.35 | 14d | 1 | 0.76mi |
| 145 NW 41st Ct #11 Deerfield Beach, FL | 3.0 | 1.5 | 1004 | $2,490 | $2.48 | 19d | 1 | 0.76mi |
| 624 NW 47th St Deerfield Beach, FL | 2.0 | 2.0 | 793 | $2,100 | $2.65 | 14d | 1 | 0.80mi |
| 616 NW 47th St Deerfield Beach, FL | 2.0 | 2.0 | 793 | $2,495 | $3.15 | 4d | 1 | 0.80mi |
| 4332 NW 1st Ter Deerfield Beach, FL | 3.0 | 2.0 | 1095 | $3,000 | $2.74 | 24d | 1 | 0.82mi |
| 4332 NW 1st Ter Deerfield Beach, FL | 3.0 | 2.0 | 1095 | $3,000 | $2.74 | 5d | 1 | 0.82mi |
| 551 NW 46th St Deerfield Beach, FL | 2.0 | 2.0 | 952 | $2,485 | $2.61 | 24d | 1 | 0.84mi |
| 300 NW 30th Ct #202 Pompano Beach, FL | 1.0 | 1.0 | 633 | $1,650 | $2.61 | 24d | 1 | 0.84mi |
| 4550 NW 18th Ave #506 Deerfield Beach, FL | 2.0 | 2.0 | 1070 | $2,100 | $1.96 | 11d | 1 | 0.86mi |
Listing history 18 events
-
2026-06-15days on market $189,000 Active 35 DOM
-
2026-06-13days on market $189,000 Active 33 DOM
-
2026-06-09days on market $189,000 Active 29 DOM
-
2026-06-07days on market $189,000 Active 27 DOM
-
2026-06-04days on market $189,000 Active 24 DOM
-
2026-06-03days on market $189,000 Active 23 DOM
-
2026-06-02days on market $189,000 Active 22 DOM
-
2026-06-01days on market $189,000 Active 21 DOM
-
2026-05-31days on market $189,000 Active 20 DOM
-
2026-05-12$189,000 Active
-
2025-01-18historical $1,400
-
2024-12-22historical $1,400
-
2024-12-18$1,400
-
2024-11-22price $1,200
-
2024-11-15$1,350
-
2023-11-03historical $1,495
-
2023-09-28price $1,495
-
2023-09-06$1,595
ⓘ Source: listings_history table (triggers on properties + properties_extension) + one-shot
backfill from property_details.listing_events for pre-trigger history.
Climate risk First Street
- Flood 1/10 Low FEMA zone X (unshaded) · 0% chance over 30 yrs
- Wildfire 1/10 Low
- Heat 9/10 Extreme 7 d/yr ≥107°F today · 26 d/yr by 30 yrs out
- Wind 10/10 Extreme 99% chance of damaging wind over 30 yrs
- Air quality 2/10 Low 1 unhealthy d/yr today · 3 by 30 yrs out
Nearby sold comps map
Loading sold comps map…
Walkable amenities ~0.75 mi
Loading nearby amenities…
Taxation est. · year 1
- Rental income
- $24,817
- − Mortgage interest
- −$10,587
- − Property taxes
- −$2,835
- − Insurance
- −$945
- − Repairs & maintenance
- −$1,985
- − Management
- −$1,985
- − Depreciation
- −$5,498
- Taxable income
- $981
- Est. tax owed @ 24.0%
- −$236
- After-tax cash flow
- $3,697/yr
For passive investors: Depreciation is non-cash, so a rental often shows a tax loss while cash-flowing — sheltering income. Rental losses are passive: they offset passive income freely, and up to $25,000/yr can offset ordinary (W-2) income if you actively participate and your MAGI is under $100k (phasing out to $0 by $150k); unused losses carry forward. On sale, claimed depreciation is recaptured at up to 25%, and gains may owe capital-gains tax (a 1031 exchange can defer both). Figures are a year-1 estimate at your 24.0% rate — not tax advice; consult a CPA.
Condition & rehab AI · 1 photo
This top-floor condo is in excellent condition, move-in ready, and offers a great opportunity for investment or full-time residence.
Value-add opportunities
- Both Painting exterior and interior walls — Fresh paint enhances curb appeal and interior aesthetics.
- Both Landscaping improvements — Enhances curb appeal and adds value to the property.
- Both New flooring in bathrooms and kitchen — Fresh flooring improves aesthetics and adds value to the property.
- Both New paint in bathrooms and kitchen — Fresh paint enhances aesthetics and adds value to the property.
Renovation cost estimate screening
Value-add ROI direction
- Both Painting exterior and interior walls — Fresh paint enhances curb appeal and interior aesthetics. ↑
- Both Landscaping improvements — Enhances curb appeal and adds value to the property. ↑
- Both New flooring in bathrooms and kitchen — Fresh flooring improves aesthetics and adds value to the property. ↑
- Both New paint in bathrooms and kitchen — Fresh paint enhances aesthetics and adds value to the property. ↑
ⓘ Cost ranges are severity-bucket heuristics (US national rule-of-thumb). Get contractor quotes + a written scope before underwriting a rehab budget.
Schools (NCES district)
- District
- Broward
- NCES district ID
- 1200180
- Math proficiency
- 42% ▼ -18.00%
- Reading proficiency
- 53% ▼ -5.00%
- Median HH income
- $52,139
- Composite
- 40.88/100
- National rank
- #3621
- State rank
- #46 of 73 in FL
Livability — Deerfield Beach
- Score
- 75/100
- State rank
- #250
- US rank
- #3970
Category grades
Schools grade is shown separately in the Schools card above.
Census & demographics
- Census place
- Deerfield Beach, FL
- County
- Broward County · 1,963,430 people
- City population
- 61,449
- Metro
- Miami-Fort Lauderdale-Pompano Beach, FL
- Population (ZIP)
- 64,563
- Household income
- $71,301
- Rent vs Own
- Severe rent burden
- 2907.0
Population outlook (Broward County) Hauer SSP2
- Today (2025)
- 2,207,033 people
- By 2030
- 2,360,704 · +7.0%
- By 2040
- 2,661,208 · +20.6%
- By 2050
- 2,946,698 · +33.5%
- By 2075
- 3,602,273 · +63.2%
- By 2100
- 3,970,984 · +79.9%
Race, ethnicity, and origin ACS 2023
- Neighborhood character
- Highly diverse neighborhood (Simpson 0.75)
- Race & ethnicity
- White 34% Hispanic / Latino 27% Black 25% Two or more races 24% Asian 2%
- Hispanic origin (detail)
- Mexican 4% Puerto Rican 4% Cuban 4% Dominican 2%
- Common ancestry
- Hispanic 13% Estonian 10% Romanian 1%
- Foreign-born
- 43% · Canada, Jamaica, Dominican Republic
- Languages at home
- 45% English-only · Spanish 23% French/Haitian/Cajun 16% Other Indo-European 13%
Political lean MEDSL · Broward
- 2024 margin
- D (+17.0) · D 58.0% · R 41.0%
- 2008→2024 swing
- -17.8pp toward R · 2008: 34.7pp · 2024: 17.0pp
- All cycles
- 2024: D+17.0 2020: D+29.8 2016: D+35.0 2012: D+34.9 2008: D+34.7
Not yet ingested
- Civics
- —
Market trends
- HPI YoY
- ▼ -109.09%
- Current HPI
- 474.7007
- Rent YoY
- ▲ 1.75%
- Metro
- Miami-Fort Lauderdale-Pompano Beach, FL
- State GDP YoY
- ▲ 3.28%
- F500 in state
- 36
Industry mix (Fortune 500 HQ in FL)
| Industry | F500 HQs | Revenue |
|---|---|---|
| Industrial Technology | 2 | $29B |
|
||
| Insurance | 2 | $17B |
|
||
| Retail | 1 | $60B |
|
||
| Technology Distribution | 1 | $58B |
|
||
| Homebuilding | 1 | $35B |
|
||
| Technology Manufacturing | 1 | $35B |
|
||
Price history
+11749.5% since first listed9 events — show timeline
- 2026-05-12 Listed $189,000 FSBO.com
- 2025-01-18 Rental Removed $1,400 GFLMLS
- 2024-12-22 Rental Removed $1,400 BUILDIUM
- 2024-12-18 Listed for Rent $1,400 GFLMLS
- 2024-11-22 Price Changed $1,200 BUILDIUM
- 2024-11-15 Listed for Rent $1,350 BUILDIUM
- 2023-11-03 Rental Removed $1,495 RMLSFL
- 2023-09-28 Price Changed $1,495 RMLSFL
- 2023-09-06 Listed for Rent $1,595 RMLSFL
Cash-flow waterfall
monthlySold comps — $/sqft
last 12 mo · ≤1 miLoading sold comps…