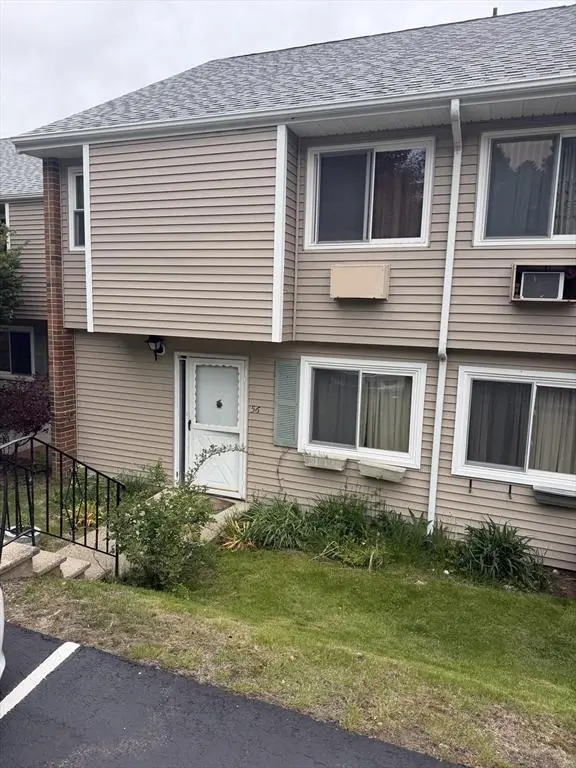
56 Glen Devin St #56 · Amesbury Town, MA
Flood risk 1/10 · Minimal
- FEMA flood zone
- X (unshaded)
- Chance of flooding over 30 yrs
- 0.0%
- Est. flood insurance / yr
- $507 – $1,088
Fire risk 3/10 · Minor
- Est. fire insurance / yr
- $915 – $1,699
Heat risk 4/10 · Minor
- Hot days now (above 94°F)
- 7 days/yr
- Hot days in 30 yrs
- 16 days/yr
Wind risk 6/10 · Moderate
- Chance of severe wind over 30 yrs
- 56.0%
Air-quality risk 3/10 · Minor
- Unhealthy air days now
- 2 days/yr
- Unhealthy air days in 30 yrs
- 3 days/yr
Risk factors via First Street. Map © Google.
Why this score? — see what drove the D+ grade
The composite is a weighted blend of 9 inputs, each scored 0–100. Each bar is that input's sub-score; the figure is the points it added to the 100-point composite (weight × sub-score).
- ARV discount +15.0/15.0
- Cash flow +11.1/30.0
- 1% rule +4.9/10.0
- Rent growth +4.2/5.0
- Schools +3.9/10.0
- Livability +3.3/5.0
- DSCR +3.2/10.0
- Condition / age +2.5/5.0
- Appreciation +0.0/10.0
$249,000
🖨 Deal sheet (PDF) 📄 Offer letter ✓ Due diligence
Listing remarks MLS
PEACEFUL WATER VIEWS,PRIVATE BEACH,TENNIS COURTS,CLUBHOUSE,COMPLETE THIS 2BR TOWNHOUSE WITH BUILT-IN ENTERTAINMENT CENTER.APPLIANCES INCLUDED.
Key facts
- $316 HOA
- 2 parking spots
- Built 1972
Property features AI
Finance
- Other: Listing status: Active
- HOA & community: Association fee of $300; Association fee includes insurance, building structure maintenance, road maintenance, and grounds maintenance; Association amenities include a clubroom and beach rights; Not a senior community
Exterior
- Parking: Two open parking spaces
- Utilities: Public water service; Public sewer service
- Home design: Condominium townhouse; Two stories; Entry level is the first floor
- Construction: Built (year from public records); Approximately 1,200 total building area
- Exterior features: Public water; Public sewer
Interior
- Bathrooms: One full bathroom; One half bathroom
- Heating & cooling: Electric heating; Window unit cooling (window-mounted AC)
- Interior features: Five total rooms; No basement
Neighborhood map
What this means for you Summary
Snapshot
- This is a 2-bed/1.5-bath townhouse listed at $249k.
Deal economics
- At list price, monthly cash flow is $-99 ($-1k/yr) — negative.
- To cash-flow at today's rent, offer at most $235k (5.7% below list).
- To meet the 1% rule (rent ≥ 1% of price), the offer needs to be $245k (1.5% below list).
- Recommended offer: $235k (5.7% below list) — sets the bar for cash-flow.
- Cap rate 5.8% vs local median 2.8% in Amesbury Town — top-decile yield for the area; either an underpriced asset or a hidden risk that comps aren't pricing in. Stress-test before assuming the spread holds.
Location & tenants
- Location reads 66/100 on livability (#170 in MA) — a middle-class / working-renter tenant base. Strengths: employment A+, housing A+, crime B; Watch: amenities F, commute F, cost of living F.
- Amesbury (suburban): math 34% / reading 51% proficiency, ranked #173 of 302 in MA (top 57%) — families likely to look elsewhere, expect single-tenant / working-renter base with shorter leases.
- Zoned schools: Amesbury Elementary (math 37% / reading 52%, grade F, #421 of 938 statewide, top 48%, 328 students, 0% FRL); Amesbury Middle (math 30% / reading 46%, grade F, #154 of 305 statewide, top 51%, 584 students, 0% FRL); Amesbury High (math 57% / reading 77%, grade B, #97 of 343 statewide, top 30%, 453 students, 0% FRL) — zoned schools average 0% FRL vs 21% district-wide (21 pts lower); this property's tenant base skews higher-income than the district average.
- Market conditions: Rents rising fast (+7.0%/yr); 38 active listings in the ZIP; 6 comparable units currently listed for rent nearby; rentals leasing fast (median 0d on market — plan ~1-2 weeks tenant-placement turnaround); solid renter incomes; 1,032 units permitted in Essex County in 2024 (590 in 5+ unit buildings).
Forward outlook
- Local home prices are declining (-3.0%/yr); year-one equity from $2k of loan paydown is wiped out by about $7k of value loss. Plan a longer hold.
- Essex County population projected at +15% by 2050 — long-run rental-demand tailwind backs the buy-and-hold thesis.
Negotiation context
- Only 12 days on market — expect competitive offers; lowballing is unlikely to land.
- 2 sale attempts since 29y ago with the ask held roughly flat each time — persistent listings suggest the price (not the market) is what's stuck; bring a comps-based counter.
- Current owner paid $7k; list at $249k implies a 3311% gain — meaningful room to come down on a strong offer.
Risks & watch-outs
- Climate carrying-cost: major wind risk, 56% chance of damaging wind over 30y — expect insurance premiums to compound above CPI over the hold.
Questions for the listing agent
- What do current leases actually rent for vs. the listed asking? Can we see a recent rent roll and the last 12 months of T-12 income?
- Built in 1972 — when were the roof, HVAC, electrical panel, plumbing, and water heater last replaced?
- What does the HOA fee cover, when was the last increase, and are there any pending special assessments or reserve-fund shortfalls?
- Is there a deadline driving the sale (1031 exchange, divorce, estate, relocation)? That informs how much negotiation room exists.
- Schools are B-rated — typically a magnet for longer-tenancy family renters. What's the average tenant stay here, and is there a school-zone premium baked into asking?
- The area grade is low — what's the realistic commute time and amenity access for the typical tenant pool here? Any planned neighborhood developments (good or bad) we should know about?
- What's the average days-on-market for RENTAL listings here right now (not sales)? A rising rental-DOM trend means longer vacancies and softer asking-rent achievability than the comps imply.
- What's the recent tenant-quality profile in this submarket — average credit score on applications, eviction rate, late-payment / NSF rate, and stable-employment percentage? A property-management company in the area should have these aggregated.
- How much new for-sale + rental construction is in the pipeline within 1–3 miles? Heavy new supply typically softens prices + rents 12–24 months out; constrained supply supports both.
Investment metrics
- 1% rule
- 0.99% ✗
- Cap rate
- 5.82%
- Cash-on-cash
- -1.70%
- DSCR
- 0.92
- GRM
- 8.5
CMA / ARV
- ARV (on-the-fly)
- $332,400
- Comps found
- 12
Show comp detail 12 sales within ~0.75 mi
| Address | Dist | Beds/Ba | Sqft | Sold | Price | $/sf | Match |
|---|---|---|---|---|---|---|---|
| 37 Hope Dr #37 | 0.41mi | 2/1.5 | 1,192 (-1%) | 16mo | $305,000 | $256 | 66 |
| 28 Powderhouse Ct #28 | 0.47mi | 3/1.5 (+1) | 1,190 (-1%) | 8mo | $319,000 | $268 | 65 |
| 6 Adams Ct #6 | 0.54mi | 3/1.5 (+1) | 1,190 (-1%) | 4mo | $315,000 | $265 | 65 |
| 26 Pamela Ln #26 | 0.47mi | 2/1.5 | 1,310 (+9%) | 1mo | $360,000 | $275 | 62 |
| 27 Mason Ct #27 | 0.52mi | 3/1.5 (+1) | 1,190 (-1%) | 10mo | $285,000 | $239 | 61 |
| 10 Mason Ct #10 | 0.65mi | 3/1.5 (+1) | 1,190 (-1%) | 5mo | $345,000 | $290 | 59 |
| 29 Adams Ct #29 | 0.57mi | 3/1.5 (+1) | 1,190 (-1%) | 10mo | $330,000 | $277 | 59 |
| 18 Senee Ct #18 | 0.56mi | 3/1.5 (+1) | 1,190 (-1%) | 11mo | $371,500 | $312 | 58 |
| 28 Adams Ct #28 | 0.56mi | 3/1.5 (+1) | 1,190 (-1%) | 15mo | $329,000 | $276 | 55 |
| 1 Senee Ct #1 | 0.56mi | 3/1.5 (+1) | 1,190 (-1%) | 16mo | $359,000 | $302 | 54 |
| 3 Tremont Ave Unit A | 0.65mi | 3/2.0 (+1) | 1,106 (-8%) | 3mo | $451,731 | $408 | 47 |
| 21 Whittier Meadows Dr #21 | 0.74mi | 2/1.5 | 1,340 (+12%) | 15mo | $400,000 | $299 | 34 |
Match score weights: distance 35% · size 25% · config 20% · recency 20%. Top-matched comps best support the ARV.
Projected returns pro-forma
-3.0% appreciation · 7.0% rent growth · sell at horizon
- IRR
- -13.8%
- Equity multiple
- 0.48×
- Total profit
- $-36,150
- Equity at exit
- $37,127
- IRR
- 1.2%
- Equity multiple
- 1.10×
- Total profit
- $7,110
- Equity at exit
- $21,529
Cash invested: $69,720 (down + closing). Projections, not guarantees.
Landlord ↔ Tenant lean methodology
- Overall (STATE)
- 20 Strongly Tenant-Friendly
- State Massachusetts
- 20 Strongly Tenant-Friendly · D+15
- County
- — inherits STATE
- City
- — inherits STATE
ZIP-level market 01913
- Home prices YoY
- -30.4%
- Rents YoY
- 7.0%
- Active inventory
- 38
- Price-to-rent
- 8.5×
Monthly cashflow live
- Estimated rent
- $2,453 high interval (Pro) →
- Mortgage (P&I)
- −$1,306
- Tax est. 1.5%
- −$311 /mo · $3,735/yr
- Insurance
- −$104
- HOA
- −$316
- Vacancy / Maint / Mgmt
- −$515
- Net cashflow
- $-99
Break-even live
Sensitivity live
| Price | -10% $73 | -5% $-13 | +0% $-99 | +5% $-185 | +10% $-271 |
|---|---|---|---|---|---|
| Rent | -10% $-293 | -5% $-196 | +0% $-99 | +5% $-2 | +10% $95 |
| Rate | -1.0pp $26 | -0.5pp $-36 | base $-99 | +0.5pp $-163 | +1.0pp $-229 |
UW: 25.0% down · 7.5% · 30yr · 1.5% tax · 5.0% vac · 8.0% maint · 8.0% mgmt
Financing live
Cash to close
- Down payment
- $62,250
- Closing costs
- $7,470
- Reserves months
- —
- Total cash needed
- —
Loan-product check · same deal, 3 products live
Conventional
25% down · 7.5% · 30yr
- Down + closing
- —
- Monthly P&I
- —
- Monthly cashflow
- —
- DSCR
- —
- Eligible?
- —
Personal DTI + credit; lowest rate.
DSCR
20% down · 8.5% · 30yr
- Down + closing
- —
- Monthly P&I
- —
- Monthly cashflow
- —
- DSCR
- —
- Eligible?
- —
No personal income docs; deal must DSCR.
Hard money
10% down · 12.0% · 12mo
- Down + closing
- —
- Monthly P&I
- —
- Monthly cashflow
- —
- DSCR
- —
- Eligible?
- —
Short-term bridge; refi at stabilization.
Rent comps 6 comps
| Address | Beds | Baths | Sqft | Rent | $/sqft | DOM | Units | Dist |
|---|---|---|---|---|---|---|---|---|
| 100-106 Whitehall Rd Amesbury, MA | 1.0–2.0 | 1.0 | 675 | $2,100 | $3.11 | 0d | 4 | 0.23mi |
| 164 Whitehall Rd Amesbury, MA | 1.0–2.0 | 1.0 | 784 | $2,250 | $2.87 | 0d | 7 | 0.54mi |
| 8 Carriage Hill Rd Unit CH8-23 Amesbury, MA | 2.0 | 1.0 | 700 | $2,250 | $3.21 | 0d | 1 | 0.71mi |
| 23 Chester St #1 Amesbury, MA | 1.0 | 1.5 | 903 | $2,900 | $3.21 | 0d | 1 | 0.72mi |
| 106 Main St Amesbury, MA | 2.0 | 1.5 | 1300 | $3,400 | $2.62 | 13d | 1 | 1.01mi |
| 10 Harrison Ave Fl 2 Amesbury, MA | 2.0 | 1.0 | 850 | $2,375 | $2.79 | 25d | 1 | 1.08mi |
HOA detail
- Monthly dues
- $316 · $3,792/yr
- Likely covers
- water
Listing history 10 events
-
2026-06-21days on market $249,000 Active 12 DOM
-
2026-06-18days on market $249,000 Active 9 DOM
-
2026-06-17days on market $249,000 Active 8 DOM
-
2026-06-16days on market $249,000 Active 7 DOM
-
2026-06-15days on market $249,000 Active 6 DOM
-
2026-06-13statusdays on market $249,000 Active 4 DOM
-
2026-06-13remarks 269-char remark
-
2026-06-13days on market $249,000 New 3 DOM
-
2026-06-10remarks 262-char remark
-
2026-06-10$249,000 New 1 DOM
ⓘ Source: listings_history table (triggers on properties + properties_extension) + one-shot
backfill from property_details.listing_events for pre-trigger history.
Climate risk First Street
- Flood 1/10 Low FEMA zone X (unshaded) · 0% chance over 30 yrs
- Wildfire 3/10 Moderate
- Heat 4/10 Moderate 7 d/yr ≥94°F today · 16 d/yr by 30 yrs out
- Wind 6/10 Major 56% chance of damaging wind over 30 yrs
- Air quality 3/10 Moderate 2 unhealthy d/yr today · 3 by 30 yrs out
Nearby sold comps map
Loading sold comps map…
Walkable amenities ~0.75 mi
Loading nearby amenities…
Taxation est. · year 1
- Rental income
- $29,436
- − Mortgage interest
- −$13,948
- − Property taxes
- −$3,735
- − Insurance
- −$1,245
- − Repairs & maintenance
- −$2,355
- − Management
- −$2,355
- − HOA
- −$3,792
- − Depreciation
- −$7,244
- Taxable loss
- −$5,238
- Est. tax savings @ 24.0%
- +$1,257
- After-tax cash flow
- $70/yr
For passive investors: Depreciation is non-cash, so a rental often shows a tax loss while cash-flowing — sheltering income. Rental losses are passive: they offset passive income freely, and up to $25,000/yr can offset ordinary (W-2) income if you actively participate and your MAGI is under $100k (phasing out to $0 by $150k); unused losses carry forward. On sale, claimed depreciation is recaptured at up to 25%, and gains may owe capital-gains tax (a 1031 exchange can defer both). Figures are a year-1 estimate at your 24.0% rate — not tax advice; consult a CPA.
Schools (NCES district)
- District
- Amesbury
- NCES district ID
- 2501860
- Math proficiency
- 34% ▼ -20.00%
- Reading proficiency
- 51% ▼ -8.00%
- Median HH income
- $75,584
- Composite
- 38.95/100
- National rank
- #4082
- State rank
- #173 of 302 in MA
Livability — Amesbury Town
- Score
- 66/100
- State rank
- #170
- US rank
- #11379
Category grades
Schools grade is shown separately in the Schools card above.
Census & demographics
- Census place
- Amesbury Town, MA
- County
- Essex County · 632,995 people
- City population
- 17,277
- Metro
- Boston-Cambridge-Newton, MA-NH
- Population (ZIP)
- 17,403
- Household income
- $103,554
- Rent vs Own
- Severe rent burden
- 703.0
Population outlook (Essex County) Hauer SSP2
- Today (2025)
- 840,920 people
- By 2030
- 872,201 · +3.7%
- By 2040
- 927,918 · +10.3%
- By 2050
- 970,206 · +15.4%
- By 2075
- 1,077,993 · +28.2%
- By 2100
- 1,103,053 · +31.2%
Race, ethnicity, and origin ACS 2023
- Neighborhood character
- Predominantly White (86%)
- Race & ethnicity
- White 86% Two or more races 6% Hispanic / Latino 4% Black 3% Asian 1%
- Common ancestry
- Lithuanian 8% Romanian 5% Slovak 3%
- Foreign-born
- 9% · Canada
- Languages at home
- 92% English-only · Spanish 2% Other Indo-European 2% Arabic 1%
Political lean MEDSL · Essex
- 2024 margin
- Strong D (+20.3) · D 59.2% · R 38.9% · Other 1.9%
- 2008→2024 swing
- 0.0pp no change · 2008: 20.3pp · 2024: 20.3pp
- All cycles
- 2024: D+20.3 2020: D+29.1 2016: D+22.5 2012: D+16.2 2008: D+20.3
Not yet ingested
- Civics
- —
Market trends
- HPI YoY
- ▼ -132.68%
- Current HPI
- 303.1683
- Rent YoY
- ▲ 7.00%
- Metro
- Boston-Cambridge-Newton, MA-NH
- State GDP YoY
- ▲ 2.28%
- F500 in state
- 38
Industry mix (Fortune 500 HQ in MA)
| Industry | F500 HQs | Revenue |
|---|---|---|
| Technology | 3 | $17B |
|
||
| Insurance | 2 | $84B |
|
||
| Retail | 2 | $76B |
|
||
| Life Sciences | 1 | $43B |
|
||
| Energy Technology | 1 | $31B |
|
||
| Aerospace / Defense | 1 | $18B |
|
||
Price history
+228.1% since first listed4 events — show timeline
- 2026-06-09 Listed $249,000 MLS PIN
- 1997-06-30 Sold (MLS) $7,300 MLS PIN
- 1997-05-24 Listing Removed — MLS PIN
- 1997-04-01 Listed $75,900 MLS PIN
Cash-flow waterfall
monthlySold comps — $/sqft
last 12 mo · ≤1 miLoading sold comps…