 Multi-family
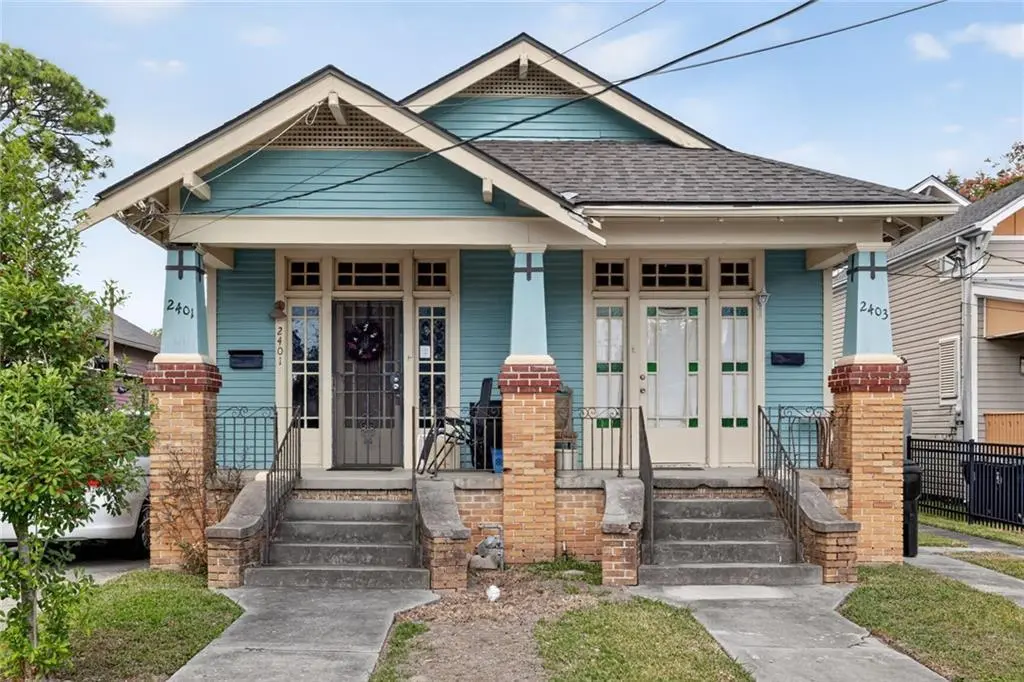
2401 Verbena St · New Orleans, LA
Flood risk 8/10 · Major
- FEMA flood zone
- X
- Chance of flooding over 30 yrs
- 0.6%
- Est. flood insurance / yr
- $507 – $1,088
Fire risk 1/10 · Minimal
- Est. fire insurance / yr
- $1,269 – $2,357
Heat risk 10/10 · Severe
- Hot days now (above 107°F)
- 7 days/yr
- Hot days in 30 yrs
- 21 days/yr
Wind risk 10/10 · Severe
- Chance of severe wind over 30 yrs
- 99.0%
Air-quality risk 4/10 · Minor
- Unhealthy air days now
- 4 days/yr
- Unhealthy air days in 30 yrs
- 4 days/yr
Risk factors via First Street. Map © Google.
Why this score? — see what drove the C grade
The composite is a weighted blend of 9 inputs, each scored 0–100. Each bar is that input's sub-score; the figure is the points it added to the 100-point composite (weight × sub-score).
- Cash flow +24.0/30.0
- ARV discount +11.3/15.0
- DSCR +7.7/10.0
- 1% rule +5.7/10.0
- Livability +4.0/5.0
- Condition / age +2.5/5.0
- Rent growth +2.3/5.0
- Schools +1.6/10.0
- Appreciation +0.0/10.0
$218,000
🖨 Deal sheet (PDF) 📄 Offer letter ✓ Due diligence
Multi-family units
County records classify this as Multi-Family (2-4 Unit). Listing-text estimate: 1 unit. estimate disagrees with records
Listing remarks MLS
Opportunity awaits!!! This Craftsman double offers off-street parking for both units. The double-parlor shotgun layout features hardwood floors and natural light and classic craftsman historic elements. On the interior, many original architectural elements remain intact such as historical molding doors, windows, butler pantries, and antique laundry hamper. Additional features include interior laundry hookups, separate outdoor storage, and private backyards for each unit. Additional features include interior laundry hookups, separate outdoor storage, and private backyards for each unit.
Key facts
- Historic elements
- Natural light
- Off-street parking
Tags
Neighborhood map
What this means for you Summary
Snapshot
- This is a 4-bed/2.0-bath multifamily listed at $218k.
Deal economics
- At list price, monthly cash flow is $360 ($4k/yr) — positive.
- The deal already cash-flows at list — no discount required.
- Meets the 1% rule at list price ($2k rent vs $218k).
- Recommended offer: $192k (12.0% below list) — sets the bar for market timing.
- Cap rate 8.6% vs local median 4.4% in New Orleans — top-decile yield for the area; either an underpriced asset or a hidden risk that comps aren't pricing in. Stress-test before assuming the spread holds.
Location & tenants
- Location reads 81/100 on livability (#3 in LA, #1,383 nationally) — a professional / high-income tenant draw. Strengths: amenities A+, commute A+, health & safety A+; Watch: crime C-, employment D.
- Orleans Parish (urban): math 11% / reading 27% proficiency, ranked #69 of 98 in LA (top 70%) — low school quality limits family demand, transient renter base, plan for 1-2y turnover; 68% free/reduced lunch — lower-income household profile, screen leases tightly.
- Zoned schools: Benjamin Franklin Elem. Math And Science (math 12% / reading 23%, grade F, #479 of 646 statewide, top 75%, 747 students, 98% FRL, charter) — zoned schools average 98% FRL vs 68% district-wide (30 pts higher); higher-poverty schools than district average — tighter screening recommended.
- Market conditions: Rents soft (-0.6%/yr); 336 active listings in the ZIP; 40 comparable units currently listed for rent nearby; rentals at typical pace (median 22d on market — plan ~3-4 weeks tenant-placement turnaround); 710 units permitted in Orleans Parish in 2024 (244 in 5+ unit buildings).
- At $2,334/mo this rent would consume 57% of the median local household income ($49k/yr) (locally 2150% of renters already pay >50% of income on rent) — very limited rent-growth headroom before tenants either downsize or default.
Forward outlook
- Local home prices are declining (-3.0%/yr); year-one equity from $2k of loan paydown is wiped out by about $7k of value loss. Plan a longer hold.
- Orleans County population projected at +61% by 2050 — long-run rental-demand tailwind backs the buy-and-hold thesis.
Negotiation context
- It's been on market 192 days — a 12% lower offer ($192k) is reasonable based on typical stale-listing flexibility.
- 11 sale attempts since 17y ago with the ask held roughly flat each time — persistent listings suggest the price (not the market) is what's stuck; bring a comps-based counter.
- Current owner paid $124k; list at $218k implies a 76% gain — meaningful room to come down on a strong offer.
Risks & watch-outs
- Watch-outs: flood insurance adds $66/mo; built in 1940 — expect roof / HVAC / electrical / plumbing capex.
- Climate carrying-cost: severe flood risk; severe wind risk, 99% chance of damaging wind over 30y; extreme-heat days projected 7→21/yr by 2055 (HVAC capex compounding) — expect insurance premiums to compound above CPI over the hold.
Questions for the listing agent
- It's been on market 192 days. Have you received any prior offers? Is the seller open to a 12% concession, seller financing, or rate buy-down credit?
- Built in 1940 — when were the roof, HVAC, electrical panel, plumbing, and water heater last replaced?
- What's the actual annual flood-insurance premium (NFIP or private), and is the property in a SFHA with mandatory coverage?
- Why hasn't it sold? Are there any deal-killer items the seller is aware of (foundation, flood, title, zoning, code violations)?
- Is there a deadline driving the sale (1031 exchange, divorce, estate, relocation)? That informs how much negotiation room exists.
- What's the average days-on-market for RENTAL listings here right now (not sales)? A rising rental-DOM trend means longer vacancies and softer asking-rent achievability than the comps imply.
- What's the recent tenant-quality profile in this submarket — average credit score on applications, eviction rate, late-payment / NSF rate, and stable-employment percentage? A property-management company in the area should have these aggregated.
- How much new apartment / multifamily construction is in the pipeline within 1–3 miles? Heavy new supply (>2% of stock underway) typically softens rents 12–24 months out; light construction supports rent growth.
Investment metrics
- 1% rule
- 1.07% ✓
- Cap rate
- 8.64%
- Cash-on-cash
- 8.38%
- DSCR
- 1.37
- GRM
- 7.8
CMA / ARV
- ARV (median comp)
- $238,103
- List price
- $218,000
- Delta
- -8.44%
- Verdict
- FAIR
- Comps
- 20 within 1.0 mi
Show comp detail 10 sales within ~0.75 mi
| Address | Dist | Beds/Ba | Sqft | Sold | Price | $/sf | Match |
|---|---|---|---|---|---|---|---|
| 2127-29 Mandolin St | 0.44mi | 4/2.0 | 1,474 (+0%) | 3mo | $230,000 | $156 | 76 |
| 2483 85 Verbena St | 0.12mi | 4/2.5 | 1,680 (+14%) | 4mo | $237,000 | $141 | 66 |
| 2633 35 Gladiolus St | 0.33mi | 4/2.0 | 1,632 (+11%) | 7mo | $226,000 | $138 | 60 |
| 3533 Piedmont Dr | 0.39mi | 4/2.0 | 1,605 (+9%) | 20mo | $250,000 | $156 | 50 |
| 2258 60 Pleasure St | 0.48mi | 5/2.0 (+1) | 1,600 (+9%) | 17mo | $174,000 | $109 | 44 |
| 3638 40 Elysian Fields Ave | 0.42mi | 4/2.0 | 1,671 (+14%) | 18mo | $289,000 | $173 | 43 |
| 3025 Saint Roch Ave | 0.72mi | 3/2.0 (-1) | 1,317 (-10%) | 6mo | $126,000 | $96 | 39 |
| 2625 27 Sage St | 0.54mi | 4/2.0 | 1,668 (+13%) | 19mo | $302,500 | $181 | 37 |
| 2032 34 Elysian Fields Ave | 0.62mi | 4/2.0 | 1,668 (+13%) | 15mo | $310,000 | $186 | 36 |
| 4424 Annette St | 0.71mi | 4/3.5 | 1,664 (+13%) | 17mo | $230,000 | $138 | 25 |
Match score weights: distance 35% · size 25% · config 20% · recency 20%. Top-matched comps best support the ARV.
Projected returns pro-forma
-3.0% appreciation · 0.0% rent growth · sell at horizon
- IRR
- -8.8%
- Equity multiple
- 0.69×
- Total profit
- $-19,220
- Equity at exit
- $32,505
- IRR
- -3.9%
- Equity multiple
- 0.78×
- Total profit
- $-13,566
- Equity at exit
- $18,849
Cash invested: $61,040 (down + closing). Projections, not guarantees.
Landlord ↔ Tenant lean methodology
- Overall (STATE)
- 90 Strongly Landlord-Friendly
- State Louisiana
- 90 Strongly Landlord-Friendly · R+12
- County
- — inherits STATE
- City
- — inherits STATE
ZIP-level market 70122
- Rents YoY
- -0.6%
- Active inventory
- 336
- Price-to-rent
- 15.6×
Monthly cashflow live
- Estimated rent
- $2,334 high interval (Pro) →
- Mortgage (P&I)
- −$1,143
- Tax from tax record
- −$183 /mo · $2,201/yr
- Insurance
- −$91
- Flood insurance flood zone
- −$66 /mo · $798/yr
- HOA
- −$0
- Vacancy / Maint / Mgmt
- −$490
- Net cashflow
- $360
Break-even live
Sensitivity live
| Price | -10% $483 | -5% $422 | +0% $360 | +5% $298 | +10% $237 |
|---|---|---|---|---|---|
| Rent | -10% $176 | -5% $268 | +0% $360 | +5% $452 | +10% $544 |
| Rate | -1.0pp $470 | -0.5pp $415 | base $360 | +0.5pp $303 | +1.0pp $246 |
2-unit breakdown (identical units grouped — click to expand)
| Units | Beds | Baths | Est. rent |
|---|---|---|---|
| 2× units | 2 | 1 | $2,334 |
| #1 | 2 | 1 | $1,167 |
| #2 | 2 | 1 | $1,167 |
| Total (2 units) | $2,334 | ||
UW: 25.0% down · 7.5% · 30yr · 1.5% tax · 5.0% vac · 8.0% maint · 8.0% mgmt
Financing live
Cash to close
- Down payment
- $54,500
- Closing costs
- $6,540
- Reserves months
- —
- Total cash needed
- —
Loan-product check · same deal, 3 products live
Conventional
25% down · 7.5% · 30yr
- Down + closing
- —
- Monthly P&I
- —
- Monthly cashflow
- —
- DSCR
- —
- Eligible?
- —
Personal DTI + credit; lowest rate.
DSCR
20% down · 8.5% · 30yr
- Down + closing
- —
- Monthly P&I
- —
- Monthly cashflow
- —
- DSCR
- —
- Eligible?
- —
No personal income docs; deal must DSCR.
Hard money
10% down · 12.0% · 12mo
- Down + closing
- —
- Monthly P&I
- —
- Monthly cashflow
- —
- DSCR
- —
- Eligible?
- —
Short-term bridge; refi at stabilization.
Rent comps 40 comps
| Address | Beds | Baths | Sqft | Rent | $/sqft | DOM | Units | Dist |
|---|---|---|---|---|---|---|---|---|
| 4023 Franklin Ave New Orleans, LA | 3.0 | 2.0 | 1000 | $1,700 | $1.70 | 5d | 1 | 0.26mi |
| 3907 Elysian Fields Ave New Orleans, LA | 3.0 | 2.0 | 1652 | $3,000 | $1.82 | 25d | 1 | 0.31mi |
| 3540 Clermont Dr New Orleans, LA | 3.0 | 2.0 | 1248 | $1,975 | $1.58 | 25d | 1 | 0.40mi |
| 4618 Marigny St New Orleans, LA | 3.0 | 1.0 | 1320 | $1,900 | $1.44 | 25d | 1 | 0.44mi |
| 2647 Myrtle St Unit 2647 New Orleans, LA | 4.0 | 2.0 | 1445 | $2,550 | $1.76 | 45d | 1 | 0.45mi |
| 2754 Jasmine St New Orleans, LA | 3.0 | 1.0 | 1020 | $1,750 | $1.72 | 25d | 1 | 0.46mi |
| 2509 Sage St New Orleans, LA | 3.0 | 1.0 | 1250 | $1,650 | $1.32 | 23d | 1 | 0.46mi |
| 2646 Elder St New Orleans, LA | 3.0 | 3.0 | 1284 | $2,200 | $1.71 | 19d | 1 | 0.52mi |
| 2644 Elder St New Orleans, LA | 3.0 | 3.0 | 1284 | $2,200 | $1.71 | 19d | 1 | 0.52mi |
| 3327 Elysian Fields Ave New Orleans, LA | 3.0 | 1.0 | 1200 | $1,300 | $1.08 | 25d | 1 | 0.57mi |
| 2739 Bay St Unit B New Orleans, LA | 4.0 | 2.0 | 1400 | $1,800 | $1.29 | 22d | 1 | 0.66mi |
| 4767 Lafaye St New Orleans, LA | 3.0 | 2.0 | 1469 | $2,000 | $1.36 | 25d | 1 | 0.67mi |
| 3515 Saint Anthony Ave New Orleans, LA | 3.0 | 2.0 | 1366 | $2,500 | $1.83 | 25d | 1 | 0.69mi |
| 4936 Baccich St New Orleans, LA | 3.0 | 1.0 | 1053 | $1,700 | $1.61 | 25d | 1 | 0.76mi |
| 4736 Saint Anthony Ave New Orleans, LA | 3.0 | 1.0 | 1100 | $1,800 | $1.64 | 18d | 1 | 0.79mi |
| 5172 Venus St Unit 5172 New Orleans, LA | 3.0 | 2.5 | 1864 | $2,450 | $1.31 | 25d | 1 | 0.82mi |
| 2152 Abundance St Unit 2152 New Orleans, LA | 3.0 | 2.0 | 1100 | $1,599 | $1.45 | 5d | 1 | 0.85mi |
| 4815 Warrington Dr New Orleans, LA | 3.0 | 2.0 | 1652 | $2,150 | $1.30 | 18d | 1 | 0.98mi |
| 5151 Saint Anthony Ave New Orleans, LA | 3.0 | 2.0 | 1200 | $1,795 | $1.50 | 18d | 1 | 1.00mi |
| 3607 Havana St New Orleans, LA | 3.0 | 2.0 | 1693 | $1,488 | $0.88 | 19d | 1 | 1.00mi |
| 3624 Havana St New Orleans, LA | 3.0 | 1.0 | 1388 | $1,875 | $1.35 | 18d | 1 | 1.02mi |
| 2338 40 Annette St New Orleans, LA | 3.0 | 1.0 | 1150 | $1,385 | $1.20 | 22d | 1 | 1.04mi |
| 5519 Mandeville St New Orleans, LA | 3.0 | 1.0 | 1125 | $1,650 | $1.47 | 5d | 1 | 1.07mi |
| 1933 Industry St New Orleans, LA | 3.0 | 2.0 | 1400 | $1,595 | $1.14 | 18d | 1 | 1.12mi |
| 2817 Annette St New Orleans, LA | 3.0 | 1.0 | 1100 | $1,350 | $1.23 | 25d | 1 | 1.13mi |
| 5322 Saint Anthony Ave New Orleans, LA | 3.0 | 2.0 | 1192 | $2,000 | $1.68 | 18d | 1 | 1.18mi |
| 3316 Metropolitan St New Orleans, LA | 3.0 | 2.0 | 1184 | $1,700 | $1.44 | 25d | 1 | 1.21mi |
| 3302 Metropolitan St New Orleans, LA | 4.0 | 2.5 | 1700 | $2,200 | $1.29 | 19d | 1 | 1.22mi |
| 5546 Pasteur Blvd Unit A New Orleans, LA | 3.0 | 1.0 | 1200 | $1,400 | $1.17 | 25d | 1 | 1.24mi |
| 3021 Republic St New Orleans, LA | 4.0 | 2.0 | 1125 | $2,200 | $1.96 | 25d | 1 | 1.24mi |
| 2458 Athis St New Orleans, LA | 4.0 | 2.0 | 1530 | $2,200 | $1.44 | 25d | 1 | 1.24mi |
| 3228 Pauger St New Orleans, LA | 5.0 | 2.0 | 1600 | $2,100 | $1.31 | 25d | 1 | 1.25mi |
| 1996 Hope St New Orleans, LA | 3.0 | 1.0 | 910 | $1,550 | $1.70 | 5d | 1 | 1.28mi |
| 5718 Vermillion Blvd Unit A New Orleans, LA | 3.0 | 1.0 | 1300 | $2,000 | $1.54 | 25d | 1 | 1.30mi |
| 3023 Bruxelles St New Orleans, LA | 3.0 | 1.0 | 960 | $2,200 | $2.29 | 16d | 1 | 1.31mi |
| 5723 Pasteur Blvd New Orleans, LA | 3.0 | 2.0 | 1150 | $1,700 | $1.48 | 19d | 1 | 1.33mi |
| 2556 N Tonti St New Orleans, LA | 3.0 | 2.0 | 1100 | $1,850 | $1.68 | 18d | 1 | 1.33mi |
| 5550 Press Dr New Orleans, LA | 3.0 | 2.0 | 1640 | $2,000 | $1.22 | 18d | 1 | 1.34mi |
| 2222 Saint Roch Ave New Orleans, LA | 3.0 | 1.0 | 900 | $1,200 | $1.33 | 25d | 1 | 1.34mi |
| 1486 Mandolin St New Orleans, LA | 3.0 | 2.0 | 1497 | $1,900 | $1.27 | 5d | 1 | 1.35mi |
Listing history 27 events
-
2026-06-21days on market $218,000 Active 192 DOM
-
2026-06-18days on market $218,000 Active 189 DOM
-
2026-06-17days on market $218,000 Active 188 DOM
-
2026-06-16days on market $218,000 Active 187 DOM
-
2026-06-15days on market $218,000 Active 186 DOM
-
2026-06-13days on market $218,000 Active 184 DOM
-
2026-06-10days on market $218,000 Active 181 DOM
-
2026-06-09days on market $218,000 Active 180 DOM
-
2026-06-08days on market $218,000 Active 179 DOM
-
2026-06-07days on market $218,000 Active 178 DOM
-
2026-06-05days on market $218,000 Active 175 DOM
-
2026-06-03days on market $218,000 Active 174 DOM
-
2026-06-02days on market $218,000 Active 173 DOM
-
2026-06-01days on market $218,000 Active 172 DOM
-
2026-05-31days on market $218,000 Active 171 DOM
-
2025-12-11$218,000 Active 592-char remark
Show marketing remark (592 chars)
Opportunity awaits!!! This Craftsman double offers off-street parking for both units. The double-parlor shotgun layout features hardwood floors and natural light and classic craftsman historic elements. On the interior, many original architectural elements remain intact such as historical molding doors, windows, butler pantries, and antique laundry hamper. Additional features include interior laundry hookups, separate outdoor storage, and private backyards for each unit. Additional features include interior laundry hookups, separate outdoor storage, and private backyards for each unit.
-
2014-11-03soldstatus $124,000
-
2013-01-03$128,888
-
2012-06-18$128,900
-
2012-06-18$128,900
-
2010-06-14$128,900
-
2010-06-14$128,900
-
2010-02-19$139,900
-
2010-02-19$139,900
-
2009-03-27$159,000
-
2009-03-27$159,000
ⓘ Source: listings_history table (triggers on properties + properties_extension) + one-shot
backfill from property_details.listing_events for pre-trigger history.
Tax reassessment forecast LA · Resets to sale price
- Current annual tax
- $2,201 · $183/mo
- Projected year-2 tax
- $2,201 · $183/mo
- Expected delta
- $0/yr ($0/mo · 0.0%)
ⓘ Screening estimate from a state-policy table — verify with the county assessor before closing.
Climate risk First Street
- Flood 8/10 Severe FEMA zone X · 60% chance over 30 yrs
- Wildfire 1/10 Low
- Heat 10/10 Extreme 7 d/yr ≥107°F today · 21 d/yr by 30 yrs out
- Wind 10/10 Extreme 99% chance of damaging wind over 30 yrs
- Air quality 4/10 Moderate 4 unhealthy d/yr today · 4 by 30 yrs out
Nearby sold comps map
Loading sold comps map…
Walkable amenities ~0.75 mi
Loading nearby amenities…
Taxation est. · year 1
- Rental income
- $28,008
- − Mortgage interest
- −$12,211
- − Property taxes
- −$2,201
- − Insurance
- −$1,888
- − Repairs & maintenance
- −$2,241
- − Management
- −$2,241
- − Depreciation
- −$6,342
- Taxable income
- $885
- Est. tax owed @ 24.0%
- −$212
- After-tax cash flow
- $4,107/yr
For passive investors: Depreciation is non-cash, so a rental often shows a tax loss while cash-flowing — sheltering income. Rental losses are passive: they offset passive income freely, and up to $25,000/yr can offset ordinary (W-2) income if you actively participate and your MAGI is under $100k (phasing out to $0 by $150k); unused losses carry forward. On sale, claimed depreciation is recaptured at up to 25%, and gains may owe capital-gains tax (a 1031 exchange can defer both). Figures are a year-1 estimate at your 24.0% rate — not tax advice; consult a CPA.
Schools (NCES district)
- District
- Orleans Parish
- NCES district ID
- 2201170
- Math proficiency
- 11% ▼ -52.00%
- Reading proficiency
- 27% ▼ -46.00%
- Median HH income
- $37,011
- Composite
- 15.78/100
- National rank
- #9271
- State rank
- #69 of 98 in LA
Livability — New Orleans
- Score
- 81/100
- State rank
- #3
- US rank
- #1383
Category grades
Schools grade is shown separately in the Schools card above.
Census & demographics
- Census place
- New Orleans, LA
- County
- Orleans Parish · 338,817 people
- City population
- 338,817
- Metro
- New Orleans-Metairie, LA
- Population (ZIP)
- 35,253
- Household income
- $49,455
- Rent vs Own
- Severe rent burden
- 2150.0
Population outlook (Orleans County) Hauer SSP2
- Today (2025)
- 513,025 people
- By 2030
- 575,781 · +12.2%
- By 2040
- 700,174 · +36.5%
- By 2050
- 826,541 · +61.1%
- By 2075
- 1,123,374 · +119.0%
- By 2100
- 1,355,609 · +164.2%
Race, ethnicity, and origin ACS 2023
- Neighborhood character
- Predominantly Black (69%)
- Race & ethnicity
- Black 69% White 18% Two or more races 7% Hispanic / Latino 6% Asian 1%
- Hispanic origin (detail)
- Mexican 1%
- Common ancestry
- Lithuanian 4% Italian 2% Slovak 1%
- Foreign-born
- 4% · Canada, China
- Languages at home
- 92% English-only · Spanish 5% Chinese 1% French/Haitian/Cajun 1%
Political lean MEDSL · Orleans
- 2024 margin
- Solid D (+67.0) · D 82.2% · R 15.2% · Other 2.7%
- 2008→2024 swing
- +6.7pp toward D · 2008: 60.3pp · 2024: 67.0pp
- All cycles
- 2024: D+67.0 2020: D+68.2 2016: D+66.2 2012: D+62.5 2008: D+60.3
Not yet ingested
- Civics
- —
Market trends
- HPI YoY
- ▼ -222.37%
- Current HPI
- 231.9921
- Rent YoY
- ▼ -0.61%
- Metro
- New Orleans-Metairie, LA
- State GDP YoY
- ▲ 3.29%
- F500 in state
- 10
Industry mix (Fortune 500 HQ in LA)
| Industry | F500 HQs | Revenue |
|---|---|---|
| Telecommunications | 2 | $23B |
|
||
| Utilities | 1 | $12B |
|
||
| Wholesale / Distribution | 1 | $5B |
|
||
| Advertising | 1 | $2B |
|
||
Price history
+37.1% since first listed12 events — show timeline
- 2025-12-11 Listed $218,000 GSREIN
- 2025-12-11 Listed $218,000 AcadianaMLS
- 2014-11-03 Sold (Public Records) $124,000 Public Records
- 2013-01-03 Listed $128,888 AcadianaMLS
- 2012-06-18 Listed $128,900 GSREIN
- 2012-06-18 Listed $128,900 AcadianaMLS
- 2010-06-14 Listed $128,900 GSREIN
- 2010-06-14 Listed $128,900 AcadianaMLS
- 2010-02-19 Listed $139,900 GSREIN
- 2010-02-19 Listed $139,900 AcadianaMLS
- 2009-03-27 Listed $159,000 GSREIN
- 2009-03-27 Listed $159,000 AcadianaMLS
Property tax history
-0.4%/yrLatest (2026): $2,201 · +1.1% YoY. Source: county tax records.
Cash-flow waterfall
monthlySold comps — $/sqft
last 12 mo · ≤1 miLoading sold comps…