 Duplex
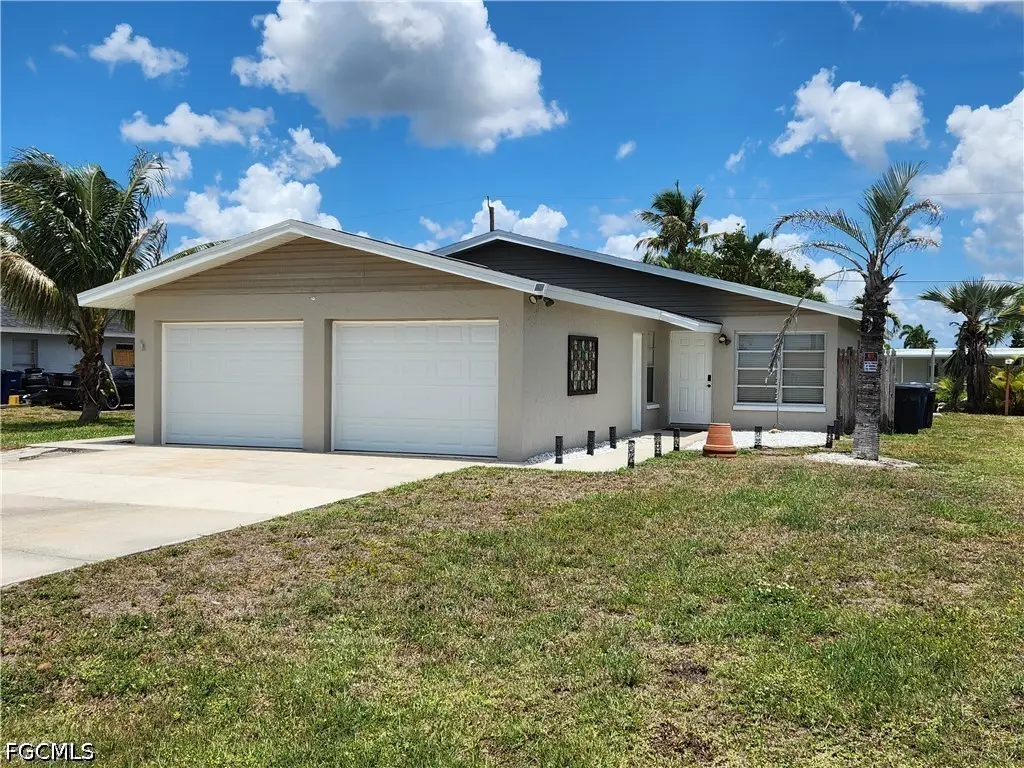
11370 & 11368 Summerwinds Ct #70 · Iona, FL
Flood risk 9/10 · Severe
- FEMA flood zone
- AE
- Chance of flooding over 30 yrs
- 0.99%
- Est. flood insurance / yr
- $1,737 – $8,500
Fire risk 1/10 · Minimal
- Est. fire insurance / yr
- $947 – $1,759
Heat risk 10/10 · Severe
- Hot days now (above 107°F)
- 7 days/yr
- Hot days in 30 yrs
- 29 days/yr
Wind risk 10/10 · Severe
- Chance of severe wind over 30 yrs
- 99.0%
Air-quality risk 2/10 · Minimal
- Unhealthy air days now
- 1 days/yr
- Unhealthy air days in 30 yrs
- 1 days/yr
Risk factors via First Street. Map © Google.
Why this score? — see what drove the D+ grade
The composite is a weighted blend of 9 inputs, each scored 0–100. Each bar is that input's sub-score; the figure is the points it added to the 100-point composite (weight × sub-score).
- Cash flow +17.7/30.0
- ARV discount +7.5/15.0
- DSCR +5.5/10.0
- 1% rule +4.8/10.0
- Schools +4.1/10.0
- Condition / age +4.0/5.0
- Livability +3.6/5.0
- Rent growth +2.2/5.0
- Appreciation +0.0/10.0
$409,000
🖨 Deal sheet (PDF) 📄 Offer letter ✓ Due diligence
Multi-family units
County records classify this as Multi-Family (2-4 Unit). Listing-text estimate: 2 units. confirmed
Listing remarks
Location, Location, Location --- Just minutes from Ft Myer's Beach and not far from Sanibel, this duplex offers a prime location along wuth a great income. Each unit has two bedrooms, 1 bath, garage, and screened lanai. The inside laundry includes a washer and dryer. Other appliances included are refrigerator, stove, dishwasher and microwave. The duplex is updated with vinyl plank flooring throughout. Both garages have auto garage door openers and provide lots of extra storage space. The roof was new in 2023 and the duplex has been freshly painted. This is a great property for the owner/investor who wants to live near the beach and have some extra income or the investor, as this is a high d
Key facts
- Extra storage space
- Screened lanai
- Freshly painted
Tags
Property features AI
Finance
- Financial info: Gross scheduled income: $18,480; Operating expenses: $12,870; Actual rent (example unit): $1,540; Pro forma rent (example unit): $1,540; Land lease expires 2027-03-31; Tenants are responsible for application fee, credit check, electricity, janitorial service, and water; Pets allowed
- HOA & community: No association fee; Community features include boat facilities
Exterior
- Parking: Each unit includes 1 garage space (attached garage)
- Security: Smoke detectors
- Utilities: Cable available; Sewer: assessment paid; Water: assessment paid
- Home design: Multi-unit property: 1 building with 2 units; Resale condition; Attached garage for units
- Construction: Block, concrete and stucco construction; Shingle roof
- Exterior features: Rectangular lot; Publicly maintained road access; No additional exterior features listed
Interior
- Kitchen: Dishwasher; Range; Microwave; Refrigerator
- Bedrooms: Two-bedroom units (each unit has 2 bedrooms)
- Flooring: Laminate
- Bathrooms: Each unit with 1 full bathroom (2 full bathrooms total in property)
- Heating & cooling: Central heating (electric); Central air conditioning (electric); Ceiling fans
- Interior features: Single-hung and sliding windows; Laminate flooring; Screened lanai/porch; Smoke detectors
- Laundry & utility: Washer and dryer in residence; Laundry in each unit
Neighborhood map
What this means for you Summary
Snapshot
- This is a 2 × 2-bed/1.0-bath units multifamily listed at $409k. Condition is rated good.
Deal economics
- At list price, monthly cash flow is $-98 ($-1k/yr) — negative. Per door: $-49/mo.
- To cash-flow at today's rent, offer at most $395k (3.5% below list).
- To meet the 1% rule (rent ≥ 1% of price), the offer needs to be $399k (2.3% below list).
- Recommended offer: $395k (3.5% below list) — sets the bar for cash-flow.
- Cap rate 7.3% vs local median 2.1% in Iona — top-decile yield for the area; either an underpriced asset or a hidden risk that comps aren't pricing in. Stress-test before assuming the spread holds.
Location & tenants
- Location reads 72/100 on livability (#359 in FL) — a middle-class / working-renter tenant base. Strengths: crime A+, housing A, health & safety A; Watch: amenities F, commute F.
- Lee (suburban): math 47% / reading 50% proficiency, ranked #42 of 73 in FL (top 58%) — families likely to look elsewhere, expect single-tenant / working-renter base with shorter leases.
- Zoned schools: Heights Elementary School (math 74% / reading 67%, grade A-, #333 of 2,144 statewide, top 16%, 1,109 students, 38% FRL); Lexington Middle School (math 55% / reading 54%, grade B-, #183 of 571 statewide, top 34%, 1,138 students, 44% FRL); South Fort Myers High School (math 23% / reading 30%, grade F, #489 of 667 statewide, top 74%, 1,917 students, 50% FRL).
- Market conditions: Rents soft (-1.2%/yr); 1251 active listings in the ZIP; 13 comparable units currently listed for rent nearby; rentals at typical pace (median 25d on market — plan ~3-4 weeks tenant-placement turnaround); solid renter incomes; 15,411 units permitted in Lee County in 2024 (4,686 in 5+ unit buildings).
- At $3,994/mo this rent would consume 64% of the median local household income ($75k/yr) (locally 1944% of renters already pay >50% of income on rent) — very limited rent-growth headroom before tenants either downsize or default.
Forward outlook
- Local home prices are declining (-3.0%/yr); year-one equity from $3k of loan paydown is wiped out by about $12k of value loss. Plan a longer hold.
- Lee County population projected at +44% by 2050 — long-run rental-demand tailwind backs the buy-and-hold thesis.
Negotiation context
- It's been on market 30 days — a 2% lower offer ($403k) is reasonable based on typical stale-listing flexibility.
Risks & watch-outs
- Watch-outs: flood insurance adds $427/mo.
- Climate carrying-cost: in FEMA flood zone AE (mandatory federal flood insurance); severe wind risk, 99% chance of damaging wind over 30y; extreme-heat days projected 7→29/yr by 2055 (HVAC capex compounding) — expect insurance premiums to compound above CPI over the hold.
Questions for the listing agent
- What do current leases actually rent for vs. the listed asking? Can we see a recent rent roll and the last 12 months of T-12 income?
- Can we see the unit-by-unit rent roll, current vacancy, and any below-market leases? What's the average tenancy length?
- What capital expenditures (roof, boiler, parking lot, exteriors) have been made in the last 5 years, and what's planned in the next 2?
- Built in 1976 — when were the roof, HVAC, electrical panel, plumbing, and water heater last replaced?
- What's the actual annual flood-insurance premium (NFIP or private), and is the property in a SFHA with mandatory coverage?
- Is there a deadline driving the sale (1031 exchange, divorce, estate, relocation)? That informs how much negotiation room exists.
- Schools are D-rated, which usually means shorter tenancies and higher turnover. Who's the typical renter profile here, and what's been the actual vacancy rate?
- The area grade is low — what's the realistic commute time and amenity access for the typical tenant pool here? Any planned neighborhood developments (good or bad) we should know about?
- What's the average days-on-market for RENTAL listings here right now (not sales)? A rising rental-DOM trend means longer vacancies and softer asking-rent achievability than the comps imply.
- What's the recent tenant-quality profile in this submarket — average credit score on applications, eviction rate, late-payment / NSF rate, and stable-employment percentage? A property-management company in the area should have these aggregated.
- How much new apartment / multifamily construction is in the pipeline within 1–3 miles? Heavy new supply (>2% of stock underway) typically softens rents 12–24 months out; light construction supports rent growth.
Investment metrics
- 1% rule
- 0.98% ✗
- Cap rate
- 7.26%
- Cash-on-cash
- 3.44%
- DSCR
- 1.15
- GRM
- 8.5
CMA / ARV
No comps found within radius.
Projected returns pro-forma
-3.0% appreciation · 0.0% rent growth · sell at horizon
- IRR
- -21.9%
- Equity multiple
- 0.27×
- Total profit
- $-83,886
- Equity at exit
- $60,983
- IRR
- -27.5%
- Equity multiple
- -0.09×
- Total profit
- $-124,991
- Equity at exit
- $35,363
Cash invested: $114,520 (down + closing). Projections, not guarantees.
Landlord ↔ Tenant lean methodology
- Overall (STATE)
- 87 Strongly Landlord-Friendly
- State Florida
- 87 Strongly Landlord-Friendly · R+3
- County
- — inherits STATE
- City
- — inherits STATE
ZIP-level market 33908
- Home prices YoY
- -32.8%
- Rents YoY
- -1.2%
- Active inventory
- 1251
- Price-to-rent
- 17.1×
Monthly cashflow live
- Estimated rent
- $3,994 high interval (Pro) →
- Mortgage (P&I)
- −$2,145
- Tax est. 1.5%
- −$511 /mo · $6,135/yr
- Insurance
- −$170
- Flood insurance flood zone
- −$427 /mo · $5,118/yr
- HOA
- −$0
- Vacancy / Maint / Mgmt
- −$839
- Net cashflow
- $-98
Break-even live
Sensitivity live
| Price | -10% $185 | -5% $44 | +0% $-98 | +5% $-239 | +10% $-380 |
|---|---|---|---|---|---|
| Rent | -10% $-413 | -5% $-256 | +0% $-98 | +5% $60 | +10% $218 |
| Rate | -1.0pp $108 | -0.5pp $6 | base $-98 | +0.5pp $-204 | +1.0pp $-312 |
2-unit breakdown (identical units grouped — click to expand)
| Units | Beds | Baths | Est. rent |
|---|---|---|---|
| 2× units | 2 | 1 | $3,994 |
| #1 | 2 | 1 | $1,997 |
| #2 | 2 | 1 | $1,997 |
| Total (2 units) | $3,994 | ||
UW: 25.0% down · 7.5% · 30yr · 1.5% tax · 5.0% vac · 8.0% maint · 8.0% mgmt
Financing live
Cash to close
- Down payment
- $102,250
- Closing costs
- $12,270
- Reserves months
- —
- Total cash needed
- —
Loan-product check · same deal, 3 products live
Conventional
25% down · 7.5% · 30yr
- Down + closing
- —
- Monthly P&I
- —
- Monthly cashflow
- —
- DSCR
- —
- Eligible?
- —
Personal DTI + credit; lowest rate.
DSCR
20% down · 8.5% · 30yr
- Down + closing
- —
- Monthly P&I
- —
- Monthly cashflow
- —
- DSCR
- —
- Eligible?
- —
No personal income docs; deal must DSCR.
Hard money
10% down · 12.0% · 12mo
- Down + closing
- —
- Monthly P&I
- —
- Monthly cashflow
- —
- DSCR
- —
- Eligible?
- —
Short-term bridge; refi at stabilization.
Rent comps 13 comps
| Address | Beds | Baths | Sqft | Rent | $/sqft | DOM | Units | Dist |
|---|---|---|---|---|---|---|---|---|
| 11021 Gulf Reflections Dr Fort Myers, FL | 2.0–3.0 | 2.0 | 1674 | $4,200 | $2.51 | 25d | 2 | 0.26mi |
| 15773 Beachcomber Ave Unit 1264830P Fort Myers, FL | 3.0 | 2.0 | 1496 | $3,133 | $2.09 | 15d | 1 | 0.64mi |
| 11701 Pasetto Ln Unit 1049715P Fort Myers, FL | 3.0 | 2.0 | 1496 | $2,960 | $1.98 | 23d | 1 | 0.87mi |
| 11390 Bayside Blvd Fort Myers Beach, FL | 3.0 | 2.0 | 2087 | $2,500 | $1.20 | 25d | 1 | 1.00mi |
| 16126 Kelly Woods Dr Fort Myers, FL | 3.0 | 2.0 | 1564 | $5,800 | $3.71 | 5d | 1 | 1.02mi |
| 15441 Bellamar Cir #1114 Fort Myers, FL | 3.0 | 2.0 | 1580 | $1,450 | $0.92 | 5d | 1 | 1.07mi |
| 11674 Pointe Cir Unit 1 Fort Myers, FL | 3.0 | 2.5 | 1544 | $1,900 | $1.23 | 25d | 1 | 1.36mi |
| 11271 Tamarind Cay Ln #1603 Fort Myers, FL | 3.0 | 2.0 | 1934 | $2,500 | $1.29 | 25d | 1 | 1.37mi |
| 11271 Tamarind Cay Ln #1608 Fort Myers, FL | 3.0 | 2.0 | 1934 | $2,800 | $1.45 | 25d | 1 | 1.37mi |
| 15037 Tamarind Cay Ct #1503 Fort Myers, FL | 3.0 | 2.0 | 1487 | $2,000 | $1.34 | 25d | 1 | 1.38mi |
| 15055 Tamarind Cay Ct #1205 Fort Myers, FL | 3.0 | 2.0 | 1760 | $2,700 | $1.53 | 25d | 1 | 1.41mi |
| 11261 Jacana Ct #1808 Fort Myers, FL | 3.0 | 2.0 | 1934 | $3,200 | $1.65 | 25d | 1 | 1.41mi |
| 11270 Jacana Ct #2101 Fort Myers, FL | 3.0 | 2.0 | 1934 | $2,800 | $1.45 | 25d | 1 | 1.45mi |
Listing history 14 events
-
2026-06-22days on market $409,000 Active 30 DOM
-
2026-06-17days on market $409,000 Active 26 DOM
-
2026-06-16days on market $409,000 Active 25 DOM
-
2026-06-15days on market $409,000 Active 24 DOM
-
2026-06-13days on market $409,000 Active 22 DOM
-
2026-06-10days on market $409,000 Active 19 DOM
-
2026-06-09days on market $409,000 Active 18 DOM
-
2026-06-08days on market $409,000 Active 17 DOM
-
2026-06-07pricedays on market $409,000 Active 16 DOM
-
2026-06-03days on market $419,000 Active 12 DOM
-
2026-06-02days on market $419,000 Active 11 DOM
-
2026-06-01days on market $419,000 Active 10 DOM
-
2026-05-31days on market $419,000 Active 9 DOM
-
2026-05-22$419,000 Active
ⓘ Source: listings_history table (triggers on properties + properties_extension) + one-shot
backfill from property_details.listing_events for pre-trigger history.
Climate risk First Street
- Flood 9/10 Extreme FEMA zone AE · 99% chance over 30 yrs
- Wildfire 1/10 Low
- Heat 10/10 Extreme 7 d/yr ≥107°F today · 29 d/yr by 30 yrs out
- Wind 10/10 Extreme 99% chance of damaging wind over 30 yrs
- Air quality 2/10 Low 1 unhealthy d/yr today · 1 by 30 yrs out
Nearby sold comps map
Loading sold comps map…
Walkable amenities ~0.75 mi
Loading nearby amenities…
Taxation est. · year 1
- Rental income
- $47,928
- − Mortgage interest
- −$22,910
- − Property taxes
- −$6,135
- − Insurance
- −$7,164
- − Repairs & maintenance
- −$3,834
- − Management
- −$3,834
- − Depreciation
- −$11,898
- Taxable loss
- −$7,848
- Est. tax savings @ 24.0%
- +$1,883
- After-tax cash flow
- $710/yr
For passive investors: Depreciation is non-cash, so a rental often shows a tax loss while cash-flowing — sheltering income. Rental losses are passive: they offset passive income freely, and up to $25,000/yr can offset ordinary (W-2) income if you actively participate and your MAGI is under $100k (phasing out to $0 by $150k); unused losses carry forward. On sale, claimed depreciation is recaptured at up to 25%, and gains may owe capital-gains tax (a 1031 exchange can defer both). Figures are a year-1 estimate at your 24.0% rate — not tax advice; consult a CPA.
Condition & rehab AI · 12 photos
This well-maintained and updated duplex is ready for move-in and offers a great location near the beach.
Value-add opportunities
- Both Landscaping and patio furniture — Enhances curb appeal and outdoor living space
- Both Painting exterior and interior — Fresh paint improves appearance and value
- Resale Upgrading kitchen appliances — Modern appliances attract more buyers
Renovation cost estimate screening
Value-add ROI direction
- Both Landscaping and patio furniture — Enhances curb appeal and outdoor living space ↑
- Both Painting exterior and interior — Fresh paint improves appearance and value ↑
- Resale Upgrading kitchen appliances — Modern appliances attract more buyers ↑
ⓘ Cost ranges are severity-bucket heuristics (US national rule-of-thumb). Get contractor quotes + a written scope before underwriting a rehab budget.
Schools (NCES district)
- District
- Lee
- NCES district ID
- 1201080
- Math proficiency
- 47% ▼ -11.00%
- Reading proficiency
- 50% ▼ -4.00%
- Median HH income
- $49,518
- Composite
- 41.49/100
- National rank
- #3458
- State rank
- #42 of 73 in FL
Livability — Iona
- Score
- 72/100
- State rank
- #359
- US rank
- #6253
Category grades
Schools grade is shown separately in the Schools card above.
Census & demographics
- Census place
- Iona, FL
- County
- Lee County · 788,662 people
- Metro
- Cape Coral-Fort Myers, FL
- Population (ZIP)
- 37,423
- Household income
- $75,396
- Rent vs Own
- Severe rent burden
- 1944.0
Population outlook (Lee County) Hauer SSP2
- Today (2025)
- 871,946 people
- By 2030
- 955,468 · +9.6%
- By 2040
- 1,113,587 · +27.7%
- By 2050
- 1,256,891 · +44.1%
- By 2075
- 1,560,270 · +78.9%
- By 2100
- 1,726,848 · +98.0%
Race, ethnicity, and origin ACS 2023
- Neighborhood character
- Predominantly White (88%)
- Race & ethnicity
- White 88% Hispanic / Latino 6% Two or more races 5% Black 3% Asian 1%
- Hispanic origin (detail)
- Mexican 1% Puerto Rican 2%
- Common ancestry
- Romanian 5% Lithuanian 4% Slovak 3%
- Foreign-born
- 10% · Canada, Jamaica
- Languages at home
- 90% English-only · Spanish 4% Russian/Polish/Slavic 1% Other Indo-European 1%
Political lean MEDSL · Lee
- 2024 margin
- Strong R (+28.4) · D 35.5% · R 63.9%
- 2008→2024 swing
- -18.0pp toward R · 2008: -10.4pp · 2024: -28.4pp
- All cycles
- 2024: R+28.4 2020: R+19.2 2016: R+20.4 2012: R+16.6 2008: R+10.4
Not yet ingested
- Civics
- —
Market trends
- HPI YoY
- ▼ -102.22%
- Current HPI
- 209.7595
- Rent YoY
- ▼ -1.18%
- Metro
- Cape Coral-Fort Myers, FL
- State GDP YoY
- ▲ 3.28%
- F500 in state
- 36
Industry mix (Fortune 500 HQ in FL)
| Industry | F500 HQs | Revenue |
|---|---|---|
| Industrial Technology | 2 | $29B |
|
||
| Insurance | 2 | $17B |
|
||
| Retail | 1 | $60B |
|
||
| Technology Distribution | 1 | $58B |
|
||
| Homebuilding | 1 | $35B |
|
||
| Technology Manufacturing | 1 | $35B |
|
||
Price history
1 event — show timeline
- 2026-05-22 Listed $419,000 FORTMLS
Cash-flow waterfall
monthlySold comps — $/sqft
last 12 mo · ≤1 miLoading sold comps…