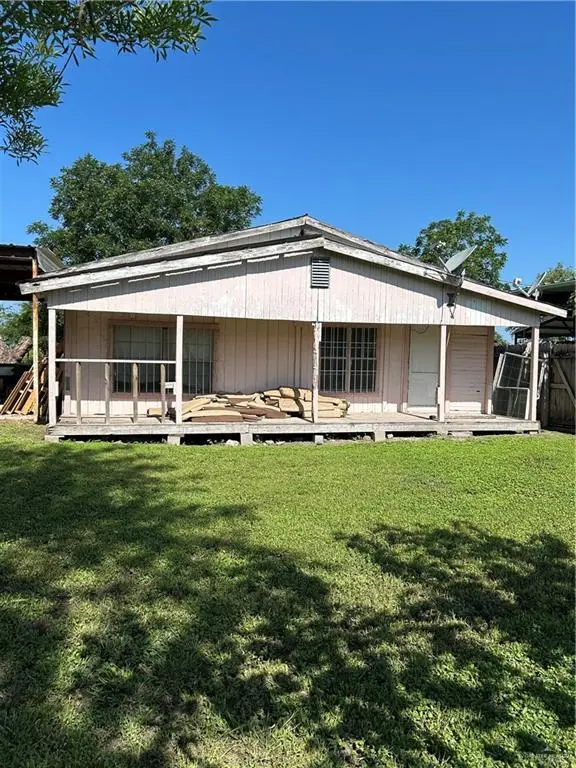
8405 Azucena St · Muniz, TX
Flood risk 8/10 · Major
- FEMA flood zone
- X
- Chance of flooding over 30 yrs
- 0.99%
- Est. flood insurance / yr
- $507 – $1,088
Fire risk 5/10 · Moderate
- Est. fire insurance / yr
- $1,222 – $2,270
Heat risk 9/10 · Severe
- Hot days now (above 111°F)
- 6 days/yr
- Hot days in 30 yrs
- 20 days/yr
Wind risk 9/10 · Severe
- Chance of severe wind over 30 yrs
- 99.0%
Air-quality risk 1/10 · Minimal
- Unhealthy air days now
- 0 days/yr
- Unhealthy air days in 30 yrs
- 0 days/yr
Risk factors via First Street. Map © Google.
Why this score? — see what drove the B+ grade
The composite is a weighted blend of 9 inputs, each scored 0–100. Each bar is that input's sub-score; the figure is the points it added to the 100-point composite (weight × sub-score).
- Cash flow +30.0/30.0
- 1% rule +10.0/10.0
- DSCR +10.0/10.0
- Appreciation +10.0/10.0
- ARV discount +7.5/15.0
- Rent growth +2.5/5.0
- Condition / age +2.5/5.0
- Livability +2.4/5.0
- Schools +1.1/10.0
$50,000
🖨 Deal sheet (PDF) 📄 Offer letter ✓ Due diligence
Listing remarks
Looking for a fixer upper/flip home. Motivated buyers that can see beyond and see potential for this home.
Key facts
- 8,908 sq ft lot
- 2 parking spots
- Built 1972
Property features AI
Finance
- Other: Lot approximately 0.2045 acres (about 8,908 sq ft)
- HOA & community: No association
Exterior
- Parking: 2 total parking spaces; 2 covered spaces; 2-car carport (attached)
- Utilities: Sewer: other
- Home design: Single-story mobile home community setting; Not new construction
- Construction: Frame/wood construction; Shingle roof; Other foundation
- Exterior features: Chain link fencing; Mature trees on lot; Paved road access
Interior
- Kitchen: No conveying appliances
- Flooring: No flooring specified
- Bathrooms: 1 full bathroom
- Interior features: No window coverings; Countertops: other / unspecified
- Laundry & utility: Water heater: none specified
Neighborhood map
What this means for you Summary
Snapshot
- This is a 3-bed/1.0-bath manufactured listed at $50k.
Deal economics
- At list price, monthly cash flow is $561 ($7k/yr) — positive.
- The deal already cash-flows at list — no discount required.
- Meets the 1% rule at list price ($1k rent vs $50k).
- Recommended offer: $49k (1.5% below list) — sets the bar for market timing.
- Cap rate 21.4% vs local median 4.2% in Muniz — top-decile yield for the area; either an underpriced asset or a hidden risk that comps aren't pricing in. Stress-test before assuming the spread holds.
Location & tenants
- Location reads 48/100 on livability (#1,534 in TX) — a working-class tenant base; expect higher turnover. Strengths: cost of living A+, crime A, housing A-; Watch: amenities F, commute F, employment F.
- Donna ISD (suburban): math 11% / reading 18% proficiency, ranked #821 of 826 in TX (top 99%) — low school quality limits family demand, transient renter base, plan for 1-2y turnover.
- Zoned schools: Maria Alicia P Munoz El (math 10% / reading 11%, grade F, #4,243 of 4,322 statewide, top 98%, 754 students, 98% FRL); Veterans Middle (math 7% / reading 12%, grade F, #1,649 of 1,662 statewide, top 99%, 894 students, 100% FRL); Donna North H S (math 8% / reading 17%, grade F, #1,539 of 1,632 statewide, top 95%, 2,091 students, 100% FRL) — zoned schools average 99% FRL vs 48% district-wide (51 pts higher); higher-poverty schools than district average — tighter screening recommended.
- Market conditions: 327 active listings in the ZIP; 7,378 units permitted in Hidalgo County in 2024 (641 in 5+ unit buildings).
Forward outlook
- In year one you build about $5k of equity ($346 loan paydown + $5k appreciation (10.0% local appreciation)).
- Hidalgo County population projected at +28% by 2050 — long-run rental-demand tailwind backs the buy-and-hold thesis.
- At projected returns (10.0% appreciation + 3.0% rent growth), your $14k cash investment doubles in ~2 years — after that, you're playing with house money.
- By year 6, paydown + projected appreciation supports a ~$31k cash-out refi (75% LTV) — recoverable capital for the next deal without selling this one.
Negotiation context
- It's been on market 27 days — a 2% lower offer ($49k) is reasonable based on typical stale-listing flexibility.
- 2 sale attempts since 2y ago with the ask held roughly flat each time — persistent listings suggest the price (not the market) is what's stuck; bring a comps-based counter.
Risks & watch-outs
- Watch-outs: flood insurance adds $66/mo.
- Climate carrying-cost: severe flood risk; severe wind risk, 99% chance of damaging wind over 30y; moderate wildfire risk; extreme-heat days projected 6→20/yr by 2055 (HVAC capex compounding) — expect insurance premiums to compound above CPI over the hold.
Questions for the listing agent
- Built in 1972 — when were the roof, HVAC, electrical panel, plumbing, and water heater last replaced?
- What's the actual annual flood-insurance premium (NFIP or private), and is the property in a SFHA with mandatory coverage?
- Is there a deadline driving the sale (1031 exchange, divorce, estate, relocation)? That informs how much negotiation room exists.
- Schools are F-rated, which usually means shorter tenancies and higher turnover. Who's the typical renter profile here, and what's been the actual vacancy rate?
- What's the average days-on-market for RENTAL listings here right now (not sales)? A rising rental-DOM trend means longer vacancies and softer asking-rent achievability than the comps imply.
- What's the recent tenant-quality profile in this submarket — average credit score on applications, eviction rate, late-payment / NSF rate, and stable-employment percentage? A property-management company in the area should have these aggregated.
- How much new for-sale + rental construction is in the pipeline within 1–3 miles? Heavy new supply typically softens prices + rents 12–24 months out; constrained supply supports both.
Investment metrics
- 1% rule
- 2.53% ✓
- Cap rate
- 21.35%
- Cash-on-cash
- 53.78%
- DSCR
- 3.39
- GRM
- 3.3
CMA / ARV
- ARV (on-the-fly)
- $106,596
- Comps found
- 1
Show comp detail 1 sale within ~0.75 mi
| Address | Dist | Beds/Ba | Sqft | Sold | Price | $/sf | Match |
|---|---|---|---|---|---|---|---|
| 7302 Sequoia St | 0.74mi | 3/2.0 | 1,296 (-2%) | 0mo | $105,000 | $81 | 59 |
Match score weights: distance 35% · size 25% · config 20% · recency 20%. Top-matched comps best support the ARV.
Projected returns pro-forma
10.0% appreciation · 3.0% rent growth · sell at horizon
- IRR
- 62.0%
- Equity multiple
- 5.50×
- Total profit
- $63,036
- Equity at exit
- $45,044
- IRR
- 55.6%
- Equity multiple
- 12.26×
- Total profit
- $157,687
- Equity at exit
- $97,139
Cash invested: $14,000 (down + closing). Projections, not guarantees.
Landlord ↔ Tenant lean methodology
- Overall (STATE)
- 87 Strongly Landlord-Friendly
- State Texas
- 87 Strongly Landlord-Friendly · R+5
- County
- — inherits STATE
- City
- — inherits STATE
ZIP-level market 78537
- Home prices YoY
- 5.8%
- Active inventory
- 327
- Price-to-rent
- 3.3×
Monthly cashflow live
- Estimated rent
- $1,267 medium interval (Pro) →
- Mortgage (P&I)
- −$262
- Tax from tax record
- −$90 /mo · $1,086/yr
- Insurance
- −$21
- Flood insurance flood zone
- −$66 /mo · $798/yr
- HOA
- −$0
- Vacancy / Maint / Mgmt
- −$266
- Net cashflow
- $561
Break-even live
Sensitivity live
| Price | -10% $589 | -5% $575 | +0% $561 | +5% $547 | +10% $533 |
|---|---|---|---|---|---|
| Rent | -10% $461 | -5% $511 | +0% $561 | +5% $611 | +10% $661 |
| Rate | -1.0pp $586 | -0.5pp $574 | base $561 | +0.5pp $548 | +1.0pp $535 |
UW: 25.0% down · 7.5% · 30yr · 1.5% tax · 5.0% vac · 8.0% maint · 8.0% mgmt
Financing live
Cash to close
- Down payment
- $12,500
- Closing costs
- $1,500
- Reserves months
- —
- Total cash needed
- —
Loan-product check · same deal, 3 products live
Conventional
25% down · 7.5% · 30yr
- Down + closing
- —
- Monthly P&I
- —
- Monthly cashflow
- —
- DSCR
- —
- Eligible?
- —
Personal DTI + credit; lowest rate.
DSCR
20% down · 8.5% · 30yr
- Down + closing
- —
- Monthly P&I
- —
- Monthly cashflow
- —
- DSCR
- —
- Eligible?
- —
No personal income docs; deal must DSCR.
Hard money
10% down · 12.0% · 12mo
- Down + closing
- —
- Monthly P&I
- —
- Monthly cashflow
- —
- DSCR
- —
- Eligible?
- —
Short-term bridge; refi at stabilization.
Listing history 20 events
-
2026-06-21days on market $50,000 Active 27 DOM
-
2026-06-18days on market $50,000 Active 24 DOM
-
2026-06-17days on market $50,000 Active 23 DOM
-
2026-06-16days on market $50,000 Active 22 DOM
-
2026-06-15days on market $50,000 Active 21 DOM
-
2026-06-14days on market $50,000 Active 19 DOM
-
2026-06-13days on market $50,000 Active 18 DOM
-
2026-06-10days on market $50,000 Active 16 DOM
-
2026-06-09days on market $50,000 Active 15 DOM
-
2026-06-08days on market $50,000 Active 14 DOM
-
2026-06-07days on market $50,000 Active 13 DOM
-
2026-06-05days on market $50,000 Active 10 DOM
-
2026-06-03days on market $50,000 Active 9 DOM
-
2026-06-02days on market $50,000 Active 8 DOM
-
2026-06-01days on market $50,000 Active 7 DOM
-
2026-05-31days on market $50,000 Active 6 DOM
-
2026-05-31days on market $50,000 Active 5 DOM
-
2026-05-23$50,000 Active
-
2024-06-03$70,000 Active
-
1995-06-16soldstatus
ⓘ Source: listings_history table (triggers on properties + properties_extension) + one-shot
backfill from property_details.listing_events for pre-trigger history.
Tax reassessment forecast TX · Resets to sale price
- Current annual tax
- $1,086 · $90/mo
- Projected year-2 tax
- $1,086 · $90/mo
- Expected delta
- $0/yr ($0/mo · 0.0%)
ⓘ Screening estimate from a state-policy table — verify with the county assessor before closing.
Climate risk First Street
- Flood 8/10 Severe FEMA zone X · 99% chance over 30 yrs
- Wildfire 5/10 Major
- Heat 9/10 Extreme 6 d/yr ≥111°F today · 20 d/yr by 30 yrs out
- Wind 9/10 Extreme 99% chance of damaging wind over 30 yrs
- Air quality 1/10 Low 0 unhealthy d/yr today · 0 by 30 yrs out
Nearby sold comps map
Loading sold comps map…
Walkable amenities ~0.75 mi
Loading nearby amenities…
Taxation est. · year 1
- Rental income
- $15,204
- − Mortgage interest
- −$2,801
- − Property taxes
- −$1,086
- − Insurance
- −$1,048
- − Repairs & maintenance
- −$1,216
- − Management
- −$1,216
- − Depreciation
- −$1,455
- Taxable income
- $6,383
- Est. tax owed @ 24.0%
- −$1,532
- After-tax cash flow
- $5,200/yr
For passive investors: Depreciation is non-cash, so a rental often shows a tax loss while cash-flowing — sheltering income. Rental losses are passive: they offset passive income freely, and up to $25,000/yr can offset ordinary (W-2) income if you actively participate and your MAGI is under $100k (phasing out to $0 by $150k); unused losses carry forward. On sale, claimed depreciation is recaptured at up to 25%, and gains may owe capital-gains tax (a 1031 exchange can defer both). Figures are a year-1 estimate at your 24.0% rate — not tax advice; consult a CPA.
Schools (NCES district)
- District
- Donna ISD
- NCES district ID
- 4817390
- Math proficiency
- 11% ▼ -30.00%
- Reading proficiency
- 18% ▼ -13.00%
- Median HH income
- $27,330
- Composite
- 11.16/100
- National rank
- #9728
- State rank
- #821 of 826 in TX
Livability — Muniz
- Score
- 48/100
- State rank
- #1534
- US rank
- #26137
Category grades
Schools grade is shown separately in the Schools card above.
Census & demographics
- Population (ZIP)
- 51,346
Population outlook (Hidalgo County) Hauer SSP2
- Today (2025)
- 955,232 people
- By 2030
- 1,009,774 · +5.7%
- By 2040
- 1,120,332 · +17.3%
- By 2050
- 1,225,036 · +28.2%
- By 2075
- 1,439,189 · +50.7%
- By 2100
- 1,533,429 · +60.5%
Race, ethnicity, and origin ACS 2023
- Neighborhood character
- Predominantly Hispanic (95%)
- Race & ethnicity
- Hispanic / Latino 95% Two or more races 49% White 4%
- Hispanic origin (detail)
- Mexican 91%
- Foreign-born
- 27% · Canada
- Languages at home
- 15% English-only · Spanish 84%
Political lean MEDSL · Hidalgo
- 2024 margin
- Toss-up / Even · D 48.1% · R 51.0%
- 2008→2024 swing
- -41.6pp toward R · 2008: 38.7pp · 2024: -2.9pp
- All cycles
- 2024: R+2.9 2020: D+17.1 2016: D+40.5 2012: D+41.8 2008: D+38.7
Not yet ingested
- Civics
- —
Market trends
- HPI YoY
- ▲ 13.30%
- Current HPI
- 243.3933
- Rent YoY
- —
- Metro
- —
- State GDP YoY
- ▲ 3.95%
- F500 in state
- 110
Industry mix (Fortune 500 HQ in TX)
| Industry | F500 HQs | Revenue |
|---|---|---|
| Energy | 16 | $1,198B |
|
||
| Technology | 5 | $198B |
|
||
| Engineering / Construction | 4 | $72B |
|
||
| Energy Services | 3 | $60B |
|
||
| Utilities | 3 | $41B |
|
||
| Healthcare | 2 | $330B |
|
||
Price history
-28.6% since first listed3 events — show timeline
- 2026-05-23 Listed $50,000 MCALLENMLS
- 2024-06-03 Listed $70,000 MCALLENMLS
- 1995-06-16 Sold (Public Records) — Public Records
Property tax history
+7.2%/yrLatest (2025): $1,086 · +7.0% YoY. Source: county tax records.
Cash-flow waterfall
monthlySold comps — $/sqft
last 12 mo · ≤1 miLoading sold comps…