 Multi-family
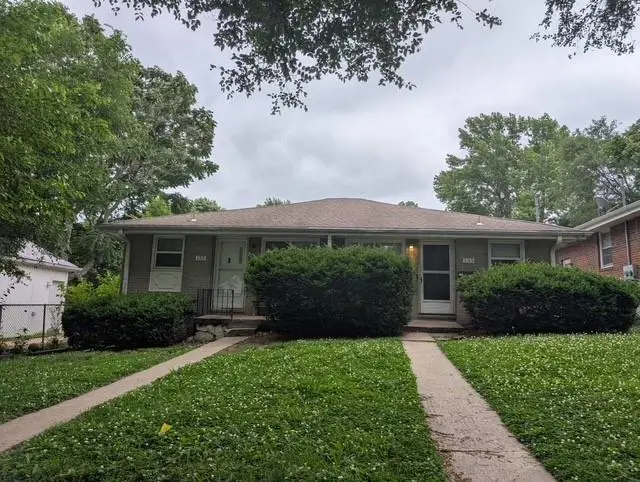
135 S Fuller St · Independence, MO
Flood risk 4/10 · Minor
- FEMA flood zone
- X (unshaded)
- Chance of flooding over 30 yrs
- 0.22%
- Est. flood insurance / yr
- $473 – $860
Fire risk 1/10 · Minimal
- Est. fire insurance / yr
- $1,054 – $1,958
Heat risk 4/10 · Minor
- Hot days now (above 106°F)
- 7 days/yr
- Hot days in 30 yrs
- 17 days/yr
Wind risk 2/10 · Minimal
- Chance of severe wind over 30 yrs
- —
Air-quality risk 3/10 · Minor
- Unhealthy air days now
- 3 days/yr
- Unhealthy air days in 30 yrs
- 3 days/yr
Risk factors via First Street. Map © Google.
Why this score? — see what drove the C grade
The composite is a weighted blend of 9 inputs, each scored 0–100. Each bar is that input's sub-score; the figure is the points it added to the 100-point composite (weight × sub-score).
- Cash flow +24.8/30.0
- DSCR +8.0/10.0
- ARV discount +7.5/15.0
- 1% rule +6.4/10.0
- Livability +4.1/5.0
- Rent growth +3.4/5.0
- Schools +2.7/10.0
- Condition / age +2.0/5.0
- Appreciation +0.0/10.0
$200,000
🖨 Deal sheet 📄 Offer letter ✓ Due diligence
Multi-family units
County records classify this as Multi-Family (2-4 Unit). Listing-text estimate: 1 unit. estimate disagrees with records
Listing remarks
Coming Soon
Key facts
- 6,534 sq ft lot
- Built 1959
Property features AI
Finance
- Other: Maintenance not provided
- Financial info: Gross income reported at $12,000; Operating expenses include maintenance, insurance, and real estate tax
Exterior
- Parking: Off-street parking
- Utilities: Public water; Public sewer; Separate meters for units
- Home design: Duplex (residential income property); Single-story building
- Construction: Brick/mortar construction; Composition roof
- Exterior features: Off-street parking; Property in unknown flood plain status; Lot approximately 0.15 acres
Interior
- Kitchen: Each unit includes range/oven and refrigerator
- Bedrooms: Two-bedroom units (2 units total)
- Heating & cooling: Natural gas heating; Electric cooling (central cooling present)
- Interior features: Basement present
- Laundry & utility: Separate utility meters
Neighborhood map
What this means for you Summary
Snapshot
- This is a 4-bed/?-bath multifamily listed at $200k. Condition is rated fair.
Deal economics
- At list price, monthly cash flow is $425 ($5k/yr) — positive.
- The deal already cash-flows at list — no discount required.
- Meets the 1% rule at list price ($2k rent vs $200k).
- Cap rate 8.8% vs local median 5.0% in Independence — top-decile yield for the area; either an underpriced asset or a hidden risk that comps aren't pricing in. Stress-test before assuming the spread holds.
Location & tenants
- Location reads 82/100 on livability (#10 in MO, #1,296 nationally) — a professional / high-income tenant draw. Strengths: amenities A+, commute A+, cost of living A+; Watch: schools C-, employment D+, crime F.
- Independence 30 (suburban): math 26% / reading 38% proficiency, ranked #252 of 324 in MO (top 78%) — families likely to look elsewhere, expect single-tenant / working-renter base with shorter leases.
- Market conditions: Rents rising (+3.8%/yr); 125 active listings in the ZIP; 24 comparable units currently listed for rent nearby; rentals at typical pace (median 17d on market — plan ~3-4 weeks tenant-placement turnaround); 4,002 units permitted in Jackson County in 2024 (2,271 in 5+ unit buildings).
- At $2,287/mo this rent would consume 56% of the median local household income ($49k/yr) (locally 972% of renters already pay >50% of income on rent) — very limited rent-growth headroom before tenants either downsize or default.
Forward outlook
- Local home prices are declining (-3.0%/yr); year-one equity from $1k of loan paydown is wiped out by about $6k of value loss. Plan a longer hold.
- Jackson County population projected at +4% by 2050 — modest demand growth; plan on rents tracking national, not racing it.
Negotiation context
- Only 1 days on market — expect competitive offers; lowballing is unlikely to land.
Risks & watch-outs
- Watch-outs: built in 1959 — expect roof / HVAC / electrical / plumbing capex.
Questions for the listing agent
- Have any recent inspections been done? Can we get a copy of the seller's disclosures and any deferred-maintenance estimates?
- Built in 1959 — when were the roof, HVAC, electrical panel, plumbing, and water heater last replaced?
- Is there a deadline driving the sale (1031 exchange, divorce, estate, relocation)? That informs how much negotiation room exists.
- Crime grade is F in this area — have there been break-ins, vandalism, or insurance claims at this property in the last 3 years? What carrier currently insures it and at what premium?
- What's the average days-on-market for RENTAL listings here right now (not sales)? A rising rental-DOM trend means longer vacancies and softer asking-rent achievability than the comps imply.
- What's the recent tenant-quality profile in this submarket — average credit score on applications, eviction rate, late-payment / NSF rate, and stable-employment percentage? A property-management company in the area should have these aggregated.
- How much new apartment / multifamily construction is in the pipeline within 1–3 miles? Heavy new supply (>2% of stock underway) typically softens rents 12–24 months out; light construction supports rent growth.
Investment metrics
- 1% rule
- 1.14% ✓
- Cap rate
- 8.84%
- Cash-on-cash
- 9.10%
- DSCR
- 1.40
- GRM
- 7.3
CMA / ARV
No comps found within radius.
Show comp detail 11 sales within ~0.75 mi
| Address | Dist | Beds/Ba | Sqft | Sold | Price | $/sf | Match |
|---|---|---|---|---|---|---|---|
| 105 S Crysler Ave | 0.10mi | 3/9.0 (-1) | — | 2mo | $240,000 | — | 76 |
| 1214 W Waldo Ave | 0.41mi | 4/3.0 | — | 13mo | $159,500 | — | 57 |
| 1611 - 1613 S Claremont N/A | 0.62mi | 4/2.0 | — | 2mo | $265,000 | — | 57 |
| 1109 W Truman Rd | 0.24mi | 3/2.0 (-1) | — | 20mo | $169,950 | — | 55 |
| 724 S Crysler Ave | 0.47mi | 4/— | — | 17mo | $225,000 | — | 52 |
| 11306-11308 E Winner Rd | 0.66mi | 4/3.0 | — | 8mo | $219,500 | — | 50 |
| 11300 & 11302 E 15th St S | 0.61mi | 4/2.0 | 1,496 | 12mo | $199,950 | $134 | 49 |
| 1617 S Claremont Ave | 0.62mi | 4/4.0 | — | 12mo | $249,000 | — | 48 |
| 316 S Spring St | 0.67mi | 4/13.0 | — | 15mo | $3,950,000 | — | 44 |
| 11402 E 10th St | 0.62mi | 3/2.0 (-1) | — | 14mo | $200,000 | — | 42 |
| 701 N Delaware St | 0.68mi | 5/2.5 (+1) | 2,108 | 19mo | $299,900 | $142 | 35 |
Match score weights: distance 35% · size 25% · config 20% · recency 20%. Top-matched comps best support the ARV.
Projected returns pro-forma
-3.0% appreciation · 3.79% rent growth · sell at horizon
- IRR
- -1.6%
- Equity multiple
- 0.94×
- Total profit
- $-3,501
- Equity at exit
- $29,821
- IRR
- 8.9%
- Equity multiple
- 1.71×
- Total profit
- $39,552
- Equity at exit
- $17,292
Cash invested: $56,000 (down + closing). Projections, not guarantees.
Landlord ↔ Tenant lean methodology
- Overall (STATE)
- 81 Strongly Landlord-Friendly
- State Missouri
- 81 Strongly Landlord-Friendly · R+10
- County
- — inherits STATE
- City
- — inherits STATE
ZIP-level market 64050
- Home prices YoY
- -15.5%
- Rents YoY
- 3.8%
- Active inventory
- 125
- Price-to-rent
- 14.6×
Monthly cashflow live
- Estimated rent
- $2,287 high interval (Pro) →
- Mortgage (P&I)
- −$1,049
- Tax est. 1.5%
- −$250 /mo · $3,000/yr
- Insurance
- −$83
- HOA
- −$0
- Vacancy / Maint / Mgmt
- −$480
- Net cashflow
- $425
Break-even live
2-unit breakdown (identical units grouped — click to expand)
| Units | Beds | Baths | Est. rent |
|---|---|---|---|
| 2× units | 2 | 1.5 | $2,288 |
| #1 | 2 | 1.5 | $1,144 |
| #2 | 2 | 1.5 | $1,144 |
| Total (2 units) | $2,287 | ||
UW: 25.0% down · 7.5% · 30yr · 1.5% tax · 5.0% vac · 8.0% maint · 8.0% mgmt
Financing live
Cash to close
- Down payment
- $50,000
- Closing costs
- $6,000
- Reserves months
- —
- Total cash needed
- —
Loan-product check · same deal, 3 products live
Conventional
25% down · 7.5% · 30yr
- Down + closing
- —
- Monthly P&I
- —
- Monthly cashflow
- —
- DSCR
- —
- Eligible?
- —
Personal DTI + credit; lowest rate.
DSCR
20% down · 8.5% · 30yr
- Down + closing
- —
- Monthly P&I
- —
- Monthly cashflow
- —
- DSCR
- —
- Eligible?
- —
No personal income docs; deal must DSCR.
Hard money
10% down · 12.0% · 12mo
- Down + closing
- —
- Monthly P&I
- —
- Monthly cashflow
- —
- DSCR
- —
- Eligible?
- —
Short-term bridge; refi at stabilization.
Rent comps 24 comps
| Address | Beds | Baths | Sqft | Rent | $/sqft | DOM | Units | Dist |
|---|---|---|---|---|---|---|---|---|
| 118 S Crysler Ave Independence, MO | 3.0 | 2.0 | — | $1,350 | — | 16d | 1 | 0.07mi |
| 118 S Crysler Ave Unit 1/2 Independence, MO | 3.0 | 1.0 | — | $1,100 | — | 43d | 1 | 0.07mi |
| 11709 E Winner Rd Independence, MO | 3.0 | 1.5 | 1300 | $1,195 | $0.92 | 16d | 1 | 0.44mi |
| 523 W Maple Ave Unit 2 A Independence, MO | 3.0 | 2.0 | 964 | $995 | $1.03 | 43d | 1 | 0.53mi |
| 11601 E US Highway 24 Unit A Independence, MO | 3.0 | 1.0 | — | $1,800 | — | 43d | 1 | 0.83mi |
| 2356 S Crysler Ave Independence, MO | 3.0 | 2.0 | 1881 | $1,653 | $0.88 | 23d | 1 | 0.92mi |
| 321 W South Ave Unit 11 Independence, MO | 3.0 | 2.0 | 1000 | $1,275 | $1.27 | 21d | 1 | 0.93mi |
| 2110 S Sterling Ave Independence, MO | 3.0 | 2.0 | 1722 | $1,849 | $1.07 | 16d | 1 | 0.97mi |
| 1425 S Northern Blvd Independence, MO | 3.0 | 1.5 | 1275 | $1,200 | $0.94 | 7d | 1 | 0.98mi |
| 2256 S Sterling Ave Independence, MO | 3.0 | 1.5 | 1284 | $1,399 | $1.09 | 16d | 1 | 1.03mi |
| 10817 E 19th Ter S Independence, MO | 3.0 | 1.0 | 1428 | $1,801 | $1.26 | 16d | 1 | 1.04mi |
| 11323 E Thompson St Sugar Creek, MO | 3.0 | 2.5 | 1794 | $1,800 | $1.00 | 12d | 1 | 1.05mi |
| 1109 S Appleton Ave Independence, MO | 3.0 | 2.0 | 1200 | $1,195 | $1.00 | 16d | 1 | 1.08mi |
| 182 Novak St Sugar Creek, MO | 3.0 | 2.0 | 1350 | $1,800 | $1.33 | 17d | 1 | 1.08mi |
| 1207 N McCoy St Independence, MO | 3.0 | 2.0 | 972 | $1,295 | $1.33 | 7d | 1 | 1.09mi |
| 1223 N Pleasant St Independence, MO | 3.0 | 2.0 | — | $1,395 | — | 43d | 1 | 1.15mi |
| 1502 S Pleasant St Independence, MO | 3.0 | 2.0 | 1200 | $1,399 | $1.17 | 43d | 1 | 1.24mi |
| 11500 E Anderson St Independence, MO | 3.0 | 2.0 | 1200 | $1,599 | $1.33 | 17d | 1 | 1.24mi |
| 1404 S Osage St Independence, MO | 4.0 | 2.0 | 1300 | $1,750 | $1.35 | 14d | 1 | 1.25mi |
| 1416 S Hardy Ave Independence, MO | 5.0 | 2.0 | 1328 | $1,625 | $1.22 | 43d | 1 | 1.26mi |
| 630 N Hocker Ave Independence, MO | 3.0 | 1.0 | 864 | $1,325 | $1.53 | 23d | 1 | 1.30mi |
| 10323 E 20th St S Independence, MO | 3.0 | 1.0 | 936 | $1,400 | $1.50 | 43d | 1 | 1.38mi |
| 830 S Hardy Ave Independence, MO | 3.0 | 1.0 | — | $1,345 | — | 43d | 1 | 1.38mi |
| 628 E Lexington Ave Independence, MO | 4.0 | 1.5 | — | $1,675 | — | 7d | 1 | 1.46mi |
Listing history 2 events
-
2026-06-08remarks 11-char remark
-
2026-06-08$200,000 Coming Soon 1 DOM
ⓘ Source: listings_history table (triggers on properties + properties_extension) + one-shot
backfill from property_details.listing_events for pre-trigger history.
Climate risk First Street
- Flood 4/10 Moderate FEMA zone X (unshaded) · 22% chance over 30 yrs
- Wildfire 1/10 Low
- Heat 4/10 Moderate 7 d/yr ≥106°F today · 17 d/yr by 30 yrs out
- Wind 2/10 Low
- Air quality 3/10 Moderate 3 unhealthy d/yr today · 3 by 30 yrs out
Nearby sold comps map
Loading sold comps map…
Walkable amenities ~0.75 mi
Loading nearby amenities…
Taxation est. · year 1
- Rental income
- $27,444
- − Mortgage interest
- −$11,203
- − Property taxes
- −$3,000
- − Insurance
- −$1,000
- − Repairs & maintenance
- −$2,196
- − Management
- −$2,196
- − Depreciation
- −$5,818
- Taxable income
- $2,032
- Est. tax owed @ 24.0%
- −$488
- After-tax cash flow
- $4,607/yr
For passive investors: Depreciation is non-cash, so a rental often shows a tax loss while cash-flowing — sheltering income. Rental losses are passive: they offset passive income freely, and up to $25,000/yr can offset ordinary (W-2) income if you actively participate and your MAGI is under $100k (phasing out to $0 by $150k); unused losses carry forward. On sale, claimed depreciation is recaptured at up to 25%, and gains may owe capital-gains tax (a 1031 exchange can defer both). Figures are a year-1 estimate at your 24.0% rate — not tax advice; consult a CPA.
Condition & rehab AI · 1 photo
The property requires moderate repairs and maintenance to improve its curb appeal and value. Repainting the exterior and repairing the siding would be the highest-ROI updates.
Repairs flagged
- Major siding — Signs of wear and tear
- Minor landscaping — Some overgrown areas
Value-add opportunities
- Both paint exterior walls — Enhances curb appeal and value
- Both repair and paint siding — Improves appearance and value
- Both landscaping — Enhances curb appeal and value
Renovation cost estimate screening
| Repair item | Severity | Est. cost |
|---|---|---|
| siding · Signs of wear and tear | Major | $15,000–50,000 |
| landscaping · Some overgrown areas | Minor | $500–3,000 |
| Total estimated repair cost · 2 items | $15,500–53,000 |
Value-add ROI direction
- Both paint exterior walls — Enhances curb appeal and value ↑
- Both repair and paint siding — Improves appearance and value ↑
- Both landscaping — Enhances curb appeal and value ↑
ⓘ Cost ranges are severity-bucket heuristics (US national rule-of-thumb). Get contractor quotes + a written scope before underwriting a rehab budget.
Schools (NCES district)
- District
- Independence 30
- NCES district ID
- 2915480
- Math proficiency
- 26% ▼ -8.00%
- Reading proficiency
- 38% ▼ -5.00%
- Median HH income
- $41,843
- Composite
- 27.04/100
- National rank
- #7054
- State rank
- #252 of 324 in MO
Livability — Independence
- Score
- 82/100
- State rank
- #10
- US rank
- #1296
Category grades
Schools grade is shown separately in the Schools card above.
Census & demographics
- Census place
- Independence, MO
- County
- Jackson County · 687,798 people
- City population
- 117,675
- Metro
- Kansas City, MO-KS
- Population (ZIP)
- 21,079
- Household income
- $48,834
- Rent vs Own
- Severe rent burden
- 972.0
Population outlook (Jackson County) Hauer SSP2
- Today (2025)
- 719,589 people
- By 2030
- 731,456 · +1.6%
- By 2040
- 746,689 · +3.8%
- By 2050
- 749,289 · +4.1%
- By 2075
- 736,227 · +2.3%
- By 2100
- 668,210 · -7.1%
Race, ethnicity, and origin ACS 2023
- Neighborhood character
- Predominantly White (72%)
- Race & ethnicity
- White 72% Hispanic / Latino 11% Two or more races 9% Black 7% Pacific Islander 1%
- Hispanic origin (detail)
- Mexican 8%
- Common ancestry
- Italian 4% Serbian 2% Lithuanian 1%
- Foreign-born
- 5% · Canada
- Languages at home
- 91% English-only · Spanish 7% Other Asian/Pacific 1%
Political lean MEDSL · Jackson
- 2024 margin
- D (+19.3) · D 58.9% · R 39.5% · Other 1.6%
- 2008→2024 swing
- -6.1pp toward R · 2008: 25.4pp · 2024: 19.3pp
- All cycles
- 2024: D+19.3 2020: D+22.0 2016: D+16.6 2012: D+19.0 2008: D+25.4
Not yet ingested
- Civics
- —
Market trends
- HPI YoY
- ▼ -56.24%
- Current HPI
- 305.796
- Rent YoY
- ▲ 3.79%
- Metro
- Kansas City, MO-KS
- State GDP YoY
- ▲ 1.84%
- F500 in state
- 20
Industry mix (Fortune 500 HQ in MO)
| Industry | F500 HQs | Revenue |
|---|---|---|
| Healthcare | 1 | $163B |
|
||
| Insurance | 1 | $21B |
|
||
| Industrial Technology | 1 | $17B |
|
||
| Retail | 1 | $16B |
|
||
| Industrial Distribution | 1 | $10B |
|
||
| Utilities | 1 | $9B |
|
||
Price history
1 event — show timeline
- 2026-06-08 Coming Soon $200,000 Heartland MLS as Distributed by MLS Grid
Cash-flow waterfall
monthlySold comps — $/sqft
last 12 mo · ≤1 miLoading sold comps…