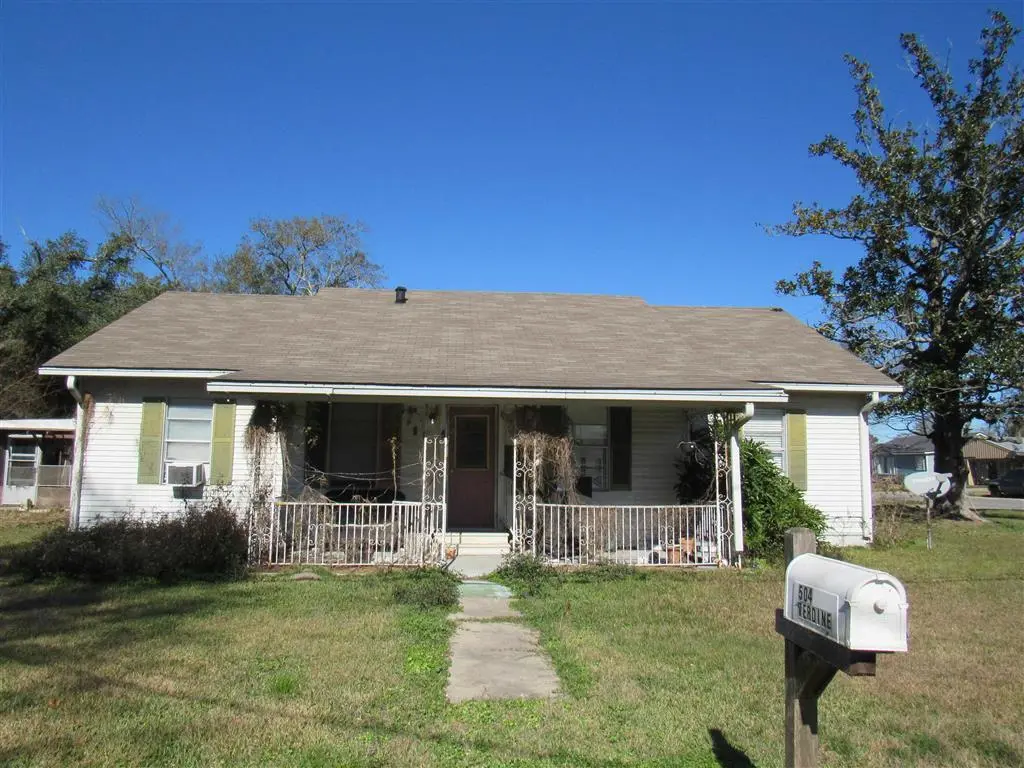
504 W Verdine St W · Sulphur, LA
Flood risk 4/10 · Minor
- FEMA flood zone
- X (unshaded)
- Chance of flooding over 30 yrs
- 0.22%
- Est. flood insurance / yr
- $507 – $1,088
Fire risk 4/10 · Minor
- Est. fire insurance / yr
- $1,269 – $2,357
Heat risk 9/10 · Severe
- Hot days now (above 109°F)
- 7 days/yr
- Hot days in 30 yrs
- 23 days/yr
Wind risk 9/10 · Severe
- Chance of severe wind over 30 yrs
- 99.0%
Air-quality risk 2/10 · Minimal
- Unhealthy air days now
- 1 days/yr
- Unhealthy air days in 30 yrs
- 1 days/yr
Risk factors via First Street. Map © Google.
Why this score? — see what drove the B+ grade
The composite is a weighted blend of 9 inputs, each scored 0–100. Each bar is that input's sub-score; the figure is the points it added to the 100-point composite (weight × sub-score).
- Cash flow +30.0/30.0
- ARV discount +15.0/15.0
- DSCR +10.0/10.0
- 1% rule +9.7/10.0
- Rent growth +4.4/5.0
- Livability +3.6/5.0
- Schools +3.1/10.0
- Condition / age +2.5/5.0
- Appreciation +0.0/10.0
$110,000
🖨 Deal sheet (PDF) 📄 Offer letter ✓ Due diligence
Listing remarks MLS
Looking for your next investment or project? With a little TLC, this would be it! Perfect to flip or to become your next rental unit! Large, 3bd/2ba located on a corner lot in the heart of Sulphur. Minutes from all amenities and the I10 corridor leading to local industries. Large kitchen with plenty of cabinet space. Interior Laundry with den or flex space.
Key facts
- Interior laundry
- Large kitchen
- Corner lot
Tags
Neighborhood map
What this means for you Summary
Snapshot
- This is a 3-bed/2.0-bath single-family listed at $110k.
Deal economics
- At list price, monthly cash flow is $613 ($7k/yr) — positive.
- The deal already cash-flows at list — no discount required.
- Meets the 1% rule at list price ($2k rent vs $110k).
- Recommended offer: $100k (9.0% below list) — sets the bar for market timing.
- Cap rate 13.0% vs local median 8.8% in Sulphur — top-decile yield for the area; either an underpriced asset or a hidden risk that comps aren't pricing in. Stress-test before assuming the spread holds.
Location & tenants
- Location reads 71/100 on livability (#48 in LA) — a middle-class / working-renter tenant base. Strengths: cost of living A+, housing A+, health & safety A; Watch: crime D-, amenities F, commute F.
- Calcasieu Parish (other): math 30% / reading 44% proficiency, ranked #29 of 98 in LA (top 30%) — families likely to look elsewhere, expect single-tenant / working-renter base with shorter leases.
- Zoned schools: Cypress Cove Elementary School (math 42% / reading 60%, grade C-, #120 of 646 statewide, top 19%, 512 students, 61% FRL); Leblanc Middle School (math 23% / reading 45%, grade F, #95 of 218 statewide, top 45%, 399 students, 62% FRL); Sulphur High School (math 36% / reading 53%, grade F, #58 of 265 statewide, top 23%, 2,043 students, 47% FRL) — zoned schools at 56% FRL track the district average.
- Market conditions: Rents rising fast (+7.7%/yr); 294 active listings in the ZIP; 1 comparable units currently listed for rent nearby; 1,298 units permitted in Calcasieu Parish in 2024 (526 in 5+ unit buildings).
Forward outlook
- Local home prices are declining (-3.0%/yr); year-one equity from $761 of loan paydown is wiped out by about $3k of value loss. Plan a longer hold.
- Calcasieu County population projected at +11% by 2050 — modest demand growth; plan on rents tracking national, not racing it.
- At projected returns (-3.0% appreciation + 7.7% rent growth), your $31k cash investment doubles in ~5 years — after that, you're playing with house money.
Negotiation context
- It's been on market 94 days — a 9% lower offer ($100k) is reasonable based on typical stale-listing flexibility.
- 3 sale attempts since 11y ago with the ask held roughly flat each time — persistent listings suggest the price (not the market) is what's stuck; bring a comps-based counter.
Risks & watch-outs
- Climate carrying-cost: severe wind risk, 99% chance of damaging wind over 30y; extreme-heat days projected 7→23/yr by 2055 (HVAC capex compounding) — expect insurance premiums to compound above CPI over the hold.
Questions for the listing agent
- It's been on market 94 days. Have you received any prior offers? Is the seller open to a 9% concession, seller financing, or rate buy-down credit?
- Built in 1965 — when were the roof, HVAC, electrical panel, plumbing, and water heater last replaced?
- Why hasn't it sold? Are there any deal-killer items the seller is aware of (foundation, flood, title, zoning, code violations)?
- Is there a deadline driving the sale (1031 exchange, divorce, estate, relocation)? That informs how much negotiation room exists.
- Schools are A-rated — typically a magnet for longer-tenancy family renters. What's the average tenant stay here, and is there a school-zone premium baked into asking?
- Crime grade is D in this area — have there been break-ins, vandalism, or insurance claims at this property in the last 3 years? What carrier currently insures it and at what premium?
- What's the average days-on-market for RENTAL listings here right now (not sales)? A rising rental-DOM trend means longer vacancies and softer asking-rent achievability than the comps imply.
- What's the recent tenant-quality profile in this submarket — average credit score on applications, eviction rate, late-payment / NSF rate, and stable-employment percentage? A property-management company in the area should have these aggregated.
- How much new for-sale + rental construction is in the pipeline within 1–3 miles? Heavy new supply typically softens prices + rents 12–24 months out; constrained supply supports both.
Investment metrics
- 1% rule
- 1.47% ✓
- Cap rate
- 12.98%
- Cash-on-cash
- 23.88%
- DSCR
- 2.06
- GRM
- 5.7
CMA / ARV
- ARV (median comp)
- $136,834
- List price
- $110,000
- Delta
- -19.61%
- Verdict
- UNDERPRICED
- Comps
- 20 within 1.0 mi
Show comp detail 12 sales within ~0.75 mi
| Address | Dist | Beds/Ba | Sqft | Sold | Price | $/sf | Match |
|---|---|---|---|---|---|---|---|
| 515 W Elizabeth St W | 0.26mi | 3/2.0 | 1,560 (-11%) | 7mo | $152,500 | $98 | 64 |
| 409 W Lyons St W | 0.13mi | 3/2.0 | 1,940 (+11%) | 16mo | $72,000 | $37 | 62 |
| 226 Bryan St | 0.43mi | 3/1.0 | 1,918 (+10%) | 2mo | $138,500 | $72 | 58 |
| 616 Cody St | 0.56mi | 3/2.0 | 1,811 (+4%) | 12mo | $178,000 | $98 | 58 |
| 1031 W Verdine St W | 0.47mi | 4/3.0 (+1) | 1,773 (+1%) | 12mo | $155,000 | $87 | 57 |
| 519 Hickok St | 0.63mi | 4/2.0 (+1) | 1,809 (+3%) | 8mo | $220,000 | $122 | 54 |
| 313 W Logan St W | 0.51mi | 3/2.0 | 1,926 (+10%) | 10mo | $175,000 | $91 | 51 |
| 855 E Lyons St | 0.69mi | 3/2.0 | 1,518 (-13%) | 3mo | $115,000 | $76 | 43 |
| 608 Cody St | 0.55mi | 3/2.0 | 1,958 (+12%) | 15mo | $170,000 | $87 | 42 |
| 700 Custer St | 0.68mi | 3/2.0 | 1,637 (-6%) | 19mo | $138,000 | $84 | 42 |
| 821 N Claiborne St N | 0.70mi | 3/2.0 | 1,540 (-12%) | 11mo | $140,000 | $91 | 38 |
| 735 Urban St | 0.63mi | 4/1.5 (+1) | 1,998 (+14%) | 4mo | $184,000 | $92 | 37 |
Match score weights: distance 35% · size 25% · config 20% · recency 20%. Top-matched comps best support the ARV.
Projected returns pro-forma
-3.0% appreciation · 7.65% rent growth · sell at horizon
- IRR
- 21.9%
- Equity multiple
- 1.94×
- Total profit
- $29,087
- Equity at exit
- $16,401
- IRR
- 32.7%
- Equity multiple
- 4.61×
- Total profit
- $111,190
- Equity at exit
- $9,511
Cash invested: $30,800 (down + closing). Projections, not guarantees.
Landlord ↔ Tenant lean methodology
- Overall (STATE)
- 90 Strongly Landlord-Friendly
- State Louisiana
- 90 Strongly Landlord-Friendly · R+12
- County
- — inherits STATE
- City
- — inherits STATE
ZIP-level market 70663
- Rents YoY
- 7.7%
- Active inventory
- 294
- Price-to-rent
- 5.7×
Monthly cashflow live
- Estimated rent
- $1,615 medium interval (Pro) →
- Mortgage (P&I)
- −$577
- Tax from tax record
- −$40 /mo · $485/yr
- Insurance
- −$46
- HOA
- −$0
- Vacancy / Maint / Mgmt
- −$339
- Net cashflow
- $613
Break-even live
Sensitivity live
| Price | -10% $675 | -5% $644 | +0% $613 | +5% $582 | +10% $551 |
|---|---|---|---|---|---|
| Rent | -10% $485 | -5% $549 | +0% $613 | +5% $677 | +10% $740 |
| Rate | -1.0pp $668 | -0.5pp $641 | base $613 | +0.5pp $584 | +1.0pp $555 |
UW: 25.0% down · 7.5% · 30yr · 1.5% tax · 5.0% vac · 8.0% maint · 8.0% mgmt
Financing live
Cash to close
- Down payment
- $27,500
- Closing costs
- $3,300
- Reserves months
- —
- Total cash needed
- —
Loan-product check · same deal, 3 products live
Conventional
25% down · 7.5% · 30yr
- Down + closing
- —
- Monthly P&I
- —
- Monthly cashflow
- —
- DSCR
- —
- Eligible?
- —
Personal DTI + credit; lowest rate.
DSCR
20% down · 8.5% · 30yr
- Down + closing
- —
- Monthly P&I
- —
- Monthly cashflow
- —
- DSCR
- —
- Eligible?
- —
No personal income docs; deal must DSCR.
Hard money
10% down · 12.0% · 12mo
- Down + closing
- —
- Monthly P&I
- —
- Monthly cashflow
- —
- DSCR
- —
- Eligible?
- —
Short-term bridge; refi at stabilization.
Rent comps 1 comps
| Address | Beds | Baths | Sqft | Rent | $/sqft | DOM | Units | Dist |
|---|---|---|---|---|---|---|---|---|
| 1408 Christie Dr Sulphur, LA | 3.0 | 2.0 | 1794 | $4,250 | $2.37 | 45d | 1 | 1.12mi |
Listing history 23 events
-
2026-06-18days on market $110,000 Active 94 DOM
-
2026-06-17days on market $110,000 Active 93 DOM
-
2026-06-16days on market $110,000 Active 92 DOM
-
2026-06-15days on market $110,000 Active 91 DOM
-
2026-06-14days on market $110,000 Active 89 DOM
-
2026-06-13days on market $110,000 Active 88 DOM
-
2026-06-10days on market $110,000 Active 86 DOM
-
2026-06-09days on market $110,000 Active 85 DOM
-
2026-06-08days on market $110,000 Active 84 DOM
-
2026-06-07days on market $110,000 Active 83 DOM
-
2026-06-05days on market $110,000 Active 80 DOM
-
2026-06-02days on market $110,000 Active 78 DOM
-
2026-06-01days on market $110,000 Active 77 DOM
-
2026-05-31days on market $110,000 Active 76 DOM
-
2026-05-30days on market $110,000 Active 75 DOM
-
2026-03-16$110,000 Active 361-char remark
Show marketing remark (361 chars)
Looking for your next investment or project? With a little TLC, this would be it! Perfect to flip or to become your next rental unit! Large, 3bd/2ba located on a corner lot in the heart of Sulphur. Minutes from all amenities and the I10 corridor leading to local industries. Large kitchen with plenty of cabinet space. Interior Laundry with den or flex space.
-
2021-10-11soldstatus $115,500
-
2021-10-08soldstatus 256-char remark
Show marketing remark (256 chars)
Built with galvanized aluminum siding, this home is move in ready, 3/2 corner lot. This home also has generous spaces and has been a successful rental in the past; appliances are included, some of the beautiful wood floors remain; flood insurance optional.
-
2021-09-01$112,500 256-char remark
Show marketing remark (256 chars)
Built with galvanized aluminum siding, this home is move in ready, 3/2 corner lot. This home also has generous spaces and has been a successful rental in the past; appliances are included, some of the beautiful wood floors remain; flood insurance optional.
-
2017-05-24soldstatus
-
2017-05-24soldstatus $74,000
-
2015-12-04$89,995
-
2014-07-02soldstatus $46,000
ⓘ Source: listings_history table (triggers on properties + properties_extension) + one-shot
backfill from property_details.listing_events for pre-trigger history.
Tax reassessment forecast LA · Resets to sale price
- Current annual tax
- $485 · $40/mo
- Projected year-2 tax
- $605 · $50/mo
- Expected delta
- +$120/yr (+$10/mo · 24.9%)
ⓘ Screening estimate from a state-policy table — verify with the county assessor before closing.
Climate risk First Street
- Flood 4/10 Moderate FEMA zone X (unshaded) · 22% chance over 30 yrs
- Wildfire 4/10 Moderate
- Heat 9/10 Extreme 7 d/yr ≥109°F today · 23 d/yr by 30 yrs out
- Wind 9/10 Extreme 99% chance of damaging wind over 30 yrs
- Air quality 2/10 Low 1 unhealthy d/yr today · 1 by 30 yrs out
Nearby sold comps map
Loading sold comps map…
Walkable amenities ~0.75 mi
Loading nearby amenities…
Taxation est. · year 1
- Rental income
- $19,382
- − Mortgage interest
- −$6,162
- − Property taxes
- −$485
- − Insurance
- −$550
- − Repairs & maintenance
- −$1,551
- − Management
- −$1,551
- − Depreciation
- −$3,200
- Taxable income
- $5,884
- Est. tax owed @ 24.0%
- −$1,412
- After-tax cash flow
- $5,943/yr
For passive investors: Depreciation is non-cash, so a rental often shows a tax loss while cash-flowing — sheltering income. Rental losses are passive: they offset passive income freely, and up to $25,000/yr can offset ordinary (W-2) income if you actively participate and your MAGI is under $100k (phasing out to $0 by $150k); unused losses carry forward. On sale, claimed depreciation is recaptured at up to 25%, and gains may owe capital-gains tax (a 1031 exchange can defer both). Figures are a year-1 estimate at your 24.0% rate — not tax advice; consult a CPA.
Schools (NCES district)
- District
- Calcasieu Parish
- NCES district ID
- 2200330
- Math proficiency
- 30% ▼ -39.00%
- Reading proficiency
- 44% ▼ -33.00%
- Median HH income
- $44,700
- Composite
- 31.45/100
- National rank
- #5979
- State rank
- #29 of 98 in LA
Livability — Sulphur
- Score
- 71/100
- State rank
- #48
- US rank
- #7164
Category grades
Schools grade is shown separately in the Schools card above.
Census & demographics
- Census place
- Sulphur, LA
- County
- Calcasieu Parish · 170,889 people
- City population
- 27,799
- Metro
- Lake Charles, LA
- Population (ZIP)
- 27,799
- Household income
- $64,707
- Rent vs Own
- Severe rent burden
- 197.0
Population outlook (Calcasieu County) Hauer SSP2
- Today (2025)
- 212,179 people
- By 2030
- 218,199 · +2.8%
- By 2040
- 228,486 · +7.7%
- By 2050
- 236,208 · +11.3%
- By 2075
- 251,696 · +18.6%
- By 2100
- 247,848 · +16.8%
Race, ethnicity, and origin ACS 2023
- Neighborhood character
- Predominantly White (82%)
- Race & ethnicity
- White 82% Black 8% Hispanic / Latino 5% Two or more races 4%
- Common ancestry
- Lithuanian 13% Slovak 2% Scandinavian 1%
- Foreign-born
- 3% · Canada, Vietnam
- Languages at home
- 94% English-only · Spanish 2% French/Haitian/Cajun 2% Other Indo-European 1%
Political lean MEDSL · Calcasieu
- 2024 margin
- Solid R (+39.6) · D 29.5% · R 69.0% · Other 1.5%
- 2008→2024 swing
- -15.0pp toward R · 2008: -24.6pp · 2024: -39.6pp
- All cycles
- 2024: R+39.6 2020: R+35.2 2016: R+33.3 2012: R+28.7 2008: R+24.6
Not yet ingested
- Civics
- —
Market trends
- HPI YoY
- ▼ -104.29%
- Current HPI
- 100.0895
- Rent YoY
- ▲ 7.65%
- Metro
- Lake Charles, LA
- State GDP YoY
- ▲ 3.29%
- F500 in state
- 10
Industry mix (Fortune 500 HQ in LA)
| Industry | F500 HQs | Revenue |
|---|---|---|
| Telecommunications | 2 | $23B |
|
||
| Utilities | 1 | $12B |
|
||
| Wholesale / Distribution | 1 | $5B |
|
||
| Advertising | 1 | $2B |
|
||
Price history
+139.1% since first listed8 events — show timeline
- 2026-03-16 Listed $110,000 SWLAR
- 2021-10-11 Sold (Public Records) $115,500 Public Records
- 2021-10-08 Sold (MLS) — SWLAR
- 2021-09-01 Listed $112,500 SWLAR
- 2017-05-24 Sold (Public Records) $74,000 Public Records
- 2017-05-24 Sold (MLS) — SWLAR
- 2015-12-04 Listed $89,995 SWLAR
- 2014-07-02 Sold (Public Records) $46,000 Public Records
Property tax history
+4.4%/yrLatest (2025): $485 · +0.8% YoY. Source: county tax records.
Cash-flow waterfall
monthlySold comps — $/sqft
last 12 mo · ≤1 miLoading sold comps…