 Duplex
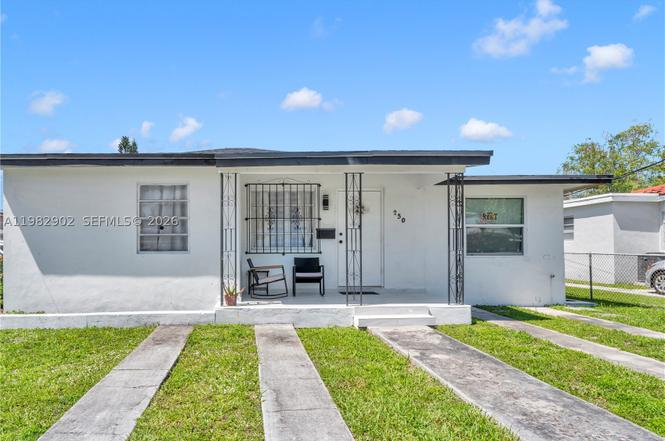
250 NW 34th Ave · Miami, FL
Flood risk 1/10 · Minimal
- FEMA flood zone
- X (unshaded)
- Chance of flooding over 30 yrs
- 0.0%
- Est. flood insurance / yr
- $507 – $1,088
Fire risk 1/10 · Minimal
- Est. fire insurance / yr
- $947 – $1,759
Heat risk 10/10 · Severe
- Hot days now (above 104°F)
- 7 days/yr
- Hot days in 30 yrs
- 28 days/yr
Wind risk 10/10 · Severe
- Chance of severe wind over 30 yrs
- 99.0%
Air-quality risk 2/10 · Minimal
- Unhealthy air days now
- 1 days/yr
- Unhealthy air days in 30 yrs
- 1 days/yr
Risk factors via First Street. Map © Google.
Why this score? — see what drove the F grade
The composite is a weighted blend of 9 inputs, each scored 0–100. Each bar is that input's sub-score; the figure is the points it added to the 100-point composite (weight × sub-score).
- Cash flow +9.5/30.0
- ARV discount +7.5/15.0
- Schools +4.2/10.0
- Livability +3.9/5.0
- DSCR +2.7/10.0
- 1% rule +2.6/10.0
- Condition / age +2.5/5.0
- Rent growth +2.2/5.0
- Appreciation +0.0/10.0
$874,990
🖨 Deal sheet (PDF) 📄 Offer letter ✓ Due diligence
Multi-family units
County records classify this as Multi-Family (2-4 Unit). Listing-text estimate: 2 units. confirmed
Listing remarks MLS
Handyman special. Great location for this duplex with 2 separate structures (both very spacious) with lots of potential. First structure is a 3/2 which can also be used as a 2/1 and a 0/1. Second structure is a 2/1. Wont't last!!!
Key facts
- Renovated
- Private entrance
- 6 parking spots
Tags
Property features AI
Finance
- Financial info: Multifamily property with seven units total (3 efficiency units and 4 two-bedroom units); Actual rents reported: Efficiency units $1,000; 2-bedroom units $2,000; Units are month-to-month
Exterior
- Parking: Six parking spaces total; Open parking for units
- Utilities: Public water; Public sewer; Cable available
- Home design: Single-story building
- Construction: Block construction; Shingle roof; Year built: Unknown
- Exterior features: Open parking; Less than quarter acre lot
Interior
- Bedrooms: Three efficiency units (each described as 1-bedroom equivalent); Two 2-bedroom units
- Flooring: Tile
- Bathrooms: Each unit has one full bathroom
- Heating & cooling: Electric heating; Electric cooling
- Interior features: Tile flooring
Neighborhood map
What this means for you Summary
Snapshot
- This is a 1×2bd/1.0ba + 1×1bd/1.0ba units multifamily listed at $875k.
Deal economics
- At list price, monthly cash flow is $-612 ($-7k/yr) — negative. Per door: $-306/mo.
- To cash-flow at today's rent, offer at most $767k (12.4% below list).
- To meet the 1% rule (rent ≥ 1% of price), the offer needs to be $662k (24.3% below list).
- Recommended offer: $662k (24.3% below list) — sets the bar for 1% rule.
- Cap rate 5.5% vs local median 1.9% in Miami — top-decile yield for the area; either an underpriced asset or a hidden risk that comps aren't pricing in. Stress-test before assuming the spread holds.
Location & tenants
- Location reads 78/100 on livability (#177 in FL, #2,724 nationally) — a middle-class / working-renter tenant base. Strengths: amenities A+, commute A+, health & safety A+; Watch: employment C-, crime F, cost of living F.
- Miami-Dade (suburban): math 45% / reading 54% proficiency, ranked #40 of 73 in FL (top 55%) — families likely to look elsewhere, expect single-tenant / working-renter base with shorter leases; 64% free/reduced lunch — lower-income household profile, screen leases tightly.
- Zoned schools: Kensington Park Elementary School (math 38% / reading 39%, grade F, #1,575 of 2,144 statewide, top 74%, 922 students, 66% FRL); Citrus Grove Middle School (math 19% / reading 21%, grade F, #558 of 571 statewide, top 98%, 781 students, 66% FRL); Miami Senior High School (math 21% / reading 41%, grade F, #429 of 667 statewide, top 65%, 2,905 students, 69% FRL) — zoned schools at 67% FRL track the district average.
- Zoned-school proficiency averages 30% at this address vs 50% district-wide (-20 pts) — the specific schools serving this property underperform the Miami-Dade average; the district grade overstates school quality for this exact location.
- Market conditions: Rents soft (-1.4%/yr); 241 active listings in the ZIP; lower-income renter base — watch delinquency; 10,051 units permitted in Miami-Dade County in 2024 (7,758 in 5+ unit buildings).
Forward outlook
- Local home prices are declining (-3.0%/yr); year-one equity from $6k of loan paydown is wiped out by about $26k of value loss. Plan a longer hold.
- Miami-Dade County population projected at +28% by 2050 — long-run rental-demand tailwind backs the buy-and-hold thesis.
Negotiation context
- It's been on market 99 days — a 9% lower offer ($796k) is reasonable based on typical stale-listing flexibility.
- 4 sale attempts since 4y ago with the ask held roughly flat each time — persistent listings suggest the price (not the market) is what's stuck; bring a comps-based counter.
- Current owner paid $755k; 16% above their basis — modest negotiation headroom, anchor on the comps not their cost.
Risks & watch-outs
- Watch-outs: built in 1947 — expect roof / HVAC / electrical / plumbing capex.
- Climate carrying-cost: severe wind risk, 99% chance of damaging wind over 30y; extreme-heat days projected 7→28/yr by 2055 (HVAC capex compounding) — expect insurance premiums to compound above CPI over the hold.
Questions for the listing agent
- What do current leases actually rent for vs. the listed asking? Can we see a recent rent roll and the last 12 months of T-12 income?
- It's been on market 99 days. Have you received any prior offers? Is the seller open to a 24% concession, seller financing, or rate buy-down credit?
- Can we see the unit-by-unit rent roll, current vacancy, and any below-market leases? What's the average tenancy length?
- What capital expenditures (roof, boiler, parking lot, exteriors) have been made in the last 5 years, and what's planned in the next 2?
- Built in 1947 — when were the roof, HVAC, electrical panel, plumbing, and water heater last replaced?
- Why hasn't it sold? Are there any deal-killer items the seller is aware of (foundation, flood, title, zoning, code violations)?
- Is there a deadline driving the sale (1031 exchange, divorce, estate, relocation)? That informs how much negotiation room exists.
- Schools are B-rated — typically a magnet for longer-tenancy family renters. What's the average tenant stay here, and is there a school-zone premium baked into asking?
- Crime grade is F in this area — have there been break-ins, vandalism, or insurance claims at this property in the last 3 years? What carrier currently insures it and at what premium?
- The area grade is low — what's the realistic commute time and amenity access for the typical tenant pool here? Any planned neighborhood developments (good or bad) we should know about?
- What's the average days-on-market for RENTAL listings here right now (not sales)? A rising rental-DOM trend means longer vacancies and softer asking-rent achievability than the comps imply.
- What's the recent tenant-quality profile in this submarket — average credit score on applications, eviction rate, late-payment / NSF rate, and stable-employment percentage? A property-management company in the area should have these aggregated.
- How much new apartment / multifamily construction is in the pipeline within 1–3 miles? Heavy new supply (>2% of stock underway) typically softens rents 12–24 months out; light construction supports rent growth.
Investment metrics
- 1% rule
- 0.76% ✗
- Cap rate
- 5.45%
- Cash-on-cash
- -3.00%
- DSCR
- 0.87
- GRM
- 11.0
CMA / ARV
No comps found within radius.
Projected returns pro-forma
-3.0% appreciation · 0.0% rent growth · sell at horizon
- IRR
- -24.6%
- Equity multiple
- 0.18×
- Total profit
- $-200,208
- Equity at exit
- $130,464
- IRR
- -31.7%
- Equity multiple
- -0.22×
- Total profit
- $-299,650
- Equity at exit
- $75,653
Cash invested: $244,997 (down + closing). Projections, not guarantees.
Landlord ↔ Tenant lean methodology
- Overall (STATE)
- 87 Strongly Landlord-Friendly
- State Florida
- 87 Strongly Landlord-Friendly · R+3
- County
- — inherits STATE
- City
- — inherits STATE
ZIP-level market 33125
- Rents YoY
- -1.4%
- Active inventory
- 241
- Price-to-rent
- 20.0×
Monthly cashflow live
- Estimated rent
- $6,623 medium interval (Pro) →
- Mortgage (P&I)
- −$4,589
- Tax from tax record
- −$891 /mo · $10,694/yr
- Insurance
- −$365
- HOA
- −$0
- Vacancy / Maint / Mgmt
- −$1,391
- Net cashflow
- $-612
Break-even live
Sensitivity live
| Price | -10% $-117 | -5% $-364 | +0% $-612 | +5% $-860 | +10% $-1,107 |
|---|---|---|---|---|---|
| Rent | -10% $-1,135 | -5% $-874 | +0% $-612 | +5% $-351 | +10% $-89 |
| Rate | -1.0pp $-171 | -0.5pp $-390 | base $-612 | +0.5pp $-839 | +1.0pp $-1,070 |
2-unit breakdown (identical units grouped — click to expand)
| Units | Beds | Baths | Est. rent |
|---|---|---|---|
| 1× unit | 2 | 1 | $3,645 |
| 1× unit | 1 | 1 | $2,978 |
| Total (2 units) | $6,623 | ||
UW: 25.0% down · 7.5% · 30yr · 1.5% tax · 5.0% vac · 8.0% maint · 8.0% mgmt
Financing live
Cash to close
- Down payment
- $218,748
- Closing costs
- $26,250
- Reserves months
- —
- Total cash needed
- —
Loan-product check · same deal, 3 products live
Conventional
25% down · 7.5% · 30yr
- Down + closing
- —
- Monthly P&I
- —
- Monthly cashflow
- —
- DSCR
- —
- Eligible?
- —
Personal DTI + credit; lowest rate.
DSCR
20% down · 8.5% · 30yr
- Down + closing
- —
- Monthly P&I
- —
- Monthly cashflow
- —
- DSCR
- —
- Eligible?
- —
No personal income docs; deal must DSCR.
Hard money
10% down · 12.0% · 12mo
- Down + closing
- —
- Monthly P&I
- —
- Monthly cashflow
- —
- DSCR
- —
- Eligible?
- —
Short-term bridge; refi at stabilization.
Listing history 30 events
-
2026-06-21days on market $874,990 Active 99 DOM
-
2026-06-18days on market $874,990 Active 96 DOM
-
2026-06-17days on market $874,990 Active 95 DOM
-
2026-06-16days on market $874,990 Active 94 DOM
-
2026-06-15days on market $874,990 Active 93 DOM
-
2026-06-13days on market $874,990 Active 91 DOM
-
2026-06-09days on market $874,990 Active 87 DOM
-
2026-06-08days on market $874,990 Active 86 DOM
-
2026-06-07days on market $874,990 Active 85 DOM
-
2026-06-04days on market $874,990 Active 82 DOM
-
2026-06-03days on market $874,990 Active 81 DOM
-
2026-06-02days on market $874,990 Active 80 DOM
-
2026-06-01days on market $874,990 Active 79 DOM
-
2026-05-31days on market $874,990 Active 78 DOM
-
2026-04-21price $874,990
-
2026-04-09price $889,900
-
2026-03-14$900,000 Active
-
2025-01-31soldstatus $755,000
-
2024-10-21soldstatus $565,000
-
2024-10-11soldstatus $565,000 Closed 230-char remark
Show marketing remark (230 chars)
Handyman special. Great location for this duplex with 2 separate structures (both very spacious) with lots of potential. First structure is a 3/2 which can also be used as a 2/1 and a 0/1. Second structure is a 2/1. Wont't last!!!
-
2024-10-01status Pending 230-char remark
Show marketing remark (230 chars)
Handyman special. Great location for this duplex with 2 separate structures (both very spacious) with lots of potential. First structure is a 3/2 which can also be used as a 2/1 and a 0/1. Second structure is a 2/1. Wont't last!!!
-
2024-09-27$589,999 Active 230-char remark
Show marketing remark (230 chars)
Handyman special. Great location for this duplex with 2 separate structures (both very spacious) with lots of potential. First structure is a 3/2 which can also be used as a 2/1 and a 0/1. Second structure is a 2/1. Wont't last!!!
-
2024-09-27historical
Show marketing remark (230 chars)
Handyman special. Great location for this duplex with 2 separate structures (both very spacious) with lots of potential. First structure is a 3/2 which can also be used as a 2/1 and a 0/1. Second structure is a 2/1. Wont't last!!!
-
2024-09-23price $589,999
-
2024-09-13$599,995 Active
-
2024-07-26soldstatus $473,000
-
2022-06-30historical
-
2022-06-17price $580,000
-
2022-05-06price $600,000
-
2022-04-24$639,000 Active
ⓘ Source: listings_history table (triggers on properties + properties_extension) + one-shot
backfill from property_details.listing_events for pre-trigger history.
Tax reassessment forecast FL · Resets to sale price
- Current annual tax
- $10,694 · $891/mo
- Projected year-2 tax
- $10,694 · $891/mo
- Expected delta
- $0/yr ($0/mo · 0.0%)
ⓘ Screening estimate from a state-policy table — verify with the county assessor before closing.
Climate risk First Street
- Flood 1/10 Low FEMA zone X (unshaded) · 0% chance over 30 yrs
- Wildfire 1/10 Low
- Heat 10/10 Extreme 7 d/yr ≥104°F today · 28 d/yr by 30 yrs out
- Wind 10/10 Extreme 99% chance of damaging wind over 30 yrs
- Air quality 2/10 Low 1 unhealthy d/yr today · 1 by 30 yrs out
Nearby sold comps map
Loading sold comps map…
Walkable amenities ~0.75 mi
Loading nearby amenities…
Taxation est. · year 1
- Rental income
- $79,476
- − Mortgage interest
- −$49,013
- − Property taxes
- −$10,694
- − Insurance
- −$4,375
- − Repairs & maintenance
- −$6,358
- − Management
- −$6,358
- − Depreciation
- −$25,454
- Taxable loss
- −$22,777
- Est. tax savings @ 24.0%
- +$5,466
- After-tax cash flow
- $-1,879/yr
For passive investors: Depreciation is non-cash, so a rental often shows a tax loss while cash-flowing — sheltering income. Rental losses are passive: they offset passive income freely, and up to $25,000/yr can offset ordinary (W-2) income if you actively participate and your MAGI is under $100k (phasing out to $0 by $150k); unused losses carry forward. On sale, claimed depreciation is recaptured at up to 25%, and gains may owe capital-gains tax (a 1031 exchange can defer both). Figures are a year-1 estimate at your 24.0% rate — not tax advice; consult a CPA.
Schools (NCES district)
- District
- Miami-Dade
- NCES district ID
- 1200390
- Math proficiency
- 45% ▼ -16.00%
- Reading proficiency
- 54% ▼ -5.00%
- Median HH income
- $43,928
- Composite
- 41.76/100
- National rank
- #3397
- State rank
- #40 of 73 in FL
Livability — Miami
- Score
- 78/100
- State rank
- #177
- US rank
- #2724
Category grades
Schools grade is shown separately in the Schools card above.
Census & demographics
- Census place
- Miami, FL
- County
- Miami-Dade County · 2,697,751 people
- City population
- 827,308
- Metro
- Miami-Fort Lauderdale-Pompano Beach, FL
- Population (ZIP)
- 56,897
- Household income
- $44,979
- Rent vs Own
- Severe rent burden
- 5223.0
Population outlook (Miami-Dade County) Hauer SSP2
- Today (2025)
- 3,126,439 people
- By 2030
- 3,325,765 · +6.4%
- By 2040
- 3,697,561 · +18.3%
- By 2050
- 4,012,134 · +28.3%
- By 2075
- 4,605,612 · +47.3%
- By 2100
- 4,866,598 · +55.7%
Race, ethnicity, and origin ACS 2023
- Neighborhood character
- Predominantly Hispanic (92%)
- Race & ethnicity
- Hispanic / Latino 92% Two or more races 52% White 4% Black 4%
- Hispanic origin (detail)
- Mexican 2% Puerto Rican 3% Cuban 46% Dominican 3% Salvadoran 1%
- Common ancestry
- Hispanic 1%
- Foreign-born
- 68% · Canada, Jamaica, Dominican Republic
- Languages at home
- 9% English-only · Spanish 90%
Political lean MEDSL · Miami-Dade
- 2024 margin
- R (+11.4) · D 43.9% · R 55.4%
- 2008→2024 swing
- -27.6pp toward R · 2008: 16.1pp · 2024: -11.4pp
- All cycles
- 2024: R+11.4 2020: D+7.3 2016: D+29.6 2012: D+23.7 2008: D+16.1
Not yet ingested
- Civics
- —
Market trends
- HPI YoY
- ▼ -402.98%
- Current HPI
- 476.1631
- Rent YoY
- ▼ -1.39%
- Metro
- Miami-Fort Lauderdale-Pompano Beach, FL
- State GDP YoY
- ▲ 3.28%
- F500 in state
- 36
Industry mix (Fortune 500 HQ in FL)
| Industry | F500 HQs | Revenue |
|---|---|---|
| Industrial Technology | 2 | $29B |
|
||
| Insurance | 2 | $17B |
|
||
| Retail | 1 | $60B |
|
||
| Technology Distribution | 1 | $58B |
|
||
| Homebuilding | 1 | $35B |
|
||
| Technology Manufacturing | 1 | $35B |
|
||
Price history
+36.9% since first listed16 events — show timeline
- 2026-04-21 Price Changed $874,990 MARMLS
- 2026-04-09 Price Changed $889,900 MARMLS
- 2026-03-14 Listed $900,000 MARMLS
- 2025-01-31 Sold (Public Records) $755,000 Public Records
- 2024-10-21 Sold (Public Records) $565,000 Public Records
- 2024-10-11 Sold (MLS) $565,000 MARMLS
- 2024-10-01 Pending — MARMLS
- 2024-09-27 Listing Removed — MARMLS
- 2024-09-27 Listed $589,999 MARMLS
- 2024-09-23 Price Changed $589,999 MARMLS
- 2024-09-13 Listed $599,995 MARMLS
- 2024-07-26 Sold (Public Records) $473,000 Public Records
- 2022-06-30 Listing Removed — MARMLS
- 2022-06-17 Price Changed $580,000 MARMLS
- 2022-05-06 Price Changed $600,000 MARMLS
- 2022-04-24 Listed $639,000 MARMLS
Property tax history
+7.2%/yrLatest (2025): $10,694 · +122.9% YoY. Source: county tax records.
Cash-flow waterfall
monthlySold comps — $/sqft
last 12 mo · ≤1 miLoading sold comps…