465 Lakeside Trl · Gumlog, GA
Flood risk 1/10 · Minimal
- FEMA flood zone
- X (unshaded)
- Chance of flooding over 30 yrs
- 0.0%
- Est. flood insurance / yr
- $507 – $1,088
Fire risk 3/10 · Minor
- Est. fire insurance / yr
- $963 – $1,789
Heat risk 5/10 · Moderate
- Hot days now (above 105°F)
- 7 days/yr
- Hot days in 30 yrs
- 17 days/yr
Wind risk 2/10 · Minimal
- Chance of severe wind over 30 yrs
- 3.0%
Air-quality risk 4/10 · Minor
- Unhealthy air days now
- 4 days/yr
- Unhealthy air days in 30 yrs
- 5 days/yr
Risk factors via First Street. Map © Google.
Why this score? — see what drove the D+ grade
The composite is a weighted blend of 9 inputs, each scored 0–100. Each bar is that input's sub-score; the figure is the points it added to the 100-point composite (weight × sub-score).
- ARV discount +15.0/15.0
- Appreciation +10.0/10.0
- Cash flow +7.4/30.0
- Livability +3.3/5.0
- Schools +2.8/10.0
- Rent growth +2.5/5.0
- Condition / age +2.5/5.0
- 1% rule +1.5/10.0
- DSCR +1.5/10.0
$269,900
🖨 Deal sheet 📄 Offer letter ✓ Due diligence
Listing remarks
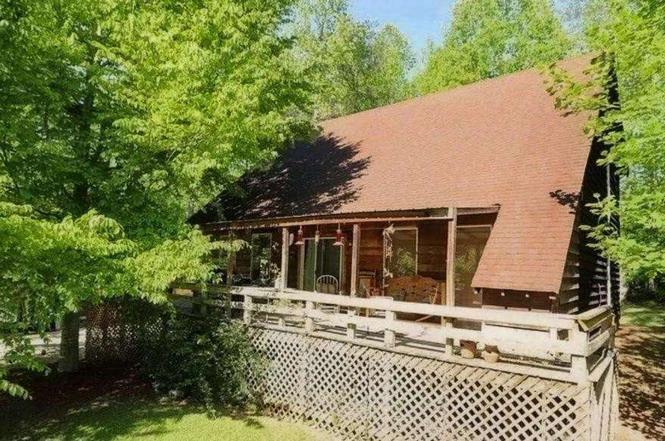
Very cute and cozy Cabin across the street from Lake Hartwell. Enjoy lake living without the lake prices. 2 bedroom 2 bath with a loft area upstairs. Gorgeous wood detailing on the inside! You will fall in love the minute you pull up. Large kitchen and dining room area makes this an attractive home for entertaining guests. Beautiful rocking chair front porch for relaxing and listening to the sounds of the lake! Outbuilding available for extra storage. Access to private boat ramp & community dock/pavilion area.
Key facts
- Wood detailing
- Outbuilding
- Lake hartwell
Tags
Property features AI
Finance
- Other: Listing accepts Cash, Conventional, FHA, USDA, VA and 1031 Exchange
- HOA & community: Has association (no association fee listed); Community features include lake and shared dock
Exterior
- Parking: Parking pad; Open parking for 2 vehicles
- Utilities: Public water available; Septic tank; Electricity available
- Home design: Single-family residence; House structure; Two levels; Built in 2003; Living area approximately 1,938 sq ft
- Construction: Log construction; Composition roof; Crawl space foundation
- Exterior features: Private lot; Lake access (Lake Hartwell); Shared dock; Outbuilding
Interior
- Kitchen: Dishwasher; Microwave; Oven; Refrigerator; Electric water heater
- Bedrooms: 3 bedrooms total; 1 bedroom on the main level
- Flooring: Hardwood; Laminate
- Bathrooms: 2 full bathrooms; 1 bathroom on the main level
- Heating & cooling: Central heating; Central air; Ceiling fan(s)
- Interior features: High ceilings; Vaulted ceilings; Bonus room; Family room; Loft; Crawl space basement; Updated/remodeled condition
- Laundry & utility: Washer; Dryer; Laundry closet
Neighborhood map
What this means for you Summary
Snapshot
- This is a 3-bed/2.0-bath single-family listed at $270k.
Deal economics
- At list price, monthly cash flow is $-353 ($-4k/yr) — negative.
- To cash-flow at today's rent, offer at most $208k (23.1% below list).
- To meet the 1% rule (rent ≥ 1% of price), the offer needs to be $175k (35.2% below list).
- Recommended offer: $175k (35.2% below list) — sets the bar for 1% rule.
- Cap rate 4.7% vs local median 2.7% in Gumlog — top-decile yield for the area; either an underpriced asset or a hidden risk that comps aren't pricing in. Stress-test before assuming the spread holds.
Location & tenants
- Location reads 66/100 on livability (#185 in GA) — a middle-class / working-renter tenant base. Strengths: crime A+, cost of living A+, housing A+; Watch: schools F, amenities F, commute F.
- Stephens County (rural): math 34% / reading 34% proficiency, ranked #74 of 174 in GA (top 42%) — families likely to look elsewhere, expect single-tenant / working-renter base with shorter leases.
- Market conditions: 125 active listings in the ZIP; 2 comparable units currently listed for rent nearby; 52 units permitted in Stephens County in 2024 (0 in 5+ unit buildings).
Forward outlook
- In year one you build about $29k of equity ($2k loan paydown + $27k appreciation (10.0% local appreciation)).
- Stephens County population projected at -21% by 2050 — secular population decline; favor cash flow + early exit over multi-decade hold.
- By year 2, paydown + projected appreciation supports a ~$46k cash-out refi (75% LTV) — recoverable capital for the next deal without selling this one.
Negotiation context
- It's been on market 16 days — a 2% lower offer ($266k) is reasonable based on typical stale-listing flexibility.
- 5 sale attempts with the ask held roughly flat each time — persistent listings suggest the price (not the market) is what's stuck; bring a comps-based counter.
- Current owner paid $173k; list at $270k implies a 56% gain — meaningful room to come down on a strong offer.
Risks & watch-outs
- Climate carrying-cost: extreme-heat days projected 7→17/yr by 2055 (HVAC capex compounding) — expect insurance premiums to compound above CPI over the hold.
Questions for the listing agent
- What do current leases actually rent for vs. the listed asking? Can we see a recent rent roll and the last 12 months of T-12 income?
- Is there a deadline driving the sale (1031 exchange, divorce, estate, relocation)? That informs how much negotiation room exists.
- Schools are F-rated, which usually means shorter tenancies and higher turnover. Who's the typical renter profile here, and what's been the actual vacancy rate?
- The area grade is low — what's the realistic commute time and amenity access for the typical tenant pool here? Any planned neighborhood developments (good or bad) we should know about?
- What's the average days-on-market for RENTAL listings here right now (not sales)? A rising rental-DOM trend means longer vacancies and softer asking-rent achievability than the comps imply.
- What's the recent tenant-quality profile in this submarket — average credit score on applications, eviction rate, late-payment / NSF rate, and stable-employment percentage? A property-management company in the area should have these aggregated.
- How much new for-sale + rental construction is in the pipeline within 1–3 miles? Heavy new supply typically softens prices + rents 12–24 months out; constrained supply supports both.
Investment metrics
- 1% rule
- 0.65% ✗
- Cap rate
- 4.72%
- Cash-on-cash
- -5.60%
- DSCR
- 0.75
- GRM
- 12.9
CMA / ARV
- ARV (on-the-fly)
- $498,066
- Comps found
- 2
Show comp detail 2 sales within ~0.75 mi
| Address | Dist | Beds/Ba | Sqft | Sold | Price | $/sf | Match |
|---|---|---|---|---|---|---|---|
| 704 Lakeside Trl | 0.19mi | 3/2.0 | 1,800 (-7%) | 11mo | $375,000 | $208 | 70 |
| 1228 Seven Forks Rd | 0.49mi | 3/2.5 | 1,956 (+1%) | 8mo | $502,500 | $257 | 67 |
Match score weights: distance 35% · size 25% · config 20% · recency 20%. Top-matched comps best support the ARV.
Projected returns pro-forma
10.0% appreciation · 3.0% rent growth · sell at horizon
- IRR
- 20.3%
- Equity multiple
- 2.65×
- Total profit
- $124,462
- Equity at exit
- $243,147
- IRR
- 18.5%
- Equity multiple
- 6.08×
- Total profit
- $384,092
- Equity at exit
- $524,356
Cash invested: $75,572 (down + closing). Projections, not guarantees.
Landlord ↔ Tenant lean methodology
- Overall (STATE)
- 90 Strongly Landlord-Friendly
- State Georgia
- 90 Strongly Landlord-Friendly · R+3
- County
- — inherits STATE
- City
- — inherits STATE
ZIP-level market 30557
- Home prices YoY
- 5.6%
- Active inventory
- 125
- Price-to-rent
- 12.9×
Monthly cashflow live
- Estimated rent
- $1,750 medium interval (Pro) →
- Mortgage (P&I)
- −$1,415
- Tax from tax record
- −$208 /mo · $2,491/yr
- Insurance
- −$112
- HOA
- −$0
- Vacancy / Maint / Mgmt
- −$368
- Net cashflow
- $-353
Break-even live
UW: 25.0% down · 7.5% · 30yr · 1.5% tax · 5.0% vac · 8.0% maint · 8.0% mgmt
Financing live
Cash to close
- Down payment
- $67,475
- Closing costs
- $8,097
- Reserves months
- —
- Total cash needed
- —
Loan-product check · same deal, 3 products live
Conventional
25% down · 7.5% · 30yr
- Down + closing
- —
- Monthly P&I
- —
- Monthly cashflow
- —
- DSCR
- —
- Eligible?
- —
Personal DTI + credit; lowest rate.
DSCR
20% down · 8.5% · 30yr
- Down + closing
- —
- Monthly P&I
- —
- Monthly cashflow
- —
- DSCR
- —
- Eligible?
- —
No personal income docs; deal must DSCR.
Hard money
10% down · 12.0% · 12mo
- Down + closing
- —
- Monthly P&I
- —
- Monthly cashflow
- —
- DSCR
- —
- Eligible?
- —
Short-term bridge; refi at stabilization.
Rent comps 2 comps
| Address | Beds | Baths | Sqft | Rent | $/sqft | DOM | Units | Dist |
|---|---|---|---|---|---|---|---|---|
| 465 Lakeside Trl Martin, GA | 3.0 | 2.0 | 1938 | $1,700 | $0.88 | 43d | 1 | 0.02mi |
| 465 Lakeside Trl Martin, GA | 2.0 | 2.0 | 1938 | $1,800 | $0.93 | 23d | 1 | 0.02mi |
Listing history 13 events
-
2026-06-19days on market $269,900 Active 16 DOM
-
2026-06-18days on market $269,900 Active 15 DOM
-
2026-06-17statusdays on market $269,900 Active 14 DOM
-
2026-06-16days on market $269,900 New 13 DOM
-
2026-06-15days on market $269,900 New 12 DOM
-
2026-06-14days on market $269,900 New 10 DOM
-
2026-06-12days on market $269,900 New 9 DOM
-
2026-06-09days on market $269,900 New 6 DOM
-
2026-06-08days on market $269,900 New 5 DOM
-
2026-06-07days on market $269,900 New 4 DOM
-
2026-06-07days on market $269,900 New 3 DOM
-
2026-06-03remarks 518-char remark
-
2026-06-03$269,900 New 1 DOM
ⓘ Source: listings_history table (triggers on properties + properties_extension) + one-shot
backfill from property_details.listing_events for pre-trigger history.
Tax reassessment forecast GA · Resets to sale price
- Current annual tax
- $2,491 · $208/mo
- Projected year-2 tax
- $2,491 · $208/mo
- Expected delta
- $0/yr ($0/mo · 0.0%)
ⓘ Screening estimate from a state-policy table — verify with the county assessor before closing.
Climate risk First Street
- Flood 1/10 Low FEMA zone X (unshaded) · 0% chance over 30 yrs
- Wildfire 3/10 Moderate
- Heat 5/10 Major 7 d/yr ≥105°F today · 17 d/yr by 30 yrs out
- Wind 2/10 Low 3% chance of damaging wind over 30 yrs
- Air quality 4/10 Moderate 4 unhealthy d/yr today · 5 by 30 yrs out
Nearby sold comps map
Loading sold comps map…
Walkable amenities ~0.75 mi
Loading nearby amenities…
Taxation est. · year 1
- Rental income
- $21,000
- − Mortgage interest
- −$15,119
- − Property taxes
- −$2,491
- − Insurance
- −$1,350
- − Repairs & maintenance
- −$1,680
- − Management
- −$1,680
- − Depreciation
- −$7,852
- Taxable loss
- −$9,171
- Est. tax savings @ 24.0%
- +$2,201
- After-tax cash flow
- $-2,034/yr
For passive investors: Depreciation is non-cash, so a rental often shows a tax loss while cash-flowing — sheltering income. Rental losses are passive: they offset passive income freely, and up to $25,000/yr can offset ordinary (W-2) income if you actively participate and your MAGI is under $100k (phasing out to $0 by $150k); unused losses carry forward. On sale, claimed depreciation is recaptured at up to 25%, and gains may owe capital-gains tax (a 1031 exchange can defer both). Figures are a year-1 estimate at your 24.0% rate — not tax advice; consult a CPA.
Schools (NCES district)
- District
- Stephens County
- NCES district ID
- 1304560
- Math proficiency
- 34% ▼ -6.00%
- Reading proficiency
- 34% ▼ -4.00%
- Median HH income
- $38,416
- Composite
- 28.42/100
- National rank
- #6759
- State rank
- #74 of 174 in GA
Livability — Gumlog
- Score
- 66/100
- State rank
- #185
- US rank
- #11633
Category grades
Schools grade is shown separately in the Schools card above.
Census & demographics
- Population (ZIP)
- 4,905
Population outlook (Stephens County) Hauer SSP2
- Today (2025)
- 23,797 people
- By 2030
- 22,785 · -4.3%
- By 2040
- 20,653 · -13.2%
- By 2050
- 18,745 · -21.2%
- By 2075
- 14,780 · -37.9%
- By 2100
- 11,079 · -53.4%
Race, ethnicity, and origin ACS 2023
- Neighborhood character
- Predominantly White (87%)
- Race & ethnicity
- White 87% Black 8% Two or more races 4%
- Common ancestry
- Italian 5% Serbian 2% Iranian 1%
- Foreign-born
- 0%
- Languages at home
- 99% English-only · French/Haitian/Cajun 1%
Political lean MEDSL · Stephens
- 2024 margin
- Solid R (+62.8) · D 18.4% · R 81.2%
- 2008→2024 swing
- -15.4pp toward R · 2008: -47.4pp · 2024: -62.8pp
- All cycles
- 2024: R+62.8 2020: R+58.7 2016: R+59.9 2012: R+53.7 2008: R+47.4
Not yet ingested
- Civics
- —
Market trends
- HPI YoY
- ▲ 18.48%
- Current HPI
- 350.6536
- Rent YoY
- —
- Metro
- —
- State GDP YoY
- ▲ 2.66%
- F500 in state
- 28
Industry mix (Fortune 500 HQ in GA)
| Industry | F500 HQs | Revenue |
|---|---|---|
| Paper / Packaging | 2 | $29B |
|
||
| Retail | 1 | $160B |
|
||
| Transportation / Logistics | 1 | $91B |
|
||
| Airlines | 1 | $62B |
|
||
| Consumer Goods | 1 | $47B |
|
||
| Utilities | 1 | $25B |
|
||
Price history
+56.0% since first listed9 events — show timeline
- 2026-06-03 Listed $269,900 GAMLS
- 2026-05-21 Listed for Rent $1,800 TENANTCLOUD
- 2026-05-19 Rental Removed $1,700 GAMLS
- 2026-04-21 Listed for Rent $1,700 GAMLS
- 2026-04-01 Rental Removed $1,700 GAMLS
- 2026-03-21 Listed for Rent $1,700 GAMLS
- 2025-06-02 Rental Removed $1,700 GAMLS
- 2025-01-21 Listed for Rent $1,700 GAMLS
- 2023-07-31 Sold (Public Records) $173,000 Public Records
Property tax history
+12.6%/yrLatest (2025): $2,491 · +26.0% YoY. Source: county tax records.
Cash-flow waterfall
monthlySold comps — $/sqft
last 12 mo · ≤1 miLoading sold comps…