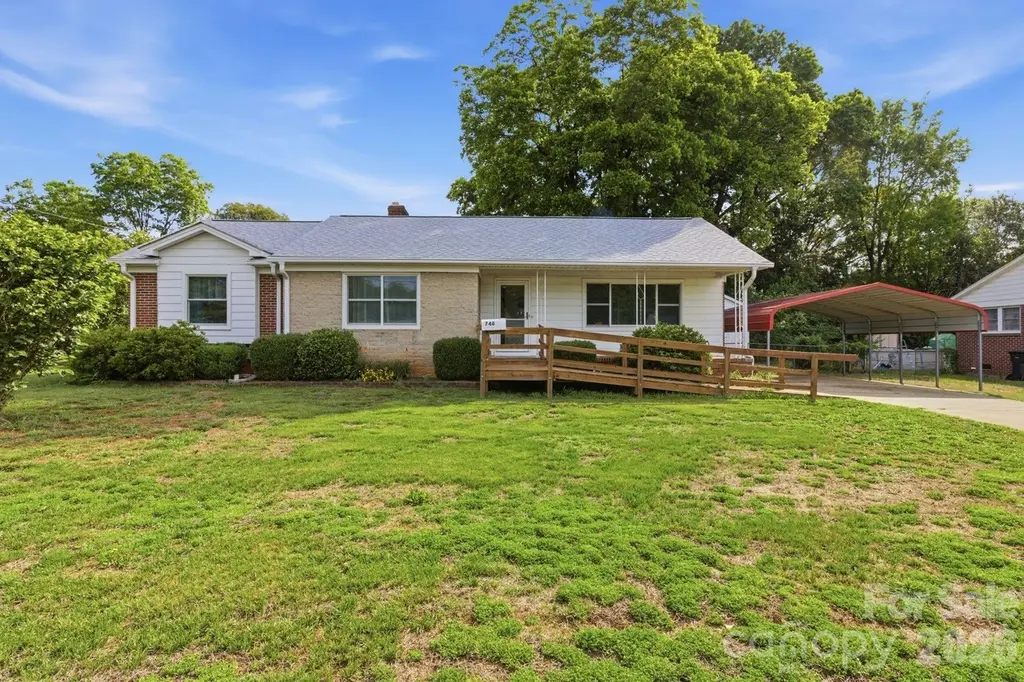
748 Emorywood Ave · Rock Hill, SC
Flood risk 1/10 · Minimal
- FEMA flood zone
- X (unshaded)
- Chance of flooding over 30 yrs
- 0.0%
- Est. flood insurance / yr
- $507 – $1,088
Fire risk 1/10 · Minimal
- Est. fire insurance / yr
- $783 – $1,453
Heat risk 6/10 · Moderate
- Hot days now (above 105°F)
- 7 days/yr
- Hot days in 30 yrs
- 16 days/yr
Wind risk 6/10 · Moderate
- Chance of severe wind over 30 yrs
- 27.0%
Air-quality risk 3/10 · Minor
- Unhealthy air days now
- 3 days/yr
- Unhealthy air days in 30 yrs
- 3 days/yr
Risk factors via First Street. Map © Google.
Why this score? — see what drove the D+ grade
The composite is a weighted blend of 9 inputs, each scored 0–100. Each bar is that input's sub-score; the figure is the points it added to the 100-point composite (weight × sub-score).
- ARV discount +15.0/15.0
- Cash flow +13.4/30.0
- DSCR +4.0/10.0
- Rent growth +3.9/5.0
- Schools +3.5/10.0
- Livability +3.5/5.0
- 1% rule +2.7/10.0
- Condition / age +2.5/5.0
- Appreciation +0.0/10.0
$225,000
🖨 Deal sheet 📄 Offer letter ✓ Due diligence
Listing remarks
Classic 3 bedroom 1.5 bath brick ranch home in desirable neighborhood ready for your finishing touches. New high quality windows and front door (2025), tankless water heater, new roof (2024), leaf guard gutters, updated entire electrical service, remodeled bathroom (2023), new insulation (2023). Flat lot with 2 wired storage buildings 10'x18' and 8'x10'. Fenced back yard with large pecan tree. Close to York County Technical College and easy access to Winthrop University. * * * MULTIPLE OFFERS - SELLER ASKING FOR HIGHEST & BEST BE SUBMITTED BY MONDAY 5/18/26 @ 6:00PM
Key facts
- High quality windows
- Newly replaced hvac
- Fenced back yard
Tags
Property features AI
Finance
- HOA & community: No HOA
Exterior
- Parking: Detached carport (2 spaces); Driveway parking; On-street parking
- Security: Smoke detectors; Carbon monoxide detectors
- Utilities: City water; Public sewer
- Home design: Single-family residence; Site-built construction; One story; Brick exterior
- Construction: Brick full construction; Crawl space foundation
- Exterior features: Covered front porch; Storage shed/area; Chain-link fencing around backyard; Level lot; Publicly maintained paved concrete road
Interior
- Kitchen: Dishwasher; Electric oven; Electric range; Exhaust fan; Pantry
- Bedrooms: Three bedrooms on the main level
- Flooring: Wood flooring; Linoleum flooring
- Bathrooms: One full bath (main); One half bath (main)
- Heating & cooling: Central heating (natural gas); Central air conditioning
- Interior features: Attic with pull-down stairs; Pantry; Insulated windows; Pocket doors; Storm door(s); 8 total rooms; Wood-burning fireplace in family room; Tankless water heater
- Laundry & utility: Washer hookup; Gas dryer hookup; Laundry area located in kitchen
Neighborhood map
What this means for you Summary
Snapshot
- This is a 3-bed/1.5-bath single-family listed at $225k.
Deal economics
- At list price, monthly cash flow is $6 ($69/yr) — positive.
- The deal already cash-flows at list — no discount required.
- To meet the 1% rule (rent ≥ 1% of price), the offer needs to be $174k (22.7% below list).
- Recommended offer: $174k (22.7% below list) — sets the bar for 1% rule.
- Cap rate 6.3% vs local median 3.4% in Rock Hill — top-decile yield for the area; either an underpriced asset or a hidden risk that comps aren't pricing in. Stress-test before assuming the spread holds.
Location & tenants
- Location reads 70/100 on livability (#62 in SC) — a middle-class / working-renter tenant base. Strengths: cost of living A+, housing A+, health & safety A+; Watch: employment D+, crime D-, amenities D-.
- York 03 (urban): math 36% / reading 47% proficiency, ranked #32 of 80 in SC (top 40%) — families likely to look elsewhere, expect single-tenant / working-renter base with shorter leases.
- Zoned schools: Ebenezer Avenue Elementary: Traditional Montesorri Inquiry (math 42% / reading 47%, grade F, #226 of 597 statewide, top 40%, 475 students, 44% FRL); Rock Hill High (math 57% / reading 81%, grade B, #65 of 196 statewide, top 34%, 1,945 students, 55% FRL) — zoned schools at 49% FRL track the district average.
- Zoned-school proficiency averages 57% at this address vs 42% district-wide (+15 pts) — the actual schools serving this property are materially stronger than the York 03 average implies; a family-tenant draw the district grade alone would hide.
- Market conditions: Rents rising fast (+5.5%/yr); 348 active listings in the ZIP; 19 comparable units currently listed for rent nearby; rentals at typical pace (median 15d on market — plan ~3-4 weeks tenant-placement turnaround); 2,550 units permitted in York County in 2024 (350 in 5+ unit buildings).
- This rent runs 30% of the median local income ($69k/yr) — at the standard rent-burdened threshold; future hikes will face affordability resistance.
Forward outlook
- Local home prices are declining (-3.0%/yr); year-one equity from $2k of loan paydown is wiped out by about $7k of value loss. Plan a longer hold.
- York County population projected at +44% by 2050 — long-run rental-demand tailwind backs the buy-and-hold thesis.
Negotiation context
- Only 4 days on market — expect competitive offers; lowballing is unlikely to land.
Risks & watch-outs
- Climate carrying-cost: major wind risk, 27% chance of damaging wind over 30y; extreme-heat days projected 7→16/yr by 2055 (HVAC capex compounding) — expect insurance premiums to compound above CPI over the hold.
Questions for the listing agent
- Built in 1960 — when were the roof, HVAC, electrical panel, plumbing, and water heater last replaced?
- Is there a deadline driving the sale (1031 exchange, divorce, estate, relocation)? That informs how much negotiation room exists.
- Schools are D-rated, which usually means shorter tenancies and higher turnover. Who's the typical renter profile here, and what's been the actual vacancy rate?
- Crime grade is D in this area — have there been break-ins, vandalism, or insurance claims at this property in the last 3 years? What carrier currently insures it and at what premium?
- The area grade is low — what's the realistic commute time and amenity access for the typical tenant pool here? Any planned neighborhood developments (good or bad) we should know about?
- What's the average days-on-market for RENTAL listings here right now (not sales)? A rising rental-DOM trend means longer vacancies and softer asking-rent achievability than the comps imply.
- What's the recent tenant-quality profile in this submarket — average credit score on applications, eviction rate, late-payment / NSF rate, and stable-employment percentage? A property-management company in the area should have these aggregated.
- How much new for-sale + rental construction is in the pipeline within 1–3 miles? Heavy new supply typically softens prices + rents 12–24 months out; constrained supply supports both.
Investment metrics
- 1% rule
- 0.77% ✗
- Cap rate
- 6.32%
- Cash-on-cash
- 0.11%
- DSCR
- 1.00
- GRM
- 10.8
CMA / ARV
- ARV (on-the-fly)
- $288,606
- Comps found
- 12
Show comp detail 12 sales within ~0.75 mi
| Address | Dist | Beds/Ba | Sqft | Sold | Price | $/sf | Match |
|---|---|---|---|---|---|---|---|
| 785 Rabun Ln | 0.12mi | 3/1.0 | 1,366 (-2%) | 2mo | $250,000 | $183 | 87 |
| 1508 Eden Ter | 0.20mi | 3/1.5 | 1,456 (+4%) | 5mo | $185,000 | $127 | 80 |
| 1838 Townes Ct | 0.34mi | 3/2.0 | 1,378 (-2%) | 2mo | $345,000 | $250 | 78 |
| 521 Rabun Cir | 0.29mi | 3/2.0 | 1,323 (-6%) | 3mo | $312,000 | $236 | 72 |
| 753 Nations Ct | 0.49mi | 3/1.0 | 1,323 (-6%) | 2mo | $270,000 | $204 | 64 |
| 1838 Eden Ter | 0.31mi | 3/2.0 | 1,232 (-12%) | 0mo | $285,000 | $231 | 63 |
| 1107 Ebinport Rd | 0.52mi | 2/2.0 (-1) | 1,455 (+4%) | 0mo | $250,000 | $172 | 62 |
| 876 Kentwood Dr | 0.58mi | 3/2.0 | 1,500 (+7%) | 2mo | $285,100 | $190 | 57 |
| 744 University Dr | 0.30mi | 3/2.0 | 1,608 (+15%) | 3mo | $343,900 | $214 | 57 |
| 1337 Eisenhower Rd | 0.40mi | 2/2.0 (-1) | 1,226 (-12%) | 3mo | $180,000 | $147 | 51 |
| 1245 Berryhill Ln | 0.74mi | 3/2.0 | 1,490 (+6%) | 5mo | $345,000 | $232 | 49 |
| 1632 Phelps St | 0.65mi | 3/2.0 | 1,576 (+12%) | 4mo | $325,000 | $206 | 43 |
Match score weights: distance 35% · size 25% · config 20% · recency 20%. Top-matched comps best support the ARV.
Projected returns pro-forma
-3.0% appreciation · 5.53% rent growth · sell at horizon
- IRR
- -13.7%
- Equity multiple
- 0.50×
- Total profit
- $-31,644
- Equity at exit
- $33,548
- IRR
- -1.7%
- Equity multiple
- 0.88×
- Total profit
- $-7,829
- Equity at exit
- $19,454
Cash invested: $63,000 (down + closing). Projections, not guarantees.
Landlord ↔ Tenant lean methodology
- Overall (STATE)
- 90 Strongly Landlord-Friendly
- State South Carolina
- 90 Strongly Landlord-Friendly · R+6
- County
- — inherits STATE
- City
- — inherits STATE
ZIP-level market 29730
- Rents YoY
- 5.5%
- Active inventory
- 348
- Price-to-rent
- 10.8×
Monthly cashflow live
- Estimated rent
- $1,739 high interval (Pro) →
- Mortgage (P&I)
- −$1,180
- Tax from tax record
- −$94 /mo · $1,132/yr
- Insurance
- −$94
- HOA
- −$0
- Vacancy / Maint / Mgmt
- −$365
- Net cashflow
- $6
Break-even live
UW: 25.0% down · 7.5% · 30yr · 1.5% tax · 5.0% vac · 8.0% maint · 8.0% mgmt
Financing live
Cash to close
- Down payment
- $56,250
- Closing costs
- $6,750
- Reserves months
- —
- Total cash needed
- —
Loan-product check · same deal, 3 products live
Conventional
25% down · 7.5% · 30yr
- Down + closing
- —
- Monthly P&I
- —
- Monthly cashflow
- —
- DSCR
- —
- Eligible?
- —
Personal DTI + credit; lowest rate.
DSCR
20% down · 8.5% · 30yr
- Down + closing
- —
- Monthly P&I
- —
- Monthly cashflow
- —
- DSCR
- —
- Eligible?
- —
No personal income docs; deal must DSCR.
Hard money
10% down · 12.0% · 12mo
- Down + closing
- —
- Monthly P&I
- —
- Monthly cashflow
- —
- DSCR
- —
- Eligible?
- —
Short-term bridge; refi at stabilization.
Rent comps 19 comps
| Address | Beds | Baths | Sqft | Rent | $/sqft | DOM | Units | Dist |
|---|---|---|---|---|---|---|---|---|
| 1674 Eagles Pl Unit 1 Rock Hill, SC | 2.0 | 2.0 | 1000 | $1,240 | $1.24 | 24d | 1 | 0.48mi |
| 1304 Deas St Rock Hill, SC | 3.0 | 2.0 | 1356 | $1,995 | $1.47 | 24d | 1 | 0.79mi |
| 1800 Marett Blvd Ext Rock Hill, SC | 1.0–3.0 | 1.0–2.0 | 964 | $1,775 | $1.84 | 3d | 16 | 0.90mi |
| 1042 Bose Ave Rock Hill, SC | 2.0 | 1.0 | 900 | $1,295 | $1.44 | 24d | 1 | 0.91mi |
| 917 Cherry Rd Rock Hill, SC | 3.0 | 1.5 | 1350 | $1,995 | $1.48 | 24d | 1 | 1.02mi |
| 1502 Woodhaven Rd Rock Hill, SC | 3.0 | 1.0 | 1248 | $1,700 | $1.36 | 17d | 1 | 1.07mi |
| 1000 Beverly Dr Rock Hill, SC | 2.0 | 1.0 | 1116 | $2,150 | $1.93 | 12d | 1 | 1.10mi |
| 2361 Eden Ter Rock Hill, SC | 2.0 | 2.0 | 1025 | $1,309 | $1.28 | 2d | 1 | 1.23mi |
| 2361 Eden Ter Rock Hill, SC | 3.0 | 2.0 | 1200 | $1,629 | $1.36 | 3d | 1 | 1.23mi |
| 2361 Eden Ter Rock Hill, SC | 2.0 | 2.0 | 1025 | $1,399 | $1.36 | 14d | 1 | 1.23mi |
| 2361 Eden Ter Rock Hill, SC | 2.0 | 2.0 | 1012 | $1,358 | $1.34 | 19d | 6 | 1.23mi |
| 764 McDow Dr Rock Hill, SC | 3.0 | 2.0 | 1063 | $1,975 | $1.86 | 24d | 1 | 1.27mi |
| 793 Patriot Pkwy Rock Hill, SC | 2.0 | 2.0 | 1080 | $1,500 | $1.39 | 2d | 1 | 1.35mi |
| 793 Patriot Pkwy Rock Hill, SC | 2.0 | 2.0 | 1080 | $1,565 | $1.45 | 24d | 1 | 1.35mi |
| 316 Piedmont St Rock Hill, SC | 2.0 | 1.5 | 1014 | $1,450 | $1.43 | 4d | 1 | 1.38mi |
| 316 Piedmont St Rock Hill, SC | 2.0 | 1.5 | 1014 | $1,595 | $1.57 | 24d | 1 | 1.38mi |
| 2075 Franklin St Rock Hill, SC | 3.0 | 2.0 | 1339 | $2,150 | $1.61 | 2d | 1 | 1.40mi |
| 752 Patriot Pkwy Rock Hill, SC | 3.0 | 1.0–2.0 | 708 | $1,550 | $2.19 | 1d | 21 | 1.40mi |
| 332 Voldemort St Rock Hill, SC | 3.0 | 2.0 | 1800 | $2,195 | $1.22 | 1d | 2 | 1.48mi |
Listing history 2 events
-
2026-05-19status Pending
-
2026-05-14$225,000 Active
ⓘ Source: listings_history table (triggers on properties + properties_extension) + one-shot
backfill from property_details.listing_events for pre-trigger history.
Tax reassessment forecast SC · Resets to sale price
- Current annual tax
- $1,132 · $94/mo
- Projected year-2 tax
- $1,282 · $107/mo
- Expected delta
- +$151/yr (+$13/mo · 13.3%)
ⓘ Screening estimate from a state-policy table — verify with the county assessor before closing.
Climate risk First Street
- Flood 1/10 Low FEMA zone X (unshaded) · 0% chance over 30 yrs
- Wildfire 1/10 Low
- Heat 6/10 Major 7 d/yr ≥105°F today · 16 d/yr by 30 yrs out
- Wind 6/10 Major 27% chance of damaging wind over 30 yrs
- Air quality 3/10 Moderate 3 unhealthy d/yr today · 3 by 30 yrs out
Nearby sold comps map
Loading sold comps map…
Walkable amenities ~0.75 mi
Loading nearby amenities…
Taxation est. · year 1
- Rental income
- $20,867
- − Mortgage interest
- −$12,603
- − Property taxes
- −$1,132
- − Insurance
- −$1,125
- − Repairs & maintenance
- −$1,669
- − Management
- −$1,669
- − Depreciation
- −$6,545
- Taxable loss
- −$3,878
- Est. tax savings @ 24.0%
- +$931
- After-tax cash flow
- $1,000/yr
For passive investors: Depreciation is non-cash, so a rental often shows a tax loss while cash-flowing — sheltering income. Rental losses are passive: they offset passive income freely, and up to $25,000/yr can offset ordinary (W-2) income if you actively participate and your MAGI is under $100k (phasing out to $0 by $150k); unused losses carry forward. On sale, claimed depreciation is recaptured at up to 25%, and gains may owe capital-gains tax (a 1031 exchange can defer both). Figures are a year-1 estimate at your 24.0% rate — not tax advice; consult a CPA.
Schools (NCES district)
- District
- York 03
- NCES district ID
- 4503870
- Math proficiency
- 36% ▼ -8.00%
- Reading proficiency
- 47% ▲ 3.00%
- Median HH income
- $47,570
- Composite
- 35.46/100
- National rank
- #4928
- State rank
- #32 of 80 in SC
Livability — Rock Hill
- Score
- 70/100
- State rank
- #62
- US rank
- #7573
Category grades
Schools grade is shown separately in the Schools card above.
Census & demographics
- Census place
- Rock Hill, SC
- County
- York County · 281,758 people
- City population
- 115,874
- Metro
- Charlotte-Concord-Gastonia, NC-SC
- Population (ZIP)
- 58,199
- Household income
- $68,543
- Rent vs Own
- Severe rent burden
- 1869.0
Population outlook (York County) Hauer SSP2
- Today (2025)
- 307,757 people
- By 2030
- 335,979 · +9.2%
- By 2040
- 391,378 · +27.2%
- By 2050
- 443,234 · +44.0%
- By 2075
- 557,102 · +81.0%
- By 2100
- 625,837 · +103.4%
Race, ethnicity, and origin ACS 2023
- Neighborhood character
- Diverse neighborhood (Simpson 0.59)
- Race & ethnicity
- White 51% Black 39% Hispanic / Latino 4% Two or more races 4% Native American 2% Asian 1%
- Common ancestry
- Serbian 2% Slovak 2% Lithuanian 1%
- Foreign-born
- 4% · Canada, Vietnam, China
- Languages at home
- 95% English-only · Spanish 3%
Political lean MEDSL · York
- 2024 margin
- R (+19.1) · D 39.7% · R 58.8% · Other 1.5%
- 2008→2024 swing
- -1.4pp toward R · 2008: -17.7pp · 2024: -19.1pp
- All cycles
- 2024: R+19.1 2020: R+16.5 2016: R+22.1 2012: R+20.5 2008: R+17.7
Not yet ingested
- Civics
- —
Market trends
- HPI YoY
- ▼ -285.91%
- Current HPI
- 268.2609
- Rent YoY
- ▲ 5.53%
- Metro
- Charlotte-Concord-Gastonia, NC-SC
- State GDP YoY
- ▲ 4.51%
- F500 in state
- 2
Industry mix (Fortune 500 HQ in SC)
| Industry | F500 HQs | Revenue |
|---|---|---|
| Packaging | 1 | $7B |
|
||
Price history
2 events — show timeline
- 2026-05-19 Pending — CANOPYMLS as Distributed by MLS Grid
- 2026-05-14 Listed $225,000 CANOPYMLS as Distributed by MLS Grid
Property tax history
+6.6%/yrLatest (2025): $1,132 · +19.5% YoY. Source: county tax records.
Cash-flow waterfall
monthlySold comps — $/sqft
last 12 mo · ≤1 miLoading sold comps…