 🏷️ Likely Rental
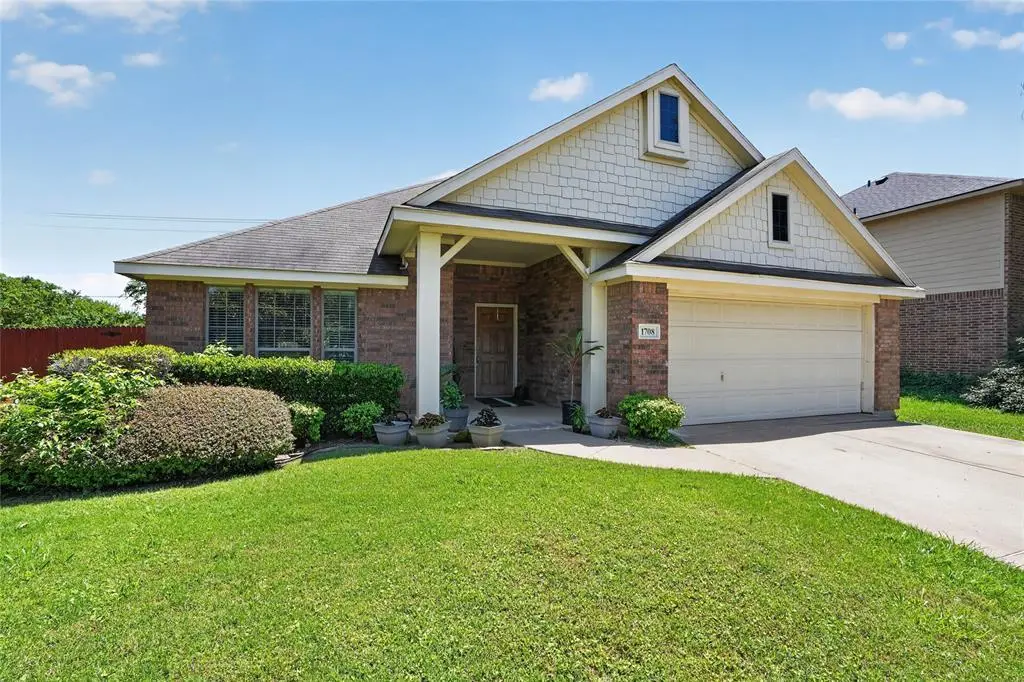
1708 Cowtown Ct · Mansfield, TX
Flood risk 1/10 · Minimal
- FEMA flood zone
- X (unshaded)
- Chance of flooding over 30 yrs
- 0.0%
- Est. flood insurance / yr
- —
Fire risk 5/10 · Moderate
- Est. fire insurance / yr
- $1,222 – $2,270
Heat risk 7/10 · Major
- Hot days now (above 110°F)
- 7 days/yr
- Hot days in 30 yrs
- 21 days/yr
Wind risk 6/10 · Moderate
- Chance of severe wind over 30 yrs
- 19.0%
Air-quality risk No data
- Unhealthy air days now
- —
- Unhealthy air days in 30 yrs
- —
Risk factors via First Street. Map © Google.
Why this score? — see what drove the D+ grade
The composite is a weighted blend of 9 inputs, each scored 0–100. Each bar is that input's sub-score; the figure is the points it added to the 100-point composite (weight × sub-score).
- ARV discount +15.0/15.0
- Cash flow +12.1/30.0
- Schools +4.6/10.0
- 1% rule +3.9/10.0
- DSCR +3.6/10.0
- Livability +3.6/5.0
- Condition / age +2.5/5.0
- Rent growth +2.2/5.0
- Appreciation +0.0/10.0
$240,000
🖨 Deal sheet 📄 Offer letter ✓ Due diligence
Listing remarks
Great opportunity in Mansfield ISD for investors or future homeowners. Tenant occupied 3 bedroom 2 bath single story home offering approximately 1500 square feet on a quiet cul de sac in South Mansfield. Functional open concept layout with a low maintenance lot and strong rental potential in a high demand area. Zoned to Annette Perry Elementary Charlene McKinzey Middle School and Mansfield Lake Ridge High School. Convenient access to TX 360 US 287 and TX 161 with nearby shopping and dining at Mansfield Towne Crossing and The Shops at Broad. Currently income producing with lease details available ideal as a rental or future primary residence. Showings by appointment only do not disturb tenan
Key facts
- 6,360 sq ft lot
- 2 garage spots
- Built 2005
Property features AI
Finance
- Other: Property is listed as residential, single family; not attached; Lot less than 0.5 acre
- Financial info: Acceptable financing: Cash, Conventional, FHA, VA
- HOA & community: Mandatory HOA; HOA provides full use of facilities; HOA fee is $327 (frequency: other); HOA management: RTI/Community Management Associates, Inc. (972-943-2820)
Exterior
- Parking: Attached garage; 2 covered/garage parking spaces
- Utilities: City water; City sewer; Electricity available; Not in a municipal utility district
- Home design: Single family residence; Residential property; One story; Built in 2005
- Construction: Composition roof
- Exterior features: Wood backyard fencing
Interior
- Kitchen: Kitchen island; Other appliances
- Bedrooms: 3 bedrooms (primary bedroom on level 1)
- Flooring: Carpet; Ceramic tile
- Bathrooms: 2 full bathrooms
- Heating & cooling: Central heating; Central air conditioning
- Interior features: High-speed internet available; Kitchen island; One-level layout; One living area; One dining area
- Laundry & utility: No specific laundry/utility details provided
Neighborhood map
What this means for you Summary
Snapshot
- This is a 3-bed/2.0-bath single-family listed at $240k.
Deal economics
- At list price, monthly cash flow is $-53 ($-639/yr) — negative.
- To cash-flow at today's rent, offer at most $231k (3.9% below list).
- To meet the 1% rule (rent ≥ 1% of price), the offer needs to be $214k (10.9% below list).
- Recommended offer: $214k (10.9% below list) — sets the bar for 1% rule.
- Cap rate 6.0% vs local median 2.8% in Mansfield — top-decile yield for the area; either an underpriced asset or a hidden risk that comps aren't pricing in. Stress-test before assuming the spread holds.
Location & tenants
- Location reads 72/100 on livability (#243 in TX) — a middle-class / working-renter tenant base. Strengths: employment A+, housing A+, crime A; Watch: amenities F, commute F, health & safety D-.
- Mansfield ISD (suburban): math 47% / reading 53% proficiency, ranked #125 of 826 in TX (top 15%) — acceptable for families but not a draw, mixed tenant base, ~2y average lease.
- Zoned schools: Annette Perry El (math 44% / reading 41%, grade F, #1,313 of 4,322 statewide, top 31%, 522 students, 48% FRL).
- Market conditions: Rents soft (-1.2%/yr); 715 active listings in the ZIP; 18 comparable units currently listed for rent nearby; rentals at typical pace (median 19d on market — plan ~3-4 weeks tenant-placement turnaround); high-income renter base; 18,938 units permitted in Tarrant County in 2024 (8,336 in 5+ unit buildings).
Forward outlook
- Local home prices are declining (-3.0%/yr); year-one equity from $2k of loan paydown is wiped out by about $7k of value loss. Plan a longer hold.
- Tarrant County population projected at +41% by 2050 — long-run rental-demand tailwind backs the buy-and-hold thesis.
Negotiation context
- It's been on market 27 days — a 2% lower offer ($236k) is reasonable based on typical stale-listing flexibility.
Risks & watch-outs
- Climate carrying-cost: major wind risk; moderate wildfire risk; extreme-heat days projected 7→21/yr by 2055 (HVAC capex compounding) — expect insurance premiums to compound above CPI over the hold.
Questions for the listing agent
- What do current leases actually rent for vs. the listed asking? Can we see a recent rent roll and the last 12 months of T-12 income?
- What does the HOA fee cover, when was the last increase, and are there any pending special assessments or reserve-fund shortfalls?
- Is there a deadline driving the sale (1031 exchange, divorce, estate, relocation)? That informs how much negotiation room exists.
- Schools are A-rated — typically a magnet for longer-tenancy family renters. What's the average tenant stay here, and is there a school-zone premium baked into asking?
- The area grade is low — what's the realistic commute time and amenity access for the typical tenant pool here? Any planned neighborhood developments (good or bad) we should know about?
- What's the average days-on-market for RENTAL listings here right now (not sales)? A rising rental-DOM trend means longer vacancies and softer asking-rent achievability than the comps imply.
- What's the recent tenant-quality profile in this submarket — average credit score on applications, eviction rate, late-payment / NSF rate, and stable-employment percentage? A property-management company in the area should have these aggregated.
- How much new for-sale + rental construction is in the pipeline within 1–3 miles? Heavy new supply typically softens prices + rents 12–24 months out; constrained supply supports both.
Investment metrics
- 1% rule
- 0.89% ✗
- Cap rate
- 6.03%
- Cash-on-cash
- -0.95%
- DSCR
- 0.96
- GRM
- 9.3
CMA / ARV
- ARV (median comp)
- $311,833
- List price
- $240,000
- Delta
- -23.04%
- Verdict
- UNDERPRICED
- Comps
- 20 within 1.0 mi
Show comp detail 8 sales within ~0.75 mi
| Address | Dist | Beds/Ba | Sqft | Sold | Price | $/sf | Match |
|---|---|---|---|---|---|---|---|
| 1012 Cutting Horse Dr | 0.47mi | 3/2.0 | 1,512 (+2%) | 1mo | $310,000 | $205 | 75 |
| 1316 Wood Dr | 0.57mi | 3/2.0 | 1,456 (-2%) | 2mo | $179,999 | $124 | 68 |
| 1300 Lacey Oak Dr | 0.17mi | 3/2.0 | 1,630 (+10%) | 14mo | $409,000 | $251 | 65 |
| 924 Remington Ranch Rd | 0.24mi | 3/2.0 | 1,659 (+12%) | 12mo | $325,000 | $196 | 60 |
| 1015 Cutting Horse Dr | 0.46mi | 3/2.0 | 1,582 (+6%) | 11mo | $309,999 | $196 | 59 |
| 910 Remington Ranch Rd | 0.17mi | 3/2.0 | 1,334 (-10%) | 24mo | $325,000 | $244 | 55 |
| 1309 Vinewood Dr | 0.65mi | 3/2.0 | 1,344 (-10%) | 9mo | $219,900 | $164 | 46 |
| 1343 Honeysuckle Dr | 0.56mi | 3/2.0 | 1,344 (-10%) | 23mo | $225,000 | $167 | 39 |
Match score weights: distance 35% · size 25% · config 20% · recency 20%. Top-matched comps best support the ARV.
Projected returns pro-forma
-3.0% appreciation · 0.0% rent growth · sell at horizon
- IRR
- -21.4%
- Equity multiple
- 0.28×
- Total profit
- $-48,466
- Equity at exit
- $35,785
- IRR
- -25.0%
- Equity multiple
- -0.05×
- Total profit
- $-70,454
- Equity at exit
- $20,751
Cash invested: $67,200 (down + closing). Projections, not guarantees.
Landlord ↔ Tenant lean methodology
- Overall (STATE)
- 87 Strongly Landlord-Friendly
- State Texas
- 87 Strongly Landlord-Friendly · R+5
- County
- — inherits STATE
- City
- — inherits STATE
ZIP-level market 76063
- Home prices YoY
- -29.5%
- Rents YoY
- -1.2%
- Active inventory
- 715
- Price-to-rent
- 9.3×
Monthly cashflow live
- Estimated rent
- $2,139 high interval (Pro) →
- Mortgage (P&I)
- −$1,259
- Tax from tax record
- −$58 /mo · $692/yr
- Insurance
- −$100
- HOA
- −$327
- Vacancy / Maint / Mgmt
- −$449
- Net cashflow
- $-53
Break-even live
UW: 25.0% down · 7.5% · 30yr · 1.5% tax · 5.0% vac · 8.0% maint · 8.0% mgmt
Financing live
Cash to close
- Down payment
- $60,000
- Closing costs
- $7,200
- Reserves months
- —
- Total cash needed
- —
Loan-product check · same deal, 3 products live
Conventional
25% down · 7.5% · 30yr
- Down + closing
- —
- Monthly P&I
- —
- Monthly cashflow
- —
- DSCR
- —
- Eligible?
- —
Personal DTI + credit; lowest rate.
DSCR
20% down · 8.5% · 30yr
- Down + closing
- —
- Monthly P&I
- —
- Monthly cashflow
- —
- DSCR
- —
- Eligible?
- —
No personal income docs; deal must DSCR.
Hard money
10% down · 12.0% · 12mo
- Down + closing
- —
- Monthly P&I
- —
- Monthly cashflow
- —
- DSCR
- —
- Eligible?
- —
Short-term bridge; refi at stabilization.
Rent comps 18 comps
| Address | Beds | Baths | Sqft | Rent | $/sqft | DOM | Units | Dist |
|---|---|---|---|---|---|---|---|---|
| 925 Remington Ranch Rd Mansfield, TX | 3.0 | 2.0 | 1524 | $2,350 | $1.54 | 11d | 1 | 0.25mi |
| 609 Kings Way Dr Unit A Mansfield, TX | 3.0 | 2.0 | 1064 | $1,800 | $1.69 | 43d | 1 | 0.95mi |
| 906 Fort Worth St Mansfield, TX | 3.0 | 2.0 | 1383 | $2,051 | $1.48 | 7d | 1 | 0.99mi |
| 627 McKown Dr Mansfield, TX | 3.0 | 2.0 | 1377 | $2,000 | $1.45 | 24d | 1 | 1.02mi |
| 800 Fort Worth St Mansfield, TX | 3.0 | 2.0 | 1383 | $1,875 | $1.36 | 43d | 1 | 1.03mi |
| 608 Hillcrest St Mansfield, TX | 3.0 | 2.0 | 1282 | $1,800 | $1.40 | 2d | 1 | 1.09mi |
| 307 Kings Way Dr Mansfield, TX | 3.0 | 2.0 | 1220 | $1,790 | $1.47 | 24d | 1 | 1.11mi |
| 303 Kings Way Dr Unit B Mansfield, TX | 2.0 | 2.0 | 1064 | $2,200 | $2.07 | 1d | 1 | 1.13mi |
| 2000 Nahvi Rd Mansfield, TX | 2.0 | 1.0–2.0 | 922 | $2,679 | $2.91 | 1d | 18 | 1.14mi |
| 649 Blueberry Hill Ln Mansfield, TX | 3.0 | 2.0 | 1441 | $2,075 | $1.44 | 1d | 1 | 1.28mi |
| 305 Live Oak Dr Mansfield, TX | 4.0 | 2.0 | 1320 | $2,000 | $1.52 | 43d | 1 | 1.33mi |
| 313 Hillcrest St Mansfield, TX | 4.0 | 1.5 | 1600 | $3,000 | $1.88 | 43d | 1 | 1.34mi |
| 309 Hillcrest St Mansfield, TX | 3.0 | 2.0 | 1300 | $1,950 | $1.50 | 43d | 1 | 1.35mi |
| 625 Hollyberry Dr Mansfield, TX | 3.0 | 2.0 | 1303 | $2,150 | $1.65 | 18d | 1 | 1.40mi |
| 621 Hollyberry Dr Mansfield, TX | 3.0 | 2.0 | 1152 | $2,180 | $1.89 | 3d | 1 | 1.42mi |
| 15 Foster Ct Mansfield, TX | 2.0 | 2.0 | 950 | $1,400 | $1.47 | 24d | 1 | 1.42mi |
| 609 Blueberry Hill Ln Mansfield, TX | 3.0 | 2.0 | 1796 | $2,195 | $1.22 | 12d | 1 | 1.42mi |
| 606 Plainview Dr Mansfield, TX | 2.0 | 2.0 | 1246 | $1,881 | $1.51 | 12d | 1 | 1.44mi |
HOA detail
- Monthly dues
- $327 · $3,924/yr
Listing history 8 events
-
2026-06-03status $240,000 Pending 27 DOM
-
2026-06-02days on market $240,000 Active Option Contract 27 DOM
-
2026-06-01days on market $240,000 Active Option Contract 26 DOM
-
2026-05-31days on market $240,000 Active Option Contract 25 DOM
-
2026-05-14historical Active Option Contract 701-char remark
-
2026-05-06$240,000 Active 701-char remark
-
2018-05-15soldstatus
-
2017-04-17soldstatus
ⓘ Source: listings_history table (triggers on properties + properties_extension) + one-shot
backfill from property_details.listing_events for pre-trigger history.
Tax reassessment forecast TX · Resets to sale price
- Current annual tax
- $692 · $58/mo
- Projected year-2 tax
- $4,392 · $366/mo
- Expected delta
- +$3,700/yr (+$308/mo · 534.8%)
ⓘ Screening estimate from a state-policy table — verify with the county assessor before closing.
Climate risk First Street
- Flood 1/10 Low FEMA zone X (unshaded) · 0% chance over 30 yrs
- Wildfire 5/10 Major
- Heat 7/10 Severe 7 d/yr ≥110°F today · 21 d/yr by 30 yrs out
- Wind 6/10 Major 19% chance of damaging wind over 30 yrs
Nearby sold comps map
Loading sold comps map…
Walkable amenities ~0.75 mi
Loading nearby amenities…
Taxation est. · year 1
- Rental income
- $25,671
- − Mortgage interest
- −$13,444
- − Property taxes
- −$692
- − Insurance
- −$1,200
- − Repairs & maintenance
- −$2,054
- − Management
- −$2,054
- − HOA
- −$3,924
- − Depreciation
- −$6,982
- Taxable loss
- −$4,678
- Est. tax savings @ 24.0%
- +$1,123
- After-tax cash flow
- $484/yr
For passive investors: Depreciation is non-cash, so a rental often shows a tax loss while cash-flowing — sheltering income. Rental losses are passive: they offset passive income freely, and up to $25,000/yr can offset ordinary (W-2) income if you actively participate and your MAGI is under $100k (phasing out to $0 by $150k); unused losses carry forward. On sale, claimed depreciation is recaptured at up to 25%, and gains may owe capital-gains tax (a 1031 exchange can defer both). Figures are a year-1 estimate at your 24.0% rate — not tax advice; consult a CPA.
Schools (NCES district)
- District
- Mansfield ISD
- NCES district ID
- 4828920
- Math proficiency
- 47% ▼ -17.00%
- Reading proficiency
- 53% ▼ -6.00%
- Median HH income
- $81,934
- Composite
- 45.82/100
- National rank
- #2558
- State rank
- #125 of 826 in TX
Livability — Mansfield
- Score
- 72/100
- State rank
- #243
- US rank
- #5833
Category grades
Schools grade is shown separately in the Schools card above.
Census & demographics
- Census place
- Mansfield, TX
- County
- Tarrant County · 2,033,669 people
- City population
- 82,625
- Metro
- Dallas-Fort Worth-Arlington, TX
- Population (ZIP)
- 82,625
- Household income
- $118,946
- Rent vs Own
- Severe rent burden
- 2081.0
Population outlook (Tarrant County) Hauer SSP2
- Today (2025)
- 2,380,417 people
- By 2030
- 2,578,900 · +8.3%
- By 2040
- 2,974,995 · +25.0%
- By 2050
- 3,350,489 · +40.8%
- By 2075
- 4,216,909 · +77.2%
- By 2100
- 4,741,527 · +99.2%
Race, ethnicity, and origin ACS 2023
- Neighborhood character
- Diverse neighborhood (Simpson 0.65)
- Race & ethnicity
- White 52% Black 22% Hispanic / Latino 17% Two or more races 10% Asian 4%
- Hispanic origin (detail)
- Mexican 14%
- Common ancestry
- Italian 2% Slovak 1% Lithuanian 1%
- Foreign-born
- 12% · Canada, Vietnam, China
- Languages at home
- 82% English-only · Spanish 10% Other Indo-European 2% Vietnamese 2%
Political lean MEDSL · Tarrant
- 2024 margin
- Lean R (+5.1) · D 46.7% · R 51.9% · Other 1.4%
- 2008→2024 swing
- +6.6pp toward D · 2008: -11.7pp · 2024: -5.1pp
- All cycles
- 2024: R+5.1 2020: D+0.2 2016: R+8.7 2012: R+15.7 2008: R+11.7
Not yet ingested
- Civics
- —
Market trends
- HPI YoY
- ▼ -108.63%
- Current HPI
- 259.1952
- Rent YoY
- ▼ -1.18%
- Metro
- Dallas-Fort Worth-Arlington, TX
- State GDP YoY
- ▲ 3.95%
- F500 in state
- 110
Industry mix (Fortune 500 HQ in TX)
| Industry | F500 HQs | Revenue |
|---|---|---|
| Energy | 16 | $1,198B |
|
||
| Technology | 5 | $198B |
|
||
| Engineering / Construction | 4 | $72B |
|
||
| Energy Services | 3 | $60B |
|
||
| Utilities | 3 | $41B |
|
||
| Healthcare | 2 | $330B |
|
||
Price history
5 events — show timeline
- 2026-06-03 Pending — NTREIS
- 2026-05-14 Contingent — NTREIS
- 2026-05-06 Listed $240,000 NTREIS
- 2018-05-15 Sold (Public Records) — Public Records
- 2017-04-17 Sold (Public Records) — Public Records
Property tax history
-0.1%/yrLatest (2025): $692 · -17.8% YoY. Source: county tax records.
Cash-flow waterfall
monthlySold comps — $/sqft
last 12 mo · ≤1 miLoading sold comps…